
by Bernie McCune
[Note: This post is based on a presentation by Bernie McCune given at the 16 March 2019 meeting of the Cruces Atmospheric Sciences Forum in Las Cruces, NM. Ed.]
It has been 40 years this year since the Charney Report was published with a number of proposals for what CO2 being emitted into the atmosphere from  human sources would likely do to global surface temperatures or so-called anthropogenic global warming. Similarly, the UN Intergovernmental Panel on Climate Change (IPCC) was formed about that same time to determine the effects of human activity on global temperature.
Over the next few decades a large number of models (at least 73) were developed to show what these effects might be and terms for the models were devised.
Two of these terms, Equilibrium Climate Sensitivity (ECS) and Transient Climate Response (TCR), were developed. The ECS was the term that determined what doubling of atmospheric concentration of CO2 might do to global average temperature. The TCR was the term that showed how a growing level of human emissions into the atmosphere might affect the increasing atmospheric CO2 concentration.
Equilibrium Climate Sensitivity (ECS)
From the time of the Charney report, ECS was estimated to be in a range from 1.5o C to 4.5o C. This range of values was based on two climate models, one by Syukuro Manabe and the other by James Hansen.
Manabe’s model showed an average of ECS = 2o C while Hansen’s model indicated that ECS = 4o C. Jule Charney suggested that a reasonable error range might be +/- 0.5o C. Consequently, this somewhat arbitrary 0.5 error estimate was subtracted from Manabe’s value and added to Hansen’s value so that ECS = 1.5o C to 4.5o C, and until recently, that has been the accepted wide range of values for ECS.
Almost all of James Hansen’s predictions in the past have had a political bias and have also been wrong. Why would the IPCC base their ECS on a couple of models that are 40 years old and have never been validated?
The Hot IPCC Models
From the beginning all but a few of the many IPCC models have run hot. The predicted temperature values of most of the models very quickly diverged to the high side of what actual global average temperature was when compared to satellite and ballon sonde data. This is illustrated below in Figure 1.
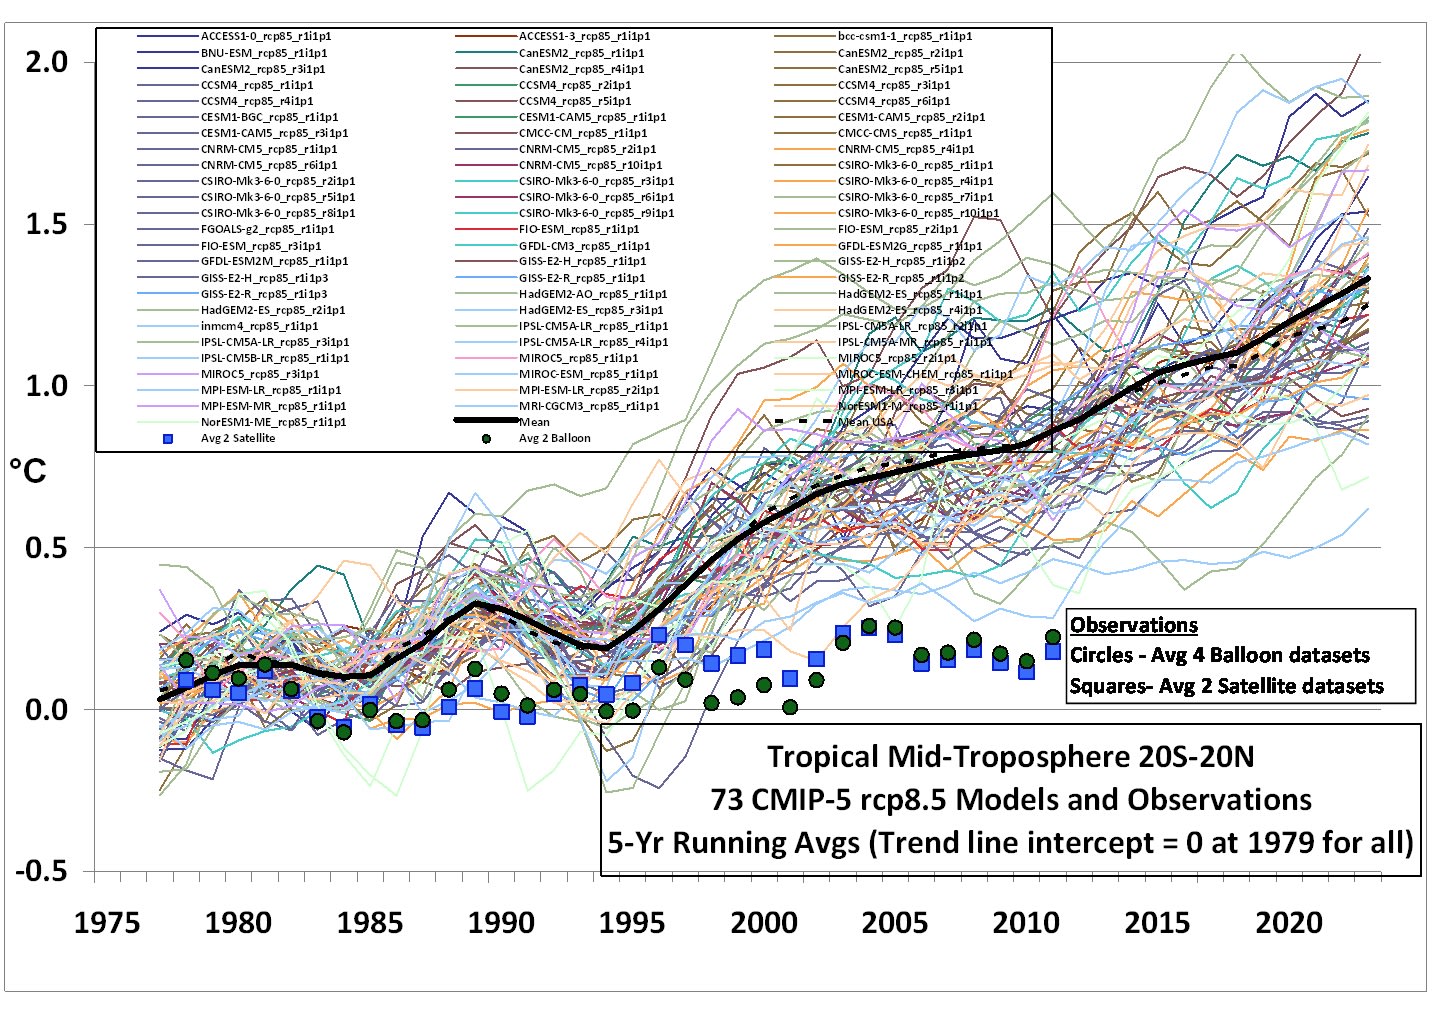
Note above that the average of all the IPCC models (bold black line) has dramatically diverged over the past 25 years from the real data shown by blue squares (average of two different satellite datasets) and black circles (average of 4 balloon datasets). Actual satellite data up until the present shows no dramatic increase in temperature. In fact, as seen in the satellite-

based plot in Figure 2, the temperature between two naturally occurring grand El Ninos (in 1998 and 2016) was remarkably flat. During that almost 2-decade flat temperature period, human CO2 emissions went from 25 to 35 gigatonnes. In 1979, human CO2 emissions were about 20 gigatonnes.
In spite of these ongoing model errors, there was no attempt by the IPCC modelers to modify the very wide 3°C range of expected ECS values(1.5 to 4.5°C). In fact, many climate scientists and environmental groups decided to use even more extreme values of ECS in a range from 5° to 10° C. With the Charney range, no one really offered any justification for it other than the original somewhat arbitrary value based on two existing models circa 1979.
Beginning in the 1990s, some scientists suggested that only half of the high end could be attributed to humans. Actually, a whole set of CO2 sources and sinks both natural and man-made were identified. This more natural view was driven by some skeptical folks who thought that natural solar and ocean cycles might also have some effect on global warming.
During the last couple decades, a number of studies have indicated that actual ECS and TCR values have decreased significantly. This is illustrated in Figure 3, which is from Scaffeta in his 2017 paper “Natural climate variability, part 2: Interpretation of the post 2000 temperature standstill”.

There are a few cases where ECS values are estimated to be less than 1o C such as Richard Lindzen’s study in 1998 and more recent work by Monckton and Briggs.
I tend to agree with this less than 1o C effect. Assuming 1o C is the correct value for the ECS, I can’t imagine how even the most extreme alarmist can say we are all going to fry with the remaining increase of 0.2o C in global average temperature. We have already seen 0.8 increase from over a 100 years ago when atmospheric CO2 was 270 ppm.
Obviously, there are natural effects on CO2 concentration in the atmosphere, but this alarmist doubling paradigm so far has ignored them.
The Right Climate Stuff group in Houston had a major disagreement with the IPCC saying that the metrics of ECS and TCR were unrealistic (and unvalidated).
They developed their own measurement term called Transient Climate Sensitivity (TCS). This term was based on the rise in global average temperature due to the actual gradual rise of CO2 in our atmosphere until CO2 levels are doubled.
TCS was estimated by the TRCS team to be 1.8K with a doubling of CO2. For a detailed look at their rationale see my previous presentation on Skeptical Models. This was only one of a number of recent studies that seemed to drop the average temperature increase due to a doubling of CO2 in the atmosphere.
Why do alarmist still consider that the consequences of actual ECS even at the low end of 1.5oC with a small margin of error, to be dire and that we have to remove all human CO2 emissions? All their arguments seem unrelated to science anymore and the relevance of the CO2 argument seems to be diminishing.
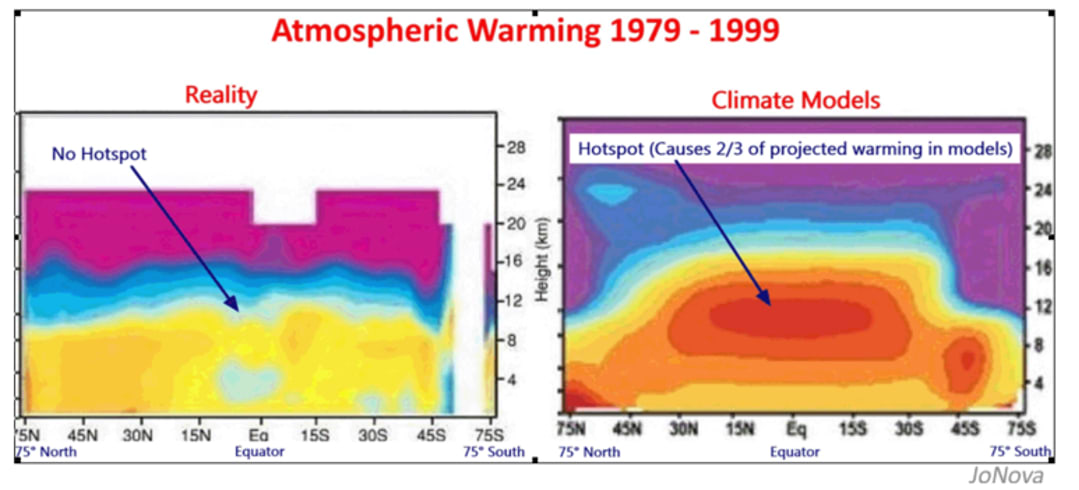
The Missing Hot Spot
The models have predicted that due to radiative effects of CO2, a hot spot should form in the troposphere above the equator. Again the models are proven wrong by actual data from a large amount of weather balloon flights which show no hot spot (left panel in Figure 4 below.)
Henry’s Law
Transient Climate Response as a IPCC model term is also a sleeper issue. If Henry’s Law is real, why would we need a mechanism to show how increased human emissions will warm the planet? Basically, Henry’s Law tells us that the temperature of the ocean or atmosphere increases before atmospheric CO2 increases and not the reverse.
Looking at actual global human emissions of CO2, they were steady at 5 gigatonnes/year until 1960 when they began to increase. Presently they are about 38 gigatonnes/year.
This activity should have increased the rate of CO2 going into the atmosphere, but on average that rate has remained about 2 ppm/year. The only variations in that average rate seems related more to natural occurring events – especially El Ninos, La Ninas and volcanic activity rather than human activity.
So why is there a human based TCR term in the models in the first place, and how can it’s magnitude and cause even be determined?

No one ever explains how that will happen other than increasing human CO2 emissions, but those emissions have dramatically increase over past several decades with only natural causes increasing specific annual rates of CO2 going into the atmosphere as noted in Figure 5.
Figure 5 displays all of the data that came from the beginning of the establishment of the Mauna Loa station (in 1959) until recent times. It shows measured annual increases of CO2 in the atmosphere from all sources.
What Drives CO2 Fluctuations ?
Several things are readily apparent. The most dramatic annual changes can be directly correlated to several different natural drivers.
One is large volcanic eruptions into the stratosphere of micro-particulates and sulfurous gases. When these eruptions occur, that individual year’s measured increase of CO2 is generally much lower than average, where average is slightly less than 2 ppm.
Clearly, this is because incoming sun energy is blocked and that reduces sea surface and atmospheric temperatures. This lowers temperature over the year where the wide spread distribution of particulates in the upper atmosphere occur.
This is a clear and quick response that proves Henry’s Law is a natural and non-human phenomenon. It is well known that these tiny particles can remain in the atmosphere for periods up to a year or more and at their maximum can drop solar surface insolation by up to 100 watts/m2.
Volcanoes are denoted by * in Figure 5. It should be noted that significant CO2 from these eruptions seems to have little effect on temperature, but the drop in insolation is very dramatic.
Another major driver of natural annual CO2 increase into the atmosphere are the El Ninos and for decrease into the atmosphere are La Ninas as shown in Figure 5.
These ENSO effects once again prove that Henry’s Law is definitely a major player in the dynamics of atmospheric CO2 fluctuations. Even the slow increase in CO2 concentration in the atmosphere from 1960 denoted by the stair-step horizontal black lines can be explained by the Atlantic Multi-decadal Oscillation (AMO)/Pacific Decadal Oscillation (PDO) cooling phase in the 1960s and 70s and their warming phase during the 30 years from the late 70s until recently. What little human caused warming that may exist seems to be lost in the noise.
The Effect of Water Vapor and Clouds on Temperature
The IPCC was originally formed to determine the human effect on rising temperatures. They have never really attempted to find natural effects caused by solar variations or for that matter any other GHG other than CO2. Water vapor is the GHG having a much larger effect on solar input and outflow to and from our global system than any of the other GHGs.
I worked at the White Sands Missile Range solar furnace, which is located in the Chihuahuan desert of New Mexico, in the early 1980s. Daily solar input was measured with an Eppley pyrheliometer.
Seasonal solar noon readings gave us some interesting data. Readings during the summer monsoon rainy season on cloudless humid days averaged about 850 watts/m2 , while during the very dry autumn days at solar noon they were 950 watts/m2 or more.

The high water vapor content during the summer months significantly decreased solar input, while the very dry autumn fall and winter months allowed a large amount of solar energy to reach the earth’s surface. CO2 radiative effects are apparently about 3 watts/m2 max. Thick clouds decreased the Eppley readings to zero. Thin clouds and jet contrails dropped overall readings somewhere between 50 to 100 watts/m2 at most.
The Cost of the ECS Problem
It is important to emphasize that after all these years and a very large cost of digging into climate fundamentals, we still have an IPCC sponsored ECS with a very large range of error.
How much has it cost to not really solve the ECS problem? It is probably never going to be fully known what actual costs were, but we know how much the US government spent over the years on just climate research alone. After some effort to separate it all out, the bottom line is $166 billion. This is an appalling return on investment considering that the Apollo program that put men on the moon cost only $200 billion.
This does not even include the vast amount of money and wasted effort that were spent on regulating and destroying useful public/private endeavors in the US and around the world caused by climate and environmental requirements that were based on flawed models.
Think about the attacks on energy systems that were targeted as polluters due to incorrectly labeling them as carbon villains. We are still in the process of drastically trying to modify our energy systems to reduce their carbon footprint with no real scientifically supportable reason and thus no real benefit.
Until recently, EPA policy assumed an ECS =10oC. Imagine the financial implications of that silly notion.
Apparent Trend Toward Lower ECS Values
Some alarmists are now admitting that after almost 40 years of remaining in the broad range of 1.5 to 4.5, the true value of ECS is closer to the lower end of this very wide range of temperatures. With CO2 increasing from about 270 ppm in the pre-industrial era to 410 ppm at present (a 140 ppm increase), we have seen an increase of only about 0.8oC (though in my opinion almost all of this warming is driven by natural phenomena.)
I calculate that at the present rate of increase in atmospheric CO2, the total value of atmospheric CO2 will double to 540 ppm early in the next century. The temperature will only rise because of this doubling by a few tenths of a °C (and only 0.7oC more if the alarmists are correct about CO2 as a main driver of global temperature increases). My guess based on credible data and the theory of human based CO2 emissions (probably bogus), is that temperature will increase by maybe another 0.2oC and by 2110 atmospheric CO2 will not even have reached 500 ppm.
Here is a quote from Hal Doiron who is on the The Right Climate Stuff team of ex-NASA engineers and scientists . “These IPCC climate scientists need some adult supervision.” He felt that they had not paid attention to some fundamental issues when they began to define the concept of climate change.
I also have issues with the IPCC scientist’s approach. They often ignored natural causes of temperature change which included such things as El Nino events, which then became de facto human-caused events. As odd as this may sound, by ignoring natural elements of climate change, these scientists are apparently able to blame all climate influences on humans.
There are standard practices for problem solving using well known engineering and scientific processes as well as a technique of independent validation and verification for model algorithms and code. A number of these IPCC climate scientists have apparently not used any of these methods and seem to have made up things with the blessing of the political organizations who funded them. The politicians had their own agenda which, too often, seemed to not include truthful outcomes.
A hypothesis for determining climate change or any warming effects must consider all possibilities. Present climate change dogma seems to ignore natural variability, or it assigns some arbitrary mix of human and natural warming effects. In reality, a new process will have to adopt a series of testable experiments to validate all aspects of climate change (especially with regard to the models). Arbitrarily adopting an anthropogenic global warming policy as IPCC has done, is completely unscientific.
The climate story as we see it today is becoming more and more a fairy tale. Most AGW proponents are predicting at the very least a 2oC or 3oC average global temperature increase in the next few decades and up to 10oC when CO2 doubles. This is mostly based on their models.
The TCR, which is a driver of the first prediction, is claimed to be caused by human emissions. The ECS, which is a driver of the second prediction, is caused by a doubling of atmospheric CO2 (which many alarmist climate scientists believe – with little evidence – is mostly man caused. )
In my opinion, alarmists such as Hayhoe and Overpeck, who are recent presenters to an NMSU- and Senator Udall-sponsored local alarmist climate series and who support model based warming, are misinforming the public and making up facts to make their point.
Overpeck’s idea of a human-driven drought such as a warm temperature atmospheric sponge is also a creation that cannot exist in the real world. Incidentally, Hayhoe completely dismisses natural causes of climate change.
What if natural cycles were the real main drivers of climate change, and we could prove it. Our hypothesis is that human causes are tiny compared to sun-driven ocean systems, space weather, and the earth’s magnetosphere where all are part of the sun’s effects. Also, all forms of water can have significant solar effects by reducing inputs during the day and modifying radiative effects at night, which reduces heat lost to the very cold desert night sky.
Both ECS and TCR which are major factors in AGW models are very small or just manufactured. Also large values of ECS and any value for TCR are not supported by the data.
The Environmental Connection
The environmentalists are convinced that humans are causing damage to the planet by using fossil fuels to pollute our atmosphere, and this is the sinful part of this whole global warming argument. Their attitude seems to be, “Knowing what we know, who does not want to stop these horrible activities, and who really cares about the complicated truth when we have to act right now to save the planet?”
What if all these alarmists are completely wrong on all of it, and we waste all of our money and effort on the wrong solutions that make outcomes much worse? Who’s to blame then?
Is this whole environmental component to the climate change discussion a revenge of the hippies? It’s as if this long ago clan of “merry pranksters” have aged but have kept their old agenda. Their children have picked up the old environmental mantra – “save the planet, get rid of humans”.
Both of these groups have used their riches to take over the political arena with the intent to adopt this old population bomb scare tactic. There is now a well orchestrated pseudo-scientific plan to get rid of humans – but not them, of course, while at the same time grasping at old hippie solar and wind dreams even though such technology is not yet quite ready for the world stage.
This whole hope and dream of getting rid of nasty polluting fossil fuels does really grab the imagination, but, unfortunately for now, it is really still just science fiction and political (not the real kind) science.
Carbon Dioxide – Food of Life
Frankly over the past 50 years, we have done a very good job of cleaning up our environment including making all types of fossil fuels perform more efficiently with almost no real harmful products being put into the air or water – except for that maligned CO2 . Well, only as a warming agent, that is.
We have significant quantities of CO2 in our blood stream and lungs, and it is an excellent plant food. The present atmospheric concentration of 410 ppm is still well below 1000 ppm which is the lower bound limit for optimum growth of trees and plants.
Thanks to the increasing concentration of carbon dioxide the earth has been getting significantly greener as shown in Figure 7 below. This is not the result of an air pollutant but a necessary component of life on earth that is currently at a less than optimum concentration.

The whole idea of CO2 as a significant Greenhouse Gas is an embarrassment to the entire scientific and environmental community. We know that water, water vapor and clouds are much more significant components creating Greenhouse Gas effects.
These alarmists assume that human emissions of CO2 are a major cause of catastrophic global warming, but we actually see cyclical warming and cooling and only a modest near term warming trend as an artifact of coming out of the Little Ice Age.
The climate alarmists ignore significant natural climate cycles based on solar fluctuations, El Nino Southern Oscillation (ENSO) patterns, and ocean/air circulation patterns. Also, they refuse to admit that growing atmospheric CO2 levels are just so much more plant food. They promote unvalidated models, which from the beginning have not had any correlation to real data. They also support an erroneous and large ECS that has supported a 40 year long spurious argument for alarming anthropogenic global warming.
Using Science to Solve Complicated Puzzles
Next I want to briefly discuss two examples of purely scientific questions that were none the less controversial and/or took some time to dig deeply into the complexity of the mechanisms that drove them. Ultimately, science won out, and they were both resolved in the later part of the 20th century. Even though we did not get into too many political fights over these issues, they were worth the effort to solve the puzzle that remained for so long.
Knowledge is power, so the resolution of these questions were of great benefit to all of us. Likewise, understanding more about natural climate change will allow us to plan and prepare for future weather and climate events. Ultimately, science will win the day.
The first concept was that of plate tectonics. This idea started late in the 19th century and continued to grow in controversy in the 20th century until it peaked in a series of battles in the late 1960s and early 1970s. Fortunately the main battle was fought within the scientific community, mostly between the young post docs and their mentor professors (especially the heads of departments who had real power and strong opinions). These opinions were almost universally against such an outrageous idea that tectonic plates were moving across the earth’s surface in various directions.
These battles mostly remained within the academic community and did not get very heavily politicized. Around the end of the 60s and the beginning of the 70s large amounts of data from satellites, ground measurements, as well as from under sea mid-ocean rift zones was coming together to support the wild stories being promoted by the post docs. Fortunately the data supported this now well established, albeit very fantastic at that time, plate tectonics geological phenomenon. Science and measurement data ultimately prevailed, and plate tectonics is now fully accepted by the scientific community.
My wife reminded me of a less dramatic scientific mystery but one that we both were involved with when we worked in Japan in the 70s and 80s. It was also controversial but the data finally uncovered most of the mystery. In the early 70s, my wife ,Ryoko, was a secretary at the International Latitude Observatory in northern Japan when I took a PSL satellite tracking station there to support the Japanese scientists’ work on polar motion.
In 1891, Seth Chandler discovered a wobble of about 30 feet in diameter in the earth’s pole over a period of about 14 months. Over this period of time a sinusoidal latitude shift was observed in sets of zenith stars. By 1899 a small number of global observatories along the same northern latitude line were establish with one of them being in northern Japan. Dr. Kimura founded the Japanese observatory in that year (1899) right about the middle of the Meiji enlightened period. The early part of the Meiji period had been a time when the emperor had pacified the local Daimyos and prepared Japan to engage the countries of the Western world.
Dr. Kimura had been gathering data and observing the wobble but was also interested in finding it’s cause. A number of geological phenomenon were actually determined to drive the wobble including deep mantle currents, atmospheric wind patterns, and large earthquakes. But there still was something missing in that set of data.
Dr. Kimura had at least determined the magnitude of that factor and added what he called the z term to the equation to cover some of the unresolved smaller elements. Long after his death and still at the time of my work at the ILO in Japan, the z term driver was unknown. Then in 2000 a JPL scientist reported that the question now had an answer. This is a quote from the news release:
“Writing in the August 1 issue of Geophysical Research Letters, Richard Gross, a JPL geophysicist, reports that the principal cause of the Chandler wobble is fluctuating pressure on the bottom of the ocean, caused by temperature and salinity changes and wind-driven changes in the circulation of the oceans. He determined this by applying numerical models of the oceans, which have only recently become available through the work of other researchers, to data on the Chandler wobble obtained during the years 1985-1995. Gross calculated that two-thirds of the Chandler wobble is caused by ocean-bottom pressure changes and the remaining one-third by fluctuations in atmospheric pressure. He says that the effect of atmospheric winds and ocean currents on the wobble was minor.
Gross credits the wide distribution of the data that underlay his calculations to the creation in 1988 of the International Earth Rotation Service, which is based in Paris, France. Through its various bureaus, he writes, the service enables the kind of interdisciplinary research that led to his solution of the Chandler wobble mystery. Gross’s research was supported by NASA’s Office of Earth Science, Washington, D.C.”
Consequently, as demonstrated in the previous example, the Chandler wobble was ultimately solved and accepted by science, and the controversy subsided.
Consequences of Political Solutions
Let’s get back to the global warming subject and discuss some of the consequences for using political solutions versus scientific solutions. We have just seen that sometimes these subjects are very complicated and require data and techniques that may take many decades to gather, analyze, and solve. In this climate discussion the outcomes will impact our environment, our energy choices, and our ultimate financial health.
We need to be brutally honest in our treatment of this matter and make sure that we have reached the final scientific truth in dealing with these climate mysteries. The consequences for wrong choices will most certainly be life and death at the extreme, and at the very least, they could lead to financial ruin.
On the issue of changing our energy base we know that the US is presently using fossil fuels for 80% of all our energy requirements and wind and solar for only 10% of that requirement (with the remaining 10% of our energy being supplied by nuclear, hydro, etc.).
Reversing this energy mix to even 80% wind and solar in the next few decades will require us to first assure ourselves that it is absolutely necessary to do it. To do this, we must engage in some very serious debate and reach the truth of the matter before we make the plunge.
Frankly, I suspect we probably have at least 50 years before we have to make that decision. By then we should be in a completely different technological environment and will probably easily have useful and inexpensive methods to deal with energy needs and climate issues. See my presentation on “Are We Running Out of Stuff” and Supporting Information and Reference Material.
Imagine the state of airplane technology early in the last century and what we have now. The Wright brothers could not even imagine the changes that would come as early as the 1940s.
Arbitrarily jumping into a major change of such a complicated integrated energy supply system could lead to much more than just a few deaths, more than minor blackouts, beyond slight annoyances and much greater than just a limited series of financial disasters.
We have seen this issue propagandized in the media as alarming global warming and ongoing extreme weather. Another view of some of the larger issues can be found at climatedollars.org.
See the brief video “The Climate Has Never Been Stable” by Dr. Steven J. Allen. Also look at some of the other videos on this site.
Earlier in this report, this same website discussed the amount of federal dollars that had been spent on climate research.
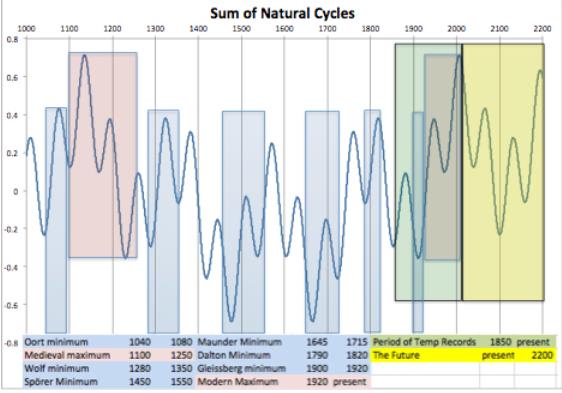
Ed Caryl’s Multi-cycle Model
Now let’s discuss an alternate view of predicting the future climate that is based more heavily on natural drivers to the changes. We will use Ed Caryl’s model that is based on ENSO ocean temperature cycles that have a period of about 60 years. Another cycle of about 200 years is based on the sun. The last one he uses is the 1000 year Bond cycle.
I discussed a number of skeptical models in a previous presentation that I gave last year. That presentation is available on the CASF website. Caryl’s model is just one of them. I like it because it uses some naturally occurring patterns that we have observed in the past. Figure 8 shows you what his model tells us about the next 200 years or so.

Temperatures shown on the right in Figure 8 are real past values (CET range = 2.5o C) with a hindcast of Caryl’s plots for the late 1800s until 1900 and so on. The longer purple cycle that is seen peaking around 2100 is the Bond cycle and is about 1000 years long. The approximate 200 year long green cycle which dips to a low just past 2100, is a solar cycle (some folks say it is a 172 year cycle). This cycle seems to drag the main cycle down to an average cooling trend over this 200 year period except for a brief warming spike in 2075 and 2140.
The 60 year ENSO ocean cycle is in red. It is now in a cooling trend and would be expected to cool us during the next several decades with some warming spikes but warming on average around 2050 when this cycle peaks at 2070. The spikey nature of his summed final curve is obtained by adding a random number generator to the values. Real averaged monthly temperature data has this chaotic pattern to it.
For more detail on his methods and to obtain the actual spreadsheet values that the plots were made from go to the Cruces Atmospheric Science Forum website (https://casf.me/ and at the Home page click on Categories and then click on Climate Models) or click this link.
Caryl’s plots have only a relative correlation to actual temperatures but the general trend of the plots over time are good on the X axis while we have to calibrate, to some degree, the amplitude in the Y axis. We can see some trends in the longer term plots of past and future shown in the Figure 9.
Look at the blocked portion of Caryl’s plots for the past and see how they line up with actual past solar related warming and cooling events. And as many climate scientists have noted we have entered and have been in a warming period since 1998 with a flat temperature still in evidence. Does the next decade of his plot show that things will really be cooler? And really cold in the next few decades after that? We shall see.
Conclusions
In conclusion, it really is not news that the IPCC models are very “fishy” with numerous problems. Clearly, the long unchanging record of large ECS and TCR values over the past 40 years are based more on politics than scientific effort. ECS is probably very tiny and the TCR value is probably manufactured and is actually zero. It is time we listened to the little boy – “But the Emperor has no clothes!”
It is way past time for us to dump the IPCC models and start looking for better ways to characterize climate change. We must directly challenge this band of wizards (of Oz?) who seem to be spreading fairy tales, even though for now it seems to be an impossible task. We must pull back the curtain and expose these charlatans with a bright scientifically powered light and engage these folks in a solid scientific debate.
With their use of ECS and TCR when combined with their omission of natural causes, the IPCC model predictions clearly suck! Also, it will be very interesting to see what the temperature record will show over the next couple of decades with regard to Caryl’s predictions.