
‘More evidence that Hurricane Michael was definitely NOT a Category FIVE storm at landfall.’
Robert W. Endlich
In late September 2022 Category Four Hurricane Ian struck southwest Florida bringing death and destruction to southwest Florida. Ian’s arrival and wind damage spurred me to take another look at when 2018’s Hurricane Michael struck the Panhandle of Florida, and NOAA’s 2019 declaration that Michael was a Category Five storm at landfall.
This is my new look at Hurricane Michael’s winds and NOAA’s 2019 report.
BACKGROUND AND DEFINITIONS
The Saffir-Simpson scale has become the Gold Standard in defining the effects from damaging hurricane winds.
The Saffir-Simpson scale of hurricane wind categories was devised by wind engineer Herb Saffir and meteorologist Bob Simpson to describe a scale of wind damage to common structures and trees based on the unobstructed speed of the peak one-minute winds at the standard anemometer height of 10 meters, about 33 feet. Note well the one-minute wind speed averaging time, quite separate from a peak gust, and the height of the characteristic winds, 10 meters.
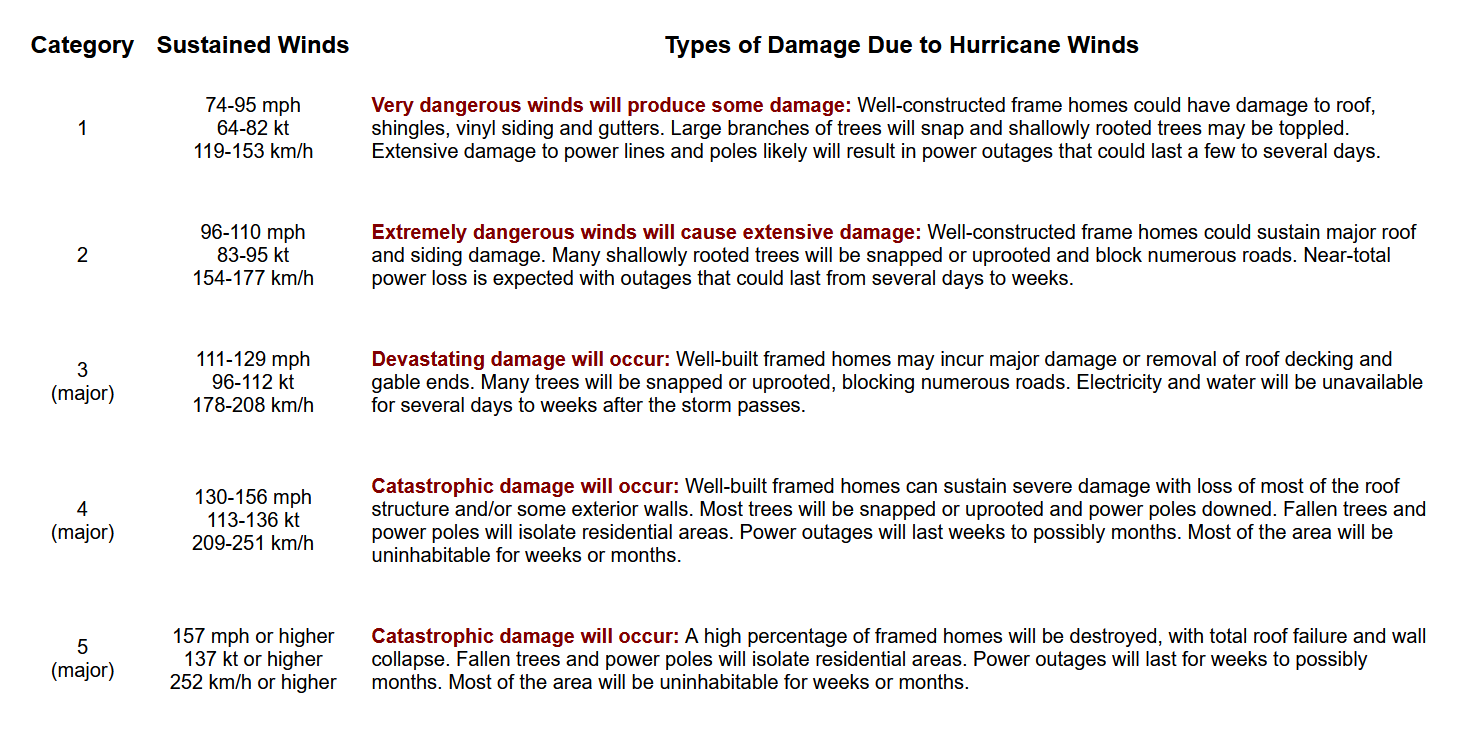
The definitions of hurricane categories as used by the National Hurricane Center are below, in Figure 1.
Some of this post refers to the wind measurements from Tyndall AFB, whose International Civil Aviation (often ICAO) code is KPAM, as Hurricane Michael came onshore on 10 October 2018.
A single airport runway has two designations depending on the direction of aircraft traffic, normally oriented so that aircraft take off and land into the wind.
At KPAM the runway is 13 if the winds are from the east, and aircraft are landing towards the southeast. 13 is the nearest ten-degree increment of the magnetic runway heading of 130 degrees.
If the winds are from the west and aircraft are landing from the southeast towards the northwest, the heading of a landing aircraft would be about 310 degrees magnetic, and it is named Runway 31.
At Tyndall AFB there are two parallel runways, the north paved strip is the main runway so when approaching from the east-southeast, 31R would mean the one on the right. If approaching from the west-northwest that main runway would be 13L, the one on the left.
The anemometer location listed in NOAA’s report is near a gate on US Highway 98, somewhere between a mile and 1.6 miles away from the standard anemometer location, adjacent to the approach end of the runway, depending on the direction of air traffic.
The Air Force bases where I was stationed during my active-duty days equipped both ends of the runway with anemometers, so at Tyndall AFB, I am assuming that there are two anemometers, one at the approach end of Runway 13L if winds are from the east, and another at the approach end of Runway 31R if the winds are from the west.
I mention two distances from NOAA’s reported Tyndall AFB anemometer location near that gate on Highway 98. The location reported by NOAA seems to be in error since it is not near the main runway, Tyndall AFB’s Runway 13L or Runway 31R.
An anemometer height of 10 meters is the ICAO standard for aircraft operations, and the one used in the Saffir-Simpson scale.
Florida has its own set of anemometers in support of it’s coastal management efforts, they are called Florida Coastal Management Program, or FCMP, measurements made 15 meters above the surface.
Two FCMP anemometers are listed in NOAA’s Hurricane Michael Report.
FCMP T3, Tyndall AFB, lies about 4-1/2 miles southeast of the Tyndall AFB’s Louisiana Avenue intersection of US 98, in the direction of Mexico Beach, FL.
FCMP T2, Beacon Hill, lies southeast of Mexico Beach, FL, and the coordinates listed for it plot over 1000 ft out in the Gulf of Mexico, another apparent error.
These wind measurement locations are plotted on maps which are part of the presentation graphics and in Figure 7 of this post.
HURRICANE MICHAEL’s LANDFALL WINDS
NOAA’s report contains numerous figures and tables where the data are presented in a stylized manner, formatted in light blue and white, which makes a pleasing and easy-to-use display. Some of those tabular data are screen-captured in the figures below.
Figure 2 below consists of three parts. The Top part is an extract of the Saffir-Simpson scale of hurricane wind Categories One and Two from NOAA’s definitions. The Middle part is a screen capture of the data set from Tyndall AFB’s anemometer at Michael’s landfall. The Bottom part is an explanation, which shows that the Maximum Sustained Winds at Michael’s landfall was 75 knots, far short, in fact 65 knots short, of NOAA’s claimed 140 knots.
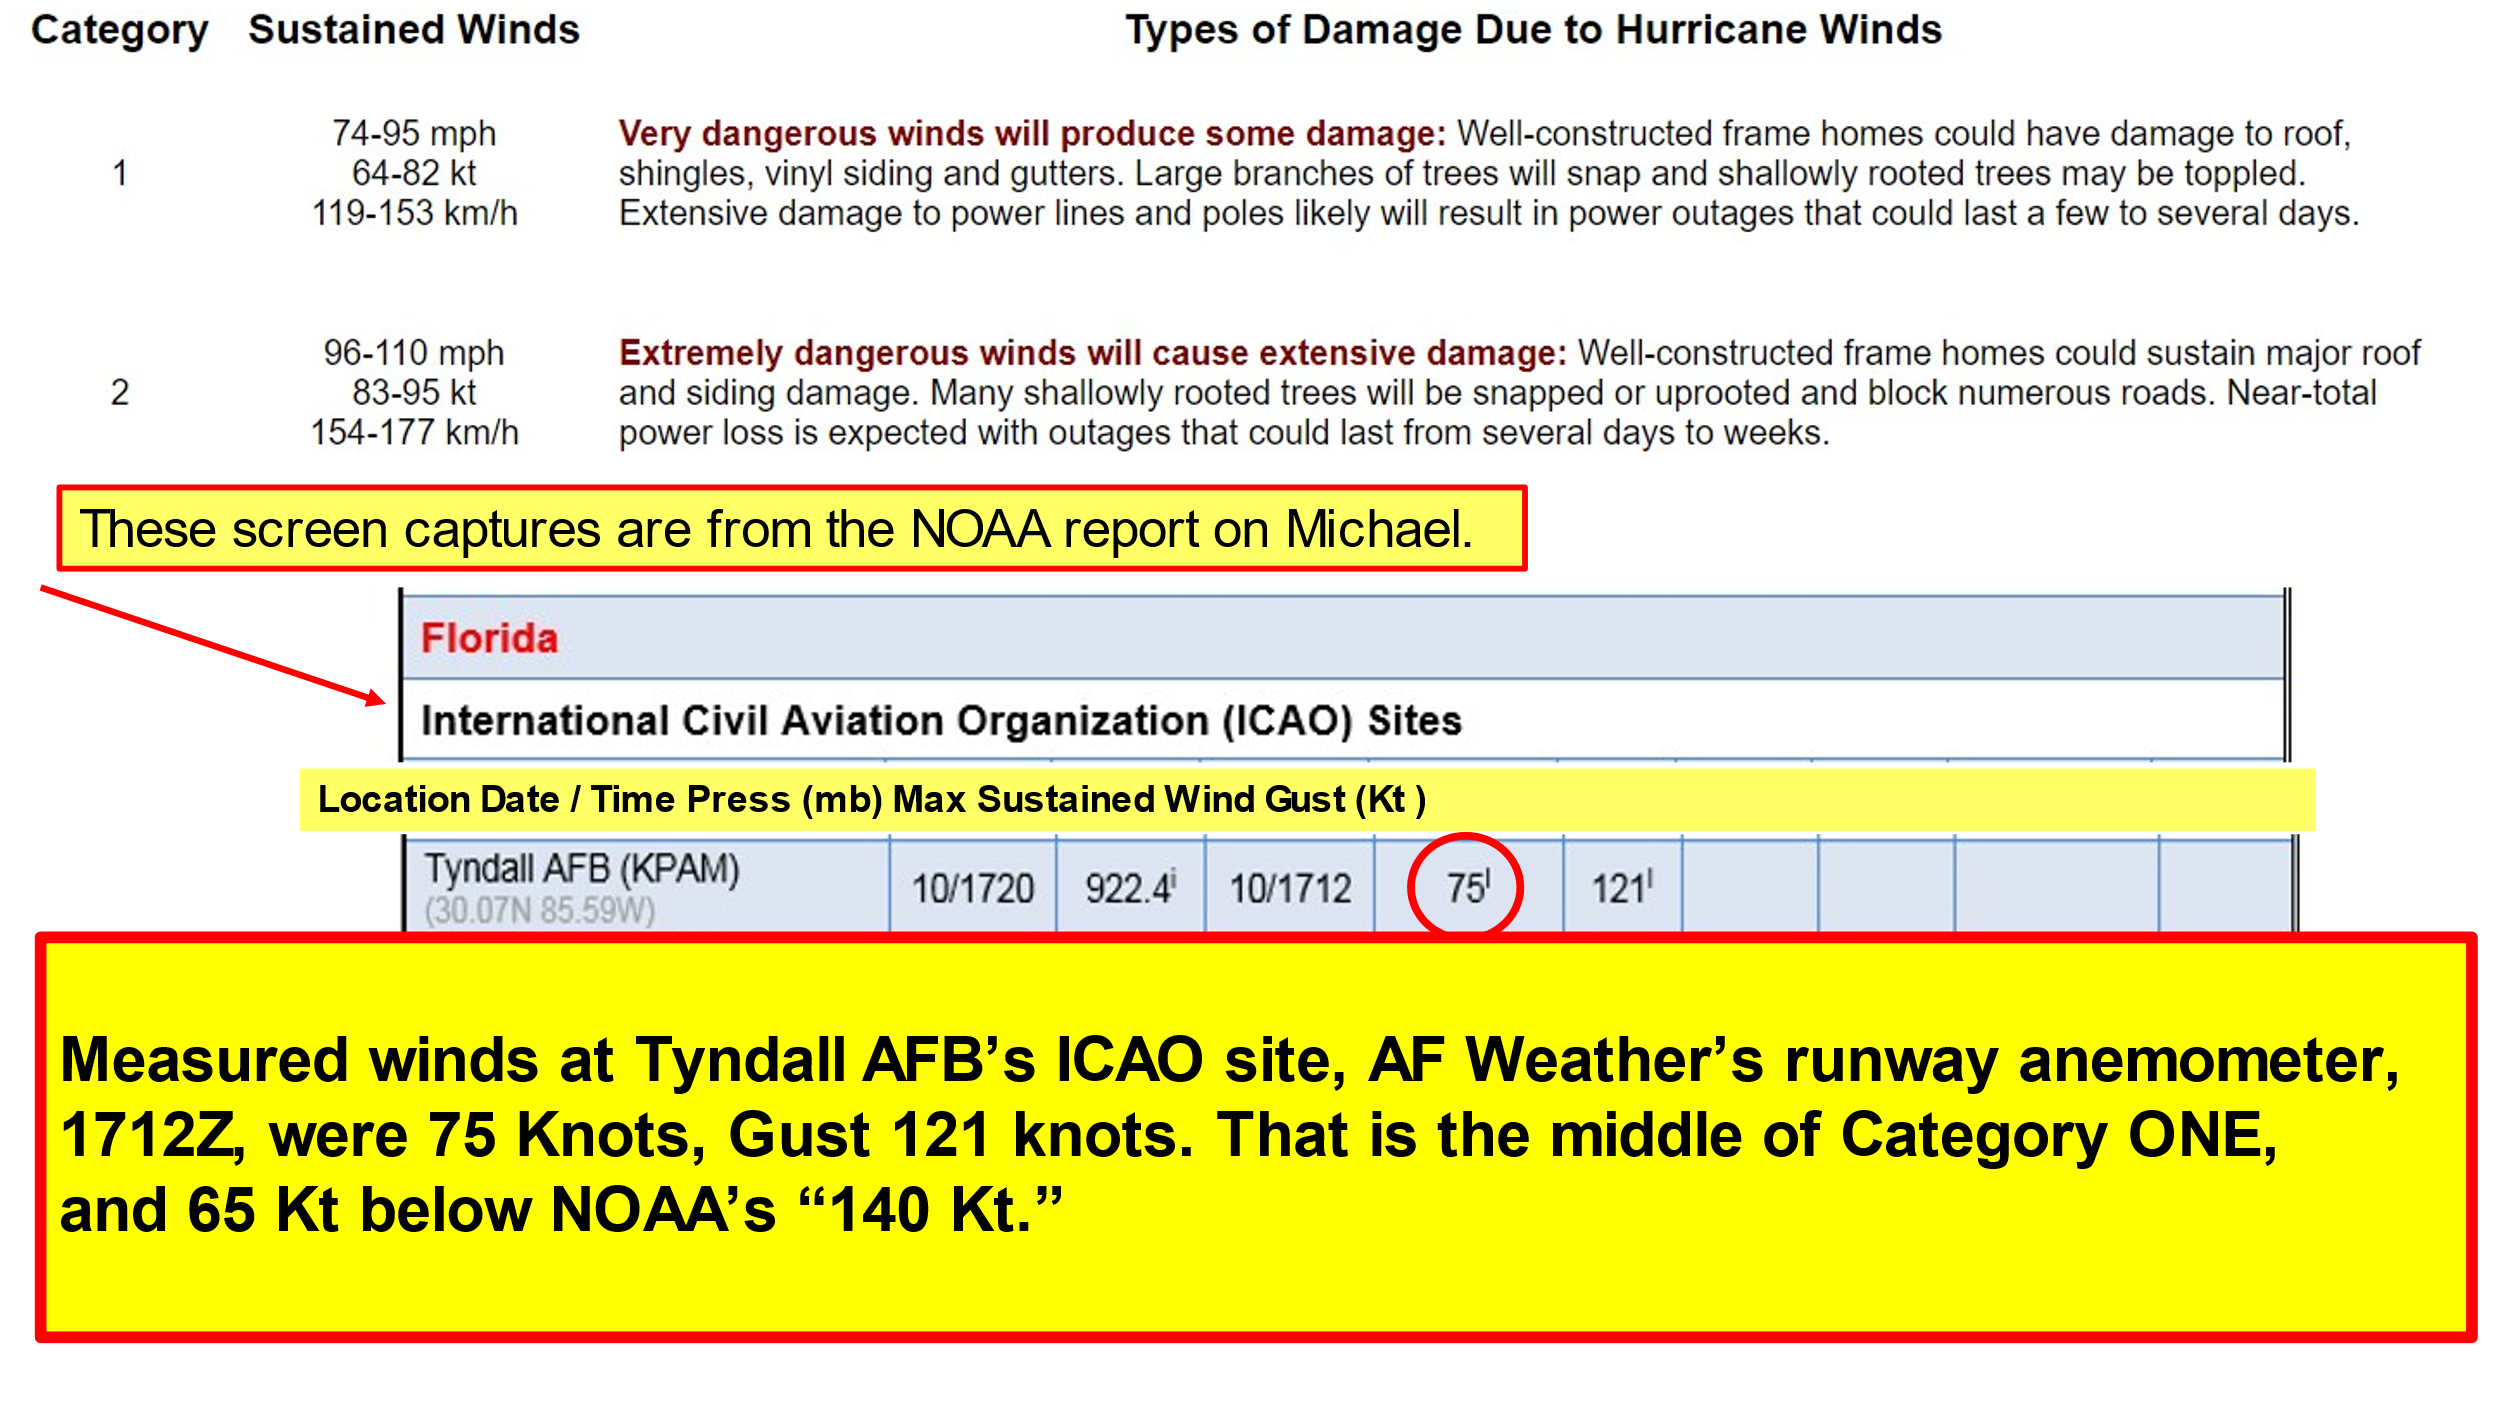
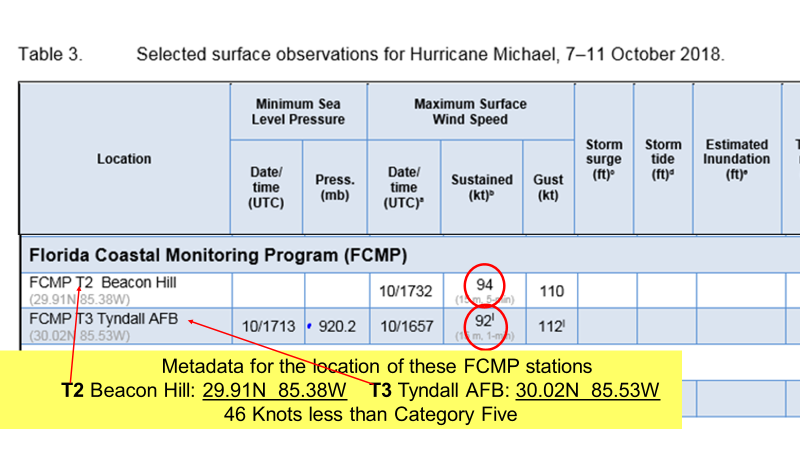
Figure 3 below is composed of screen captures from Table 3 of NOAA’s report on Michael showing the winds from both of the FCMP 15-meter wind towers when Michael’s Florida landfall occurred.
FCMP tower T3 is also located on Tyndall AFB, and it had Maximum Sustained Winds of 92 knots, 48 knots below the 140-knot speed claimed in NOAA’s report.
FCMP tower T2, at Beacon Hill, southeast of Mexico Beach, Florida, had a Maximum Sustained Wind of 94 knots, using a 5-minute rather than the 1-minute standard averaging period; 94-knot speed is 46 knots under the 140-knot speed claimed in NOAA’s report.
NOAA’S REPORT: WHERE THEY STRECHED THE TRUTH
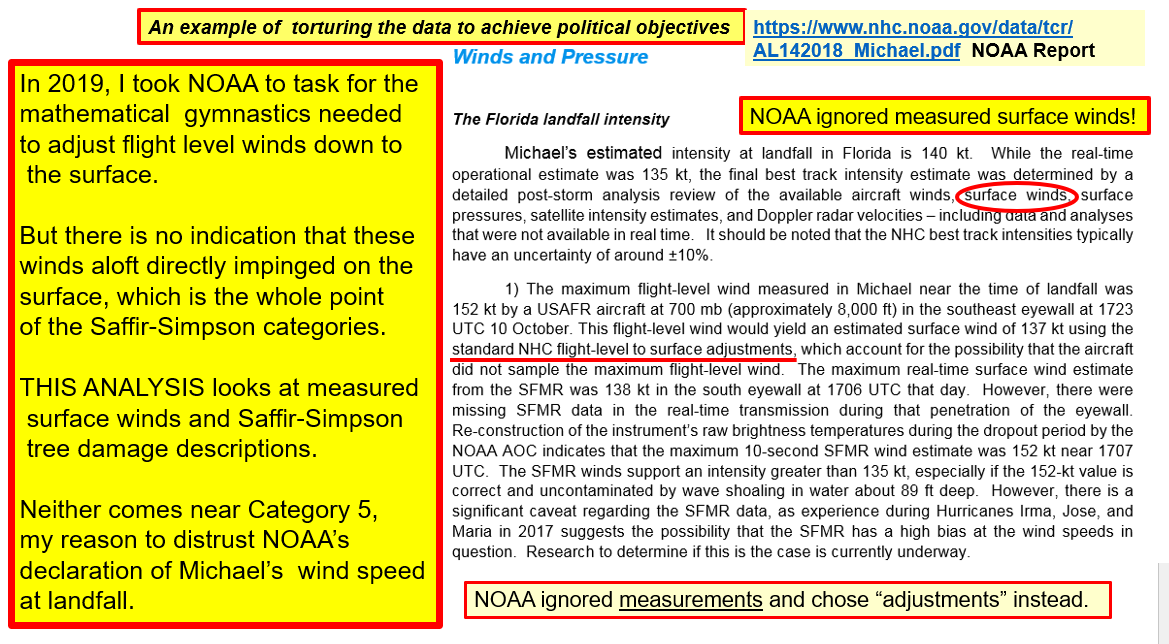
In NOAA’s Report, the most egregious errors I find are on Page 4, the “Winds and Pressure” section, specifically “The Florida landfall intensity” paragraph. Section 1 of that paragraph says,
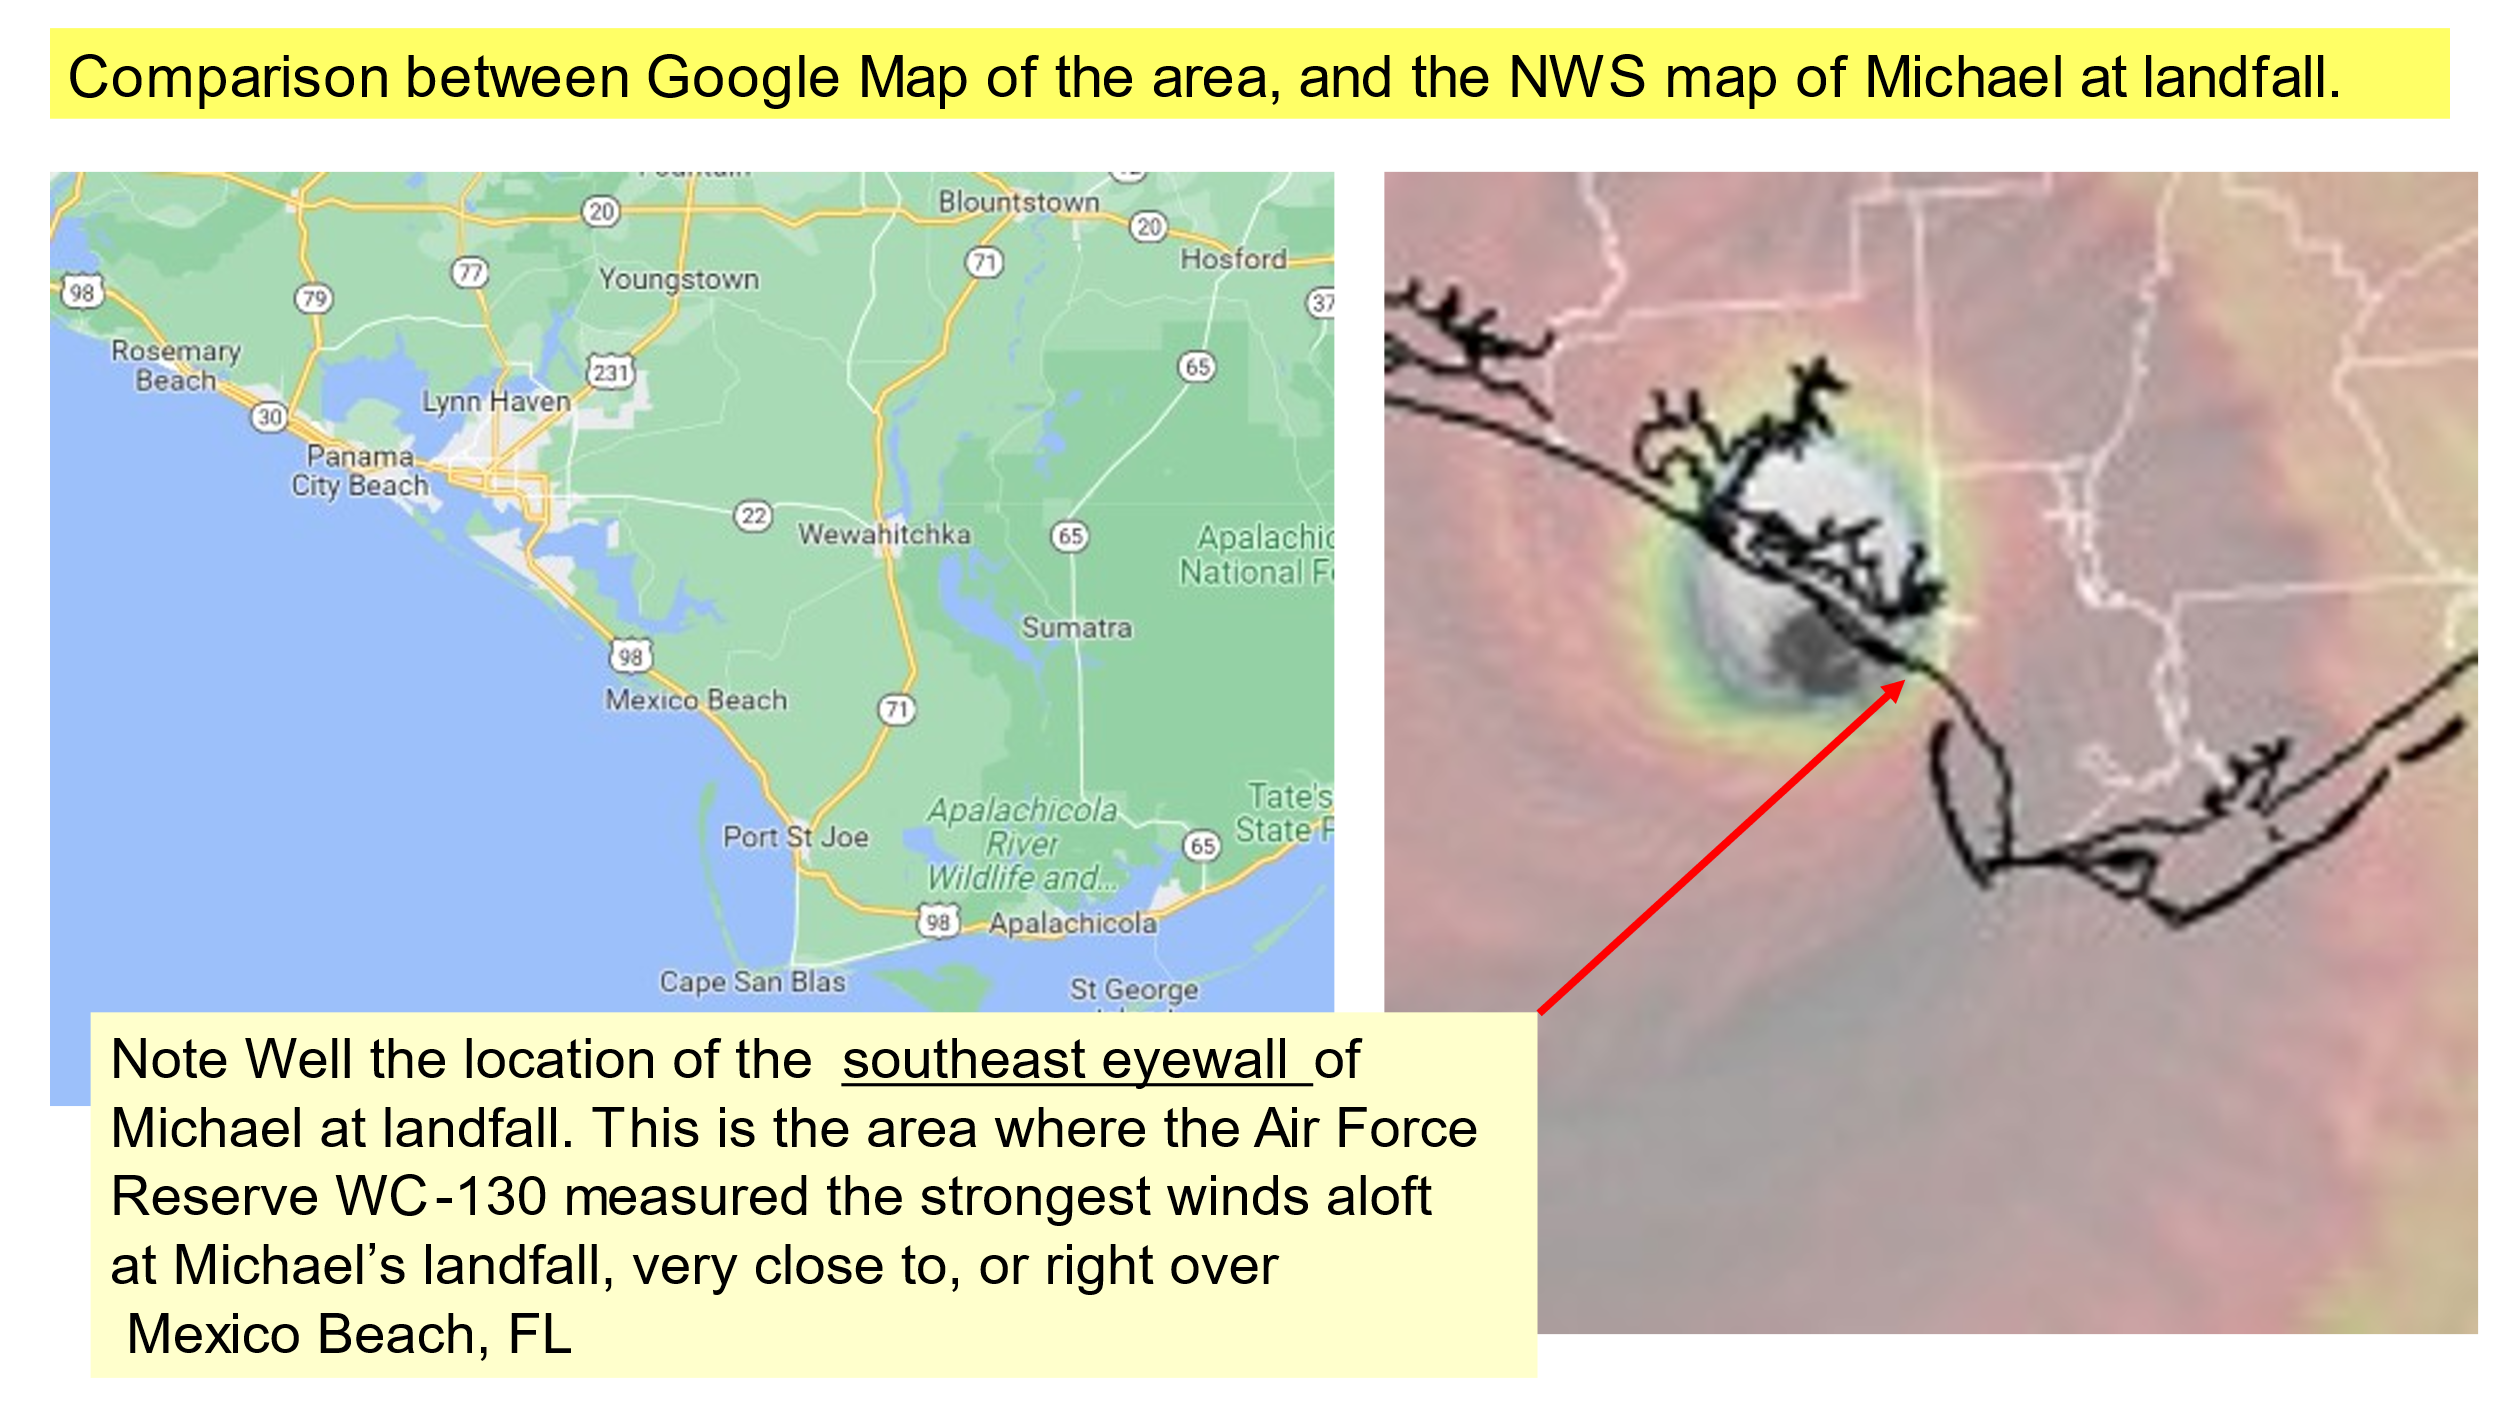
“The maximum flight-level wind measured in Michael near the time of landfall was 152 kt by a USAFR aircraft at 700 mb (approximately 8,000 ft) in the southeast eyewall at 1723 UTC 10 October. This flight-level wind would yield an estimated surface wind of 137 kt using the standard NHC flight-level to surface adjustments, which account for the possibility that the aircraft did not sample the maximum flight-level wind.”
Figure 4 below (Slide 6 in the presentation graphics) compares the Google Map of Hurricane Michael’s Landfall area with an NWS image of Michael at landfall. The southeast eyewall, quoted in the NOAA report just above, is very close to the distinctive Crooked Island Beach landform placing it very close to Mexico Beach, FL.
Mexico Beach, FL is the site of dozens of wind damage (from Michael) photographs especially those from Business Insider, each of which provides researchers an on-the-ground determination of the wind speed directly from the definitions from NOAA’s own “gold standard,” the Saffir-Simpson scale. There are eleven separate Michael-caused wind damage photographs in the presentation graphics, the overwhelming majority of which show Category One damage in Mexico Beach at landfall. I did find one Category Two damage photo, and one Category Four damage photograph. All of these are in the presentation graphics.
Here is the question I asked myself as I pondered NOAA’s report:
Why would NOAA take 10-second winds from the Air Force Reserve WC-130J Hurricane Hunter aircraft, flying about 8,000 ft MSL seemingly directly over the landfall area at the time of landfall, and then use “standard NHC flight-level to surface adjustments” as the basis for their “140-knot” determination of one-minute sustained winds at the surface, when directly below, in Mexico Beach, there are numerous instances of wind damage, direct photographic evidence, which show considerably lower winds that tend to agree with most of the actual measurements of the wind near the ground near Mexico Beach?
We will get more into the question of why NOAA uses “adjustments,” when direct evidence is plainly available, later in this post.
More examination of “The Florida landfall intensity” paragraph from the NOAA report, specifically their “detailed post-storm analysis review,” says plainly that they used surface winds in the 140-knot determination.
We’ve already seen these surface winds at landfall; they’re summarized in this table:
Location Mast Hgt. Max Sustained Surface Winds
Tyndall AFB (KPAM) 10m 75 knots (2-minute average)
FCMP T3 Tyndall AFB 15m 92 knots (1-minute average)
FCMP T2 Beacon Hill 15m 94 knots (5-minute average)
So plainly, from the NOAA report’s Table 3, NOAA ignored or did NOT use the surface wind measurements, instead they used “adjustments.”
In doing my analysis I scoured the literature for good pictures that would provide “ground truth” imagery, documenting the ground speed of Michael at the surface. I used the Saffir-Simpson scale, and points on the ground directly under the location where the USAFR WC-130J recorded the highest winds, the 10-second SMFR winds aloft, 152 knots. The best imagery I found was from the 14 Oct 2018 story from Business Insider, “25 photos show Hurricane Michael’s destruction from the sky.” Eleven of those photos from three sources are in the presentation graphics.
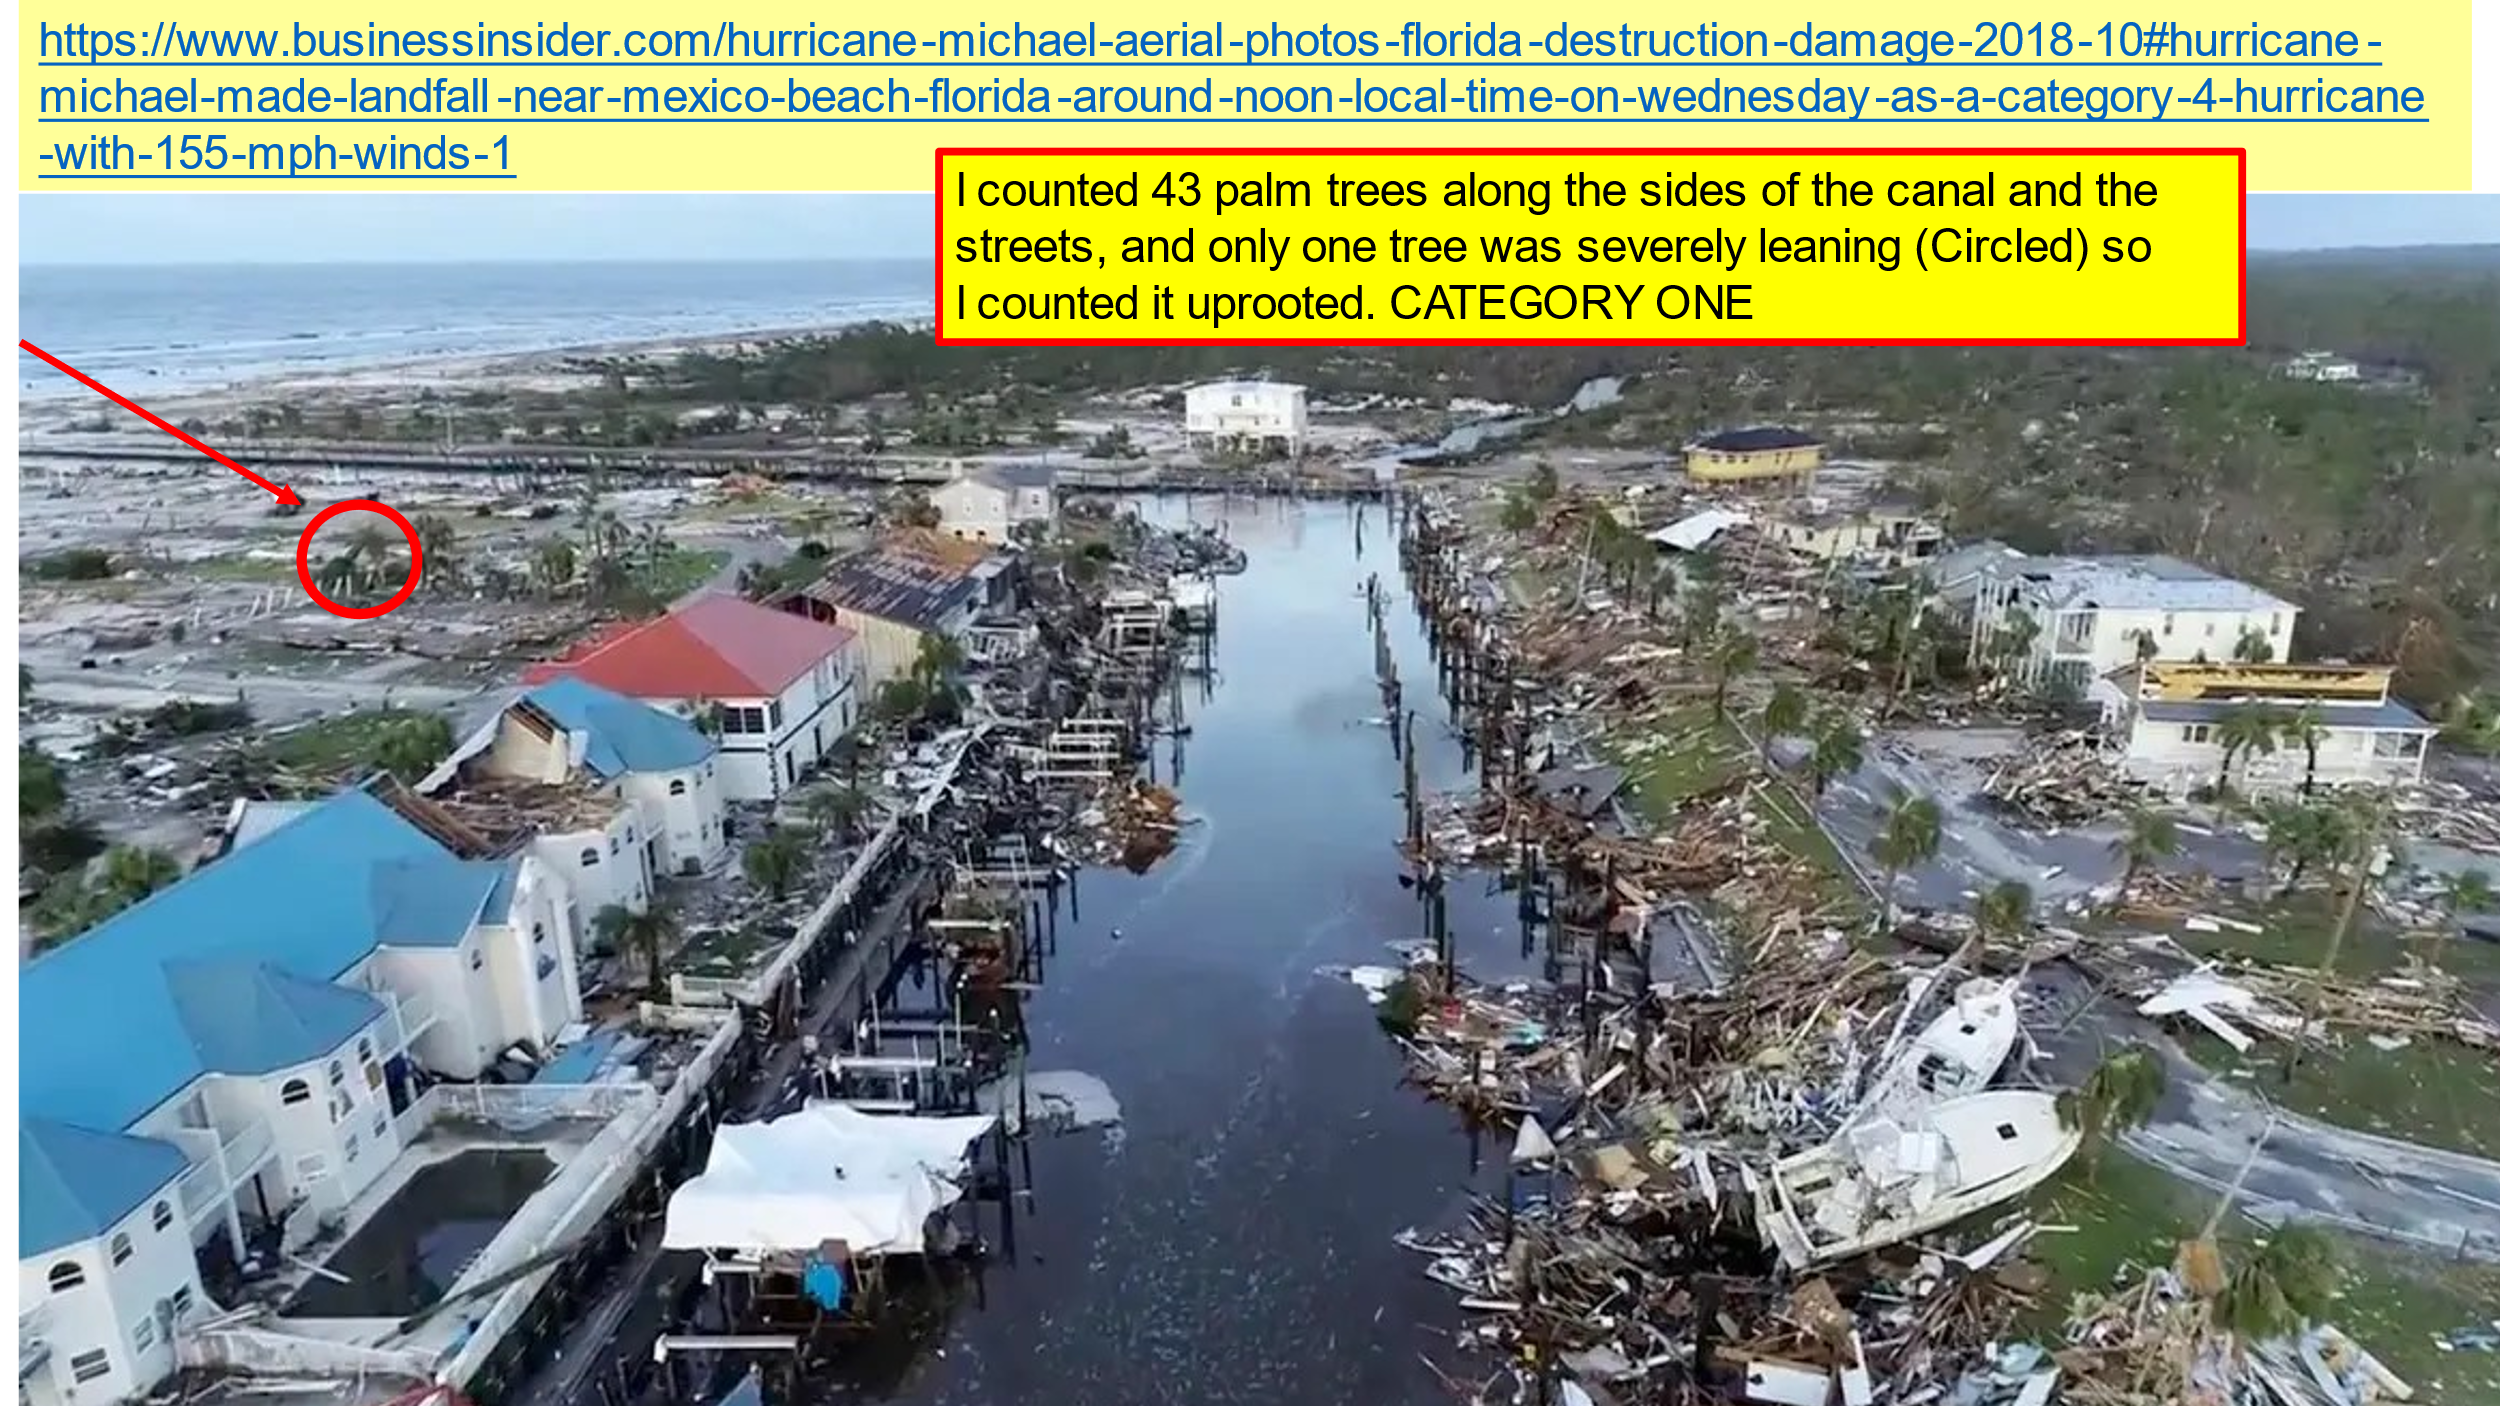
A good example of one of these photos, and my analysis, is below, in Figure 6.
Reasons why the image in Figure 6 ranks high for this purpose include:
Geolocation: The nearly right-angle bend in the waterway to the Gulf of Mexico on the west side of Mexico Beach makes for exceptionally good geolocation of the image and the damage.
Exposure: The sun is at the back of the camera; color rendition of the scene is excellent. Identification of the tree suffering apparent storm damage is easy, as is identification of trees with little or no storm damage.
Quantification: Identifying the tree suffering the damage and trees suffering little or no damage makes Saffir-Simpson category determination straightforward.
PUTTING ALL OF THIS TOGETHER
I looked at dozens of images of damage caused by Hurricane Michael in preparing this post. I used eleven separate images of tree damage from Mexico Beach in the presentation graphics because Mexico Beach was the location of the southeast eyewall of Hurricane Michael at landfall, and the location of the strongest wind aloft measured by the USAFR WC-130J aircraft.
Three of the images in the presentation graphics came from NPR, here and here, seven more came from Business Insider, and the lone Category Four image came from NWS. Of the eleven Mexico Beach images, nine were Category One, and most had good geolocation. The single Category Two image I used had only fair geolocation; it was a near-vertical view of two houses in a large group of palm trees. The lone Category Four image came from the NWS and was beach in the foreground and further back a cluster of many pine trees, 53 snapped and uprooted, 45 not snapped or uprooted. I guesstimated its location from the coverage of trees, more trees towards the western extremities of Mexico Beach.
I put together many of these in Figure 7 below, a map infographic.
The locations of the wind measurements are indicated with the red arrows.
The locations of the photos of wind damage to trees and the Saffir-Simpson categories are shown with the orange arrows. The Category One (Cat 1) damage photos from the presentation graphics have good geolocations. The Category Two and the Category Four are less certain because the images have poor geolocation clues within them.
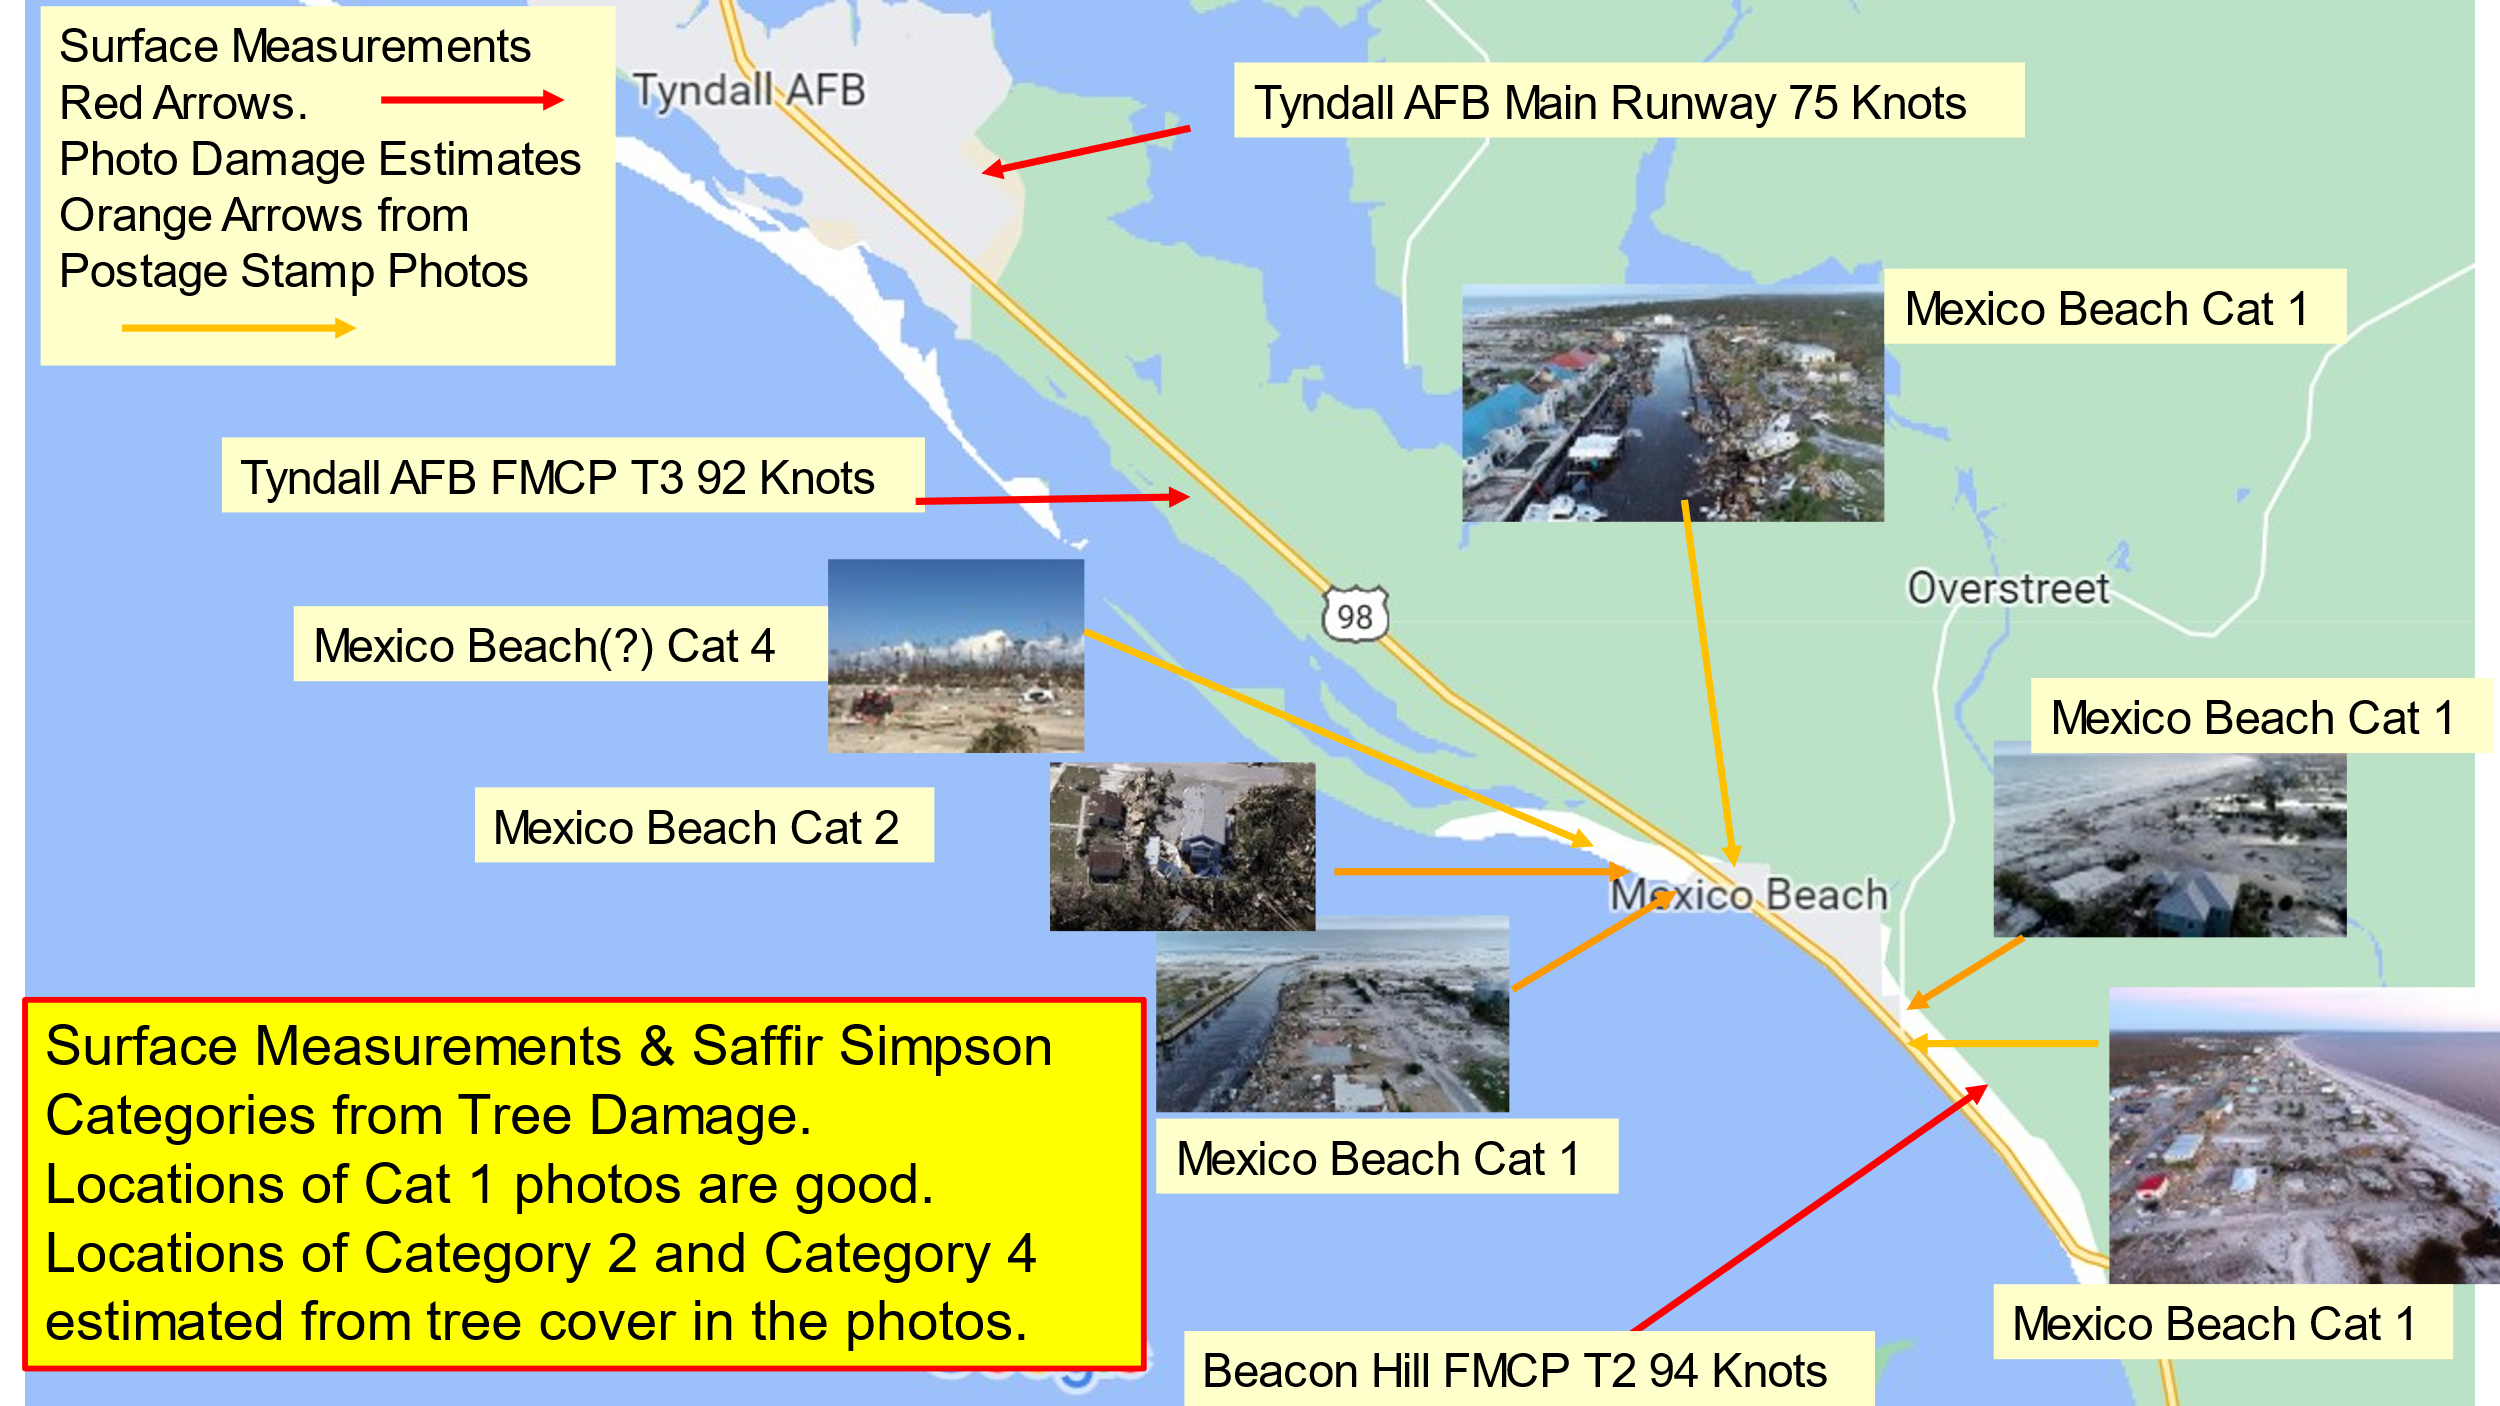
Consider this: 140 Knots is about 236 ft/second. In a one-minute or 60-second wind averaging time, a “parcel” of air moving at that speed would cover over 14,175 ft, or nearly three miles of distance. The entirety of Mexico Beach Florida’s beachfront property is about three miles, but of all of the Michael’s damage photos, there is only one possibly Category 4 photo, so the Category 4 damage in Mexico Beach seems much more likely caused by an isolated gust, rather than a “one minute peak wind,” called for in the basic definition.
Clearly there is nothing like a 140-knot peak wind speed event, Category Five damage, evident anywhere in Mexico Beach from the dozens of photos available on-line.
So, again, why would you choose “flight level to surface adjustments,” <underlining added> when NOAA’s stated, “Gold Standard,” wind-effect- caused damage to trees, is plainly visible in the numerous Internet-available photos of destruction caused by Michael’s winds, and 140-knot damage is not visible despite the dozens of photos available?
My answer: NOAA’s authors were deceiving readers into believing that Michael was a “human-caused, CO2-fueled” storm of greater intensity than warranted by the data themselves.
My conclusion is that the authors are part of a large majority of Government, Academic, and Mainstream Media persons involved in “a quasi-religious movement predicated on an absurd ‘scientific’ narrative,” as so well-stated by 50-year atmospheric scientist and MIT Emeritus Professor Richard Lindzen.