
Especially if you live in New Mexico, you might think Climate Activists have lost the power of critical thought, and you’d be right; here are some reasons why.
Robert W. Endlich
Acknowledgements: In 2015 Michael Wallace pointed out to me that the Kort et al Methane map published in the 16 Sep 2014 GRL publication “Four corners: The largest US methane anomaly viewed from space,” did not match up with other Methane maps which correctly showed large Methane concentrations in east Texas’ swamps. Dave Tofsted helped with my 18 Jun 2016 presentation on Methane Madness, and this post.

The rise of Climate Activism came about in the late 20th century; there is a good discussion of the history of this topic by the Science and Public Policy Institute (SPPI).
From the very beginnings, the assertions by two of the IPCC’s first leaders, the late Bert Bolin of Sweden and John Houghton of the UK are, if studied carefully, the result of political activism dressed up as science. The second sentence of the SPPI paper says a lot, “The UNEP’s belief in man-made warming in the late 1970’s led to a stage-managed conference in Villach <Austria> in 1985, which in turn led to the political decision to form the IPCC.”
Reading this history, which I recommend, we see the notions that humans have a clear and demonstrable adverse impact on the climate of Earth are notions of political activism, without scientific foundation.
I use southern New Mexico as an exemplar because of my professional experience here, ten years operational forecasting at the High Energy Laser Systems Test Facility [HELSTF], White Sands Missile Range and living in southern New Mexico since 1984. With a little digging, it is possible to find splendid local examples which show that there is no “Climate Crisis,” no “Existential Threat” to human existence, and no significant Carbon-Dioxide-induced warming here, in the USA, and by extension globally.
This post uses a compare and contrast analysis tool to demonstrate the lack of scientific rigor in many Climate Alarmist positions.
A STORY OF TWO OBSERVING STATIONS
We have two meteorological observing locations in southern New Mexico which have century-long periods of record. The first is on the campus of New Mexico State University, in the southern part of Las Cruces. The second is at the Jornada Experimental Range, a long-term scientific research station located about 20 miles north of Las Cruces in the northernmost Chihuahuan Desert, not far from the Jornada del Muerto of Spanish Colonial days.
Data taken at the Jornada Range reveal temperatures have fallen almost 2F during the period 1916 to 2019, based on data downloaded from the Western Regional Climate Center. Rainfall there has increased from a little over 8 inches per year to a little over 10 inches annually over a similar hundred-year period. Both temperatures and rainfall totals show wide variability, a consequence of the considerable distance in southern New Mexico from any oceans.
At NMSU, rainfall has increased from 8 inches to a little over 9-1/2 inches over the 125-year period of record, while temperatures have risen there by about 4.5 F.
So, while both sites show gently increasing rainfall rates, Jornada Range shows distinct cooling, while NMSU shows a dramatic warming. Why?
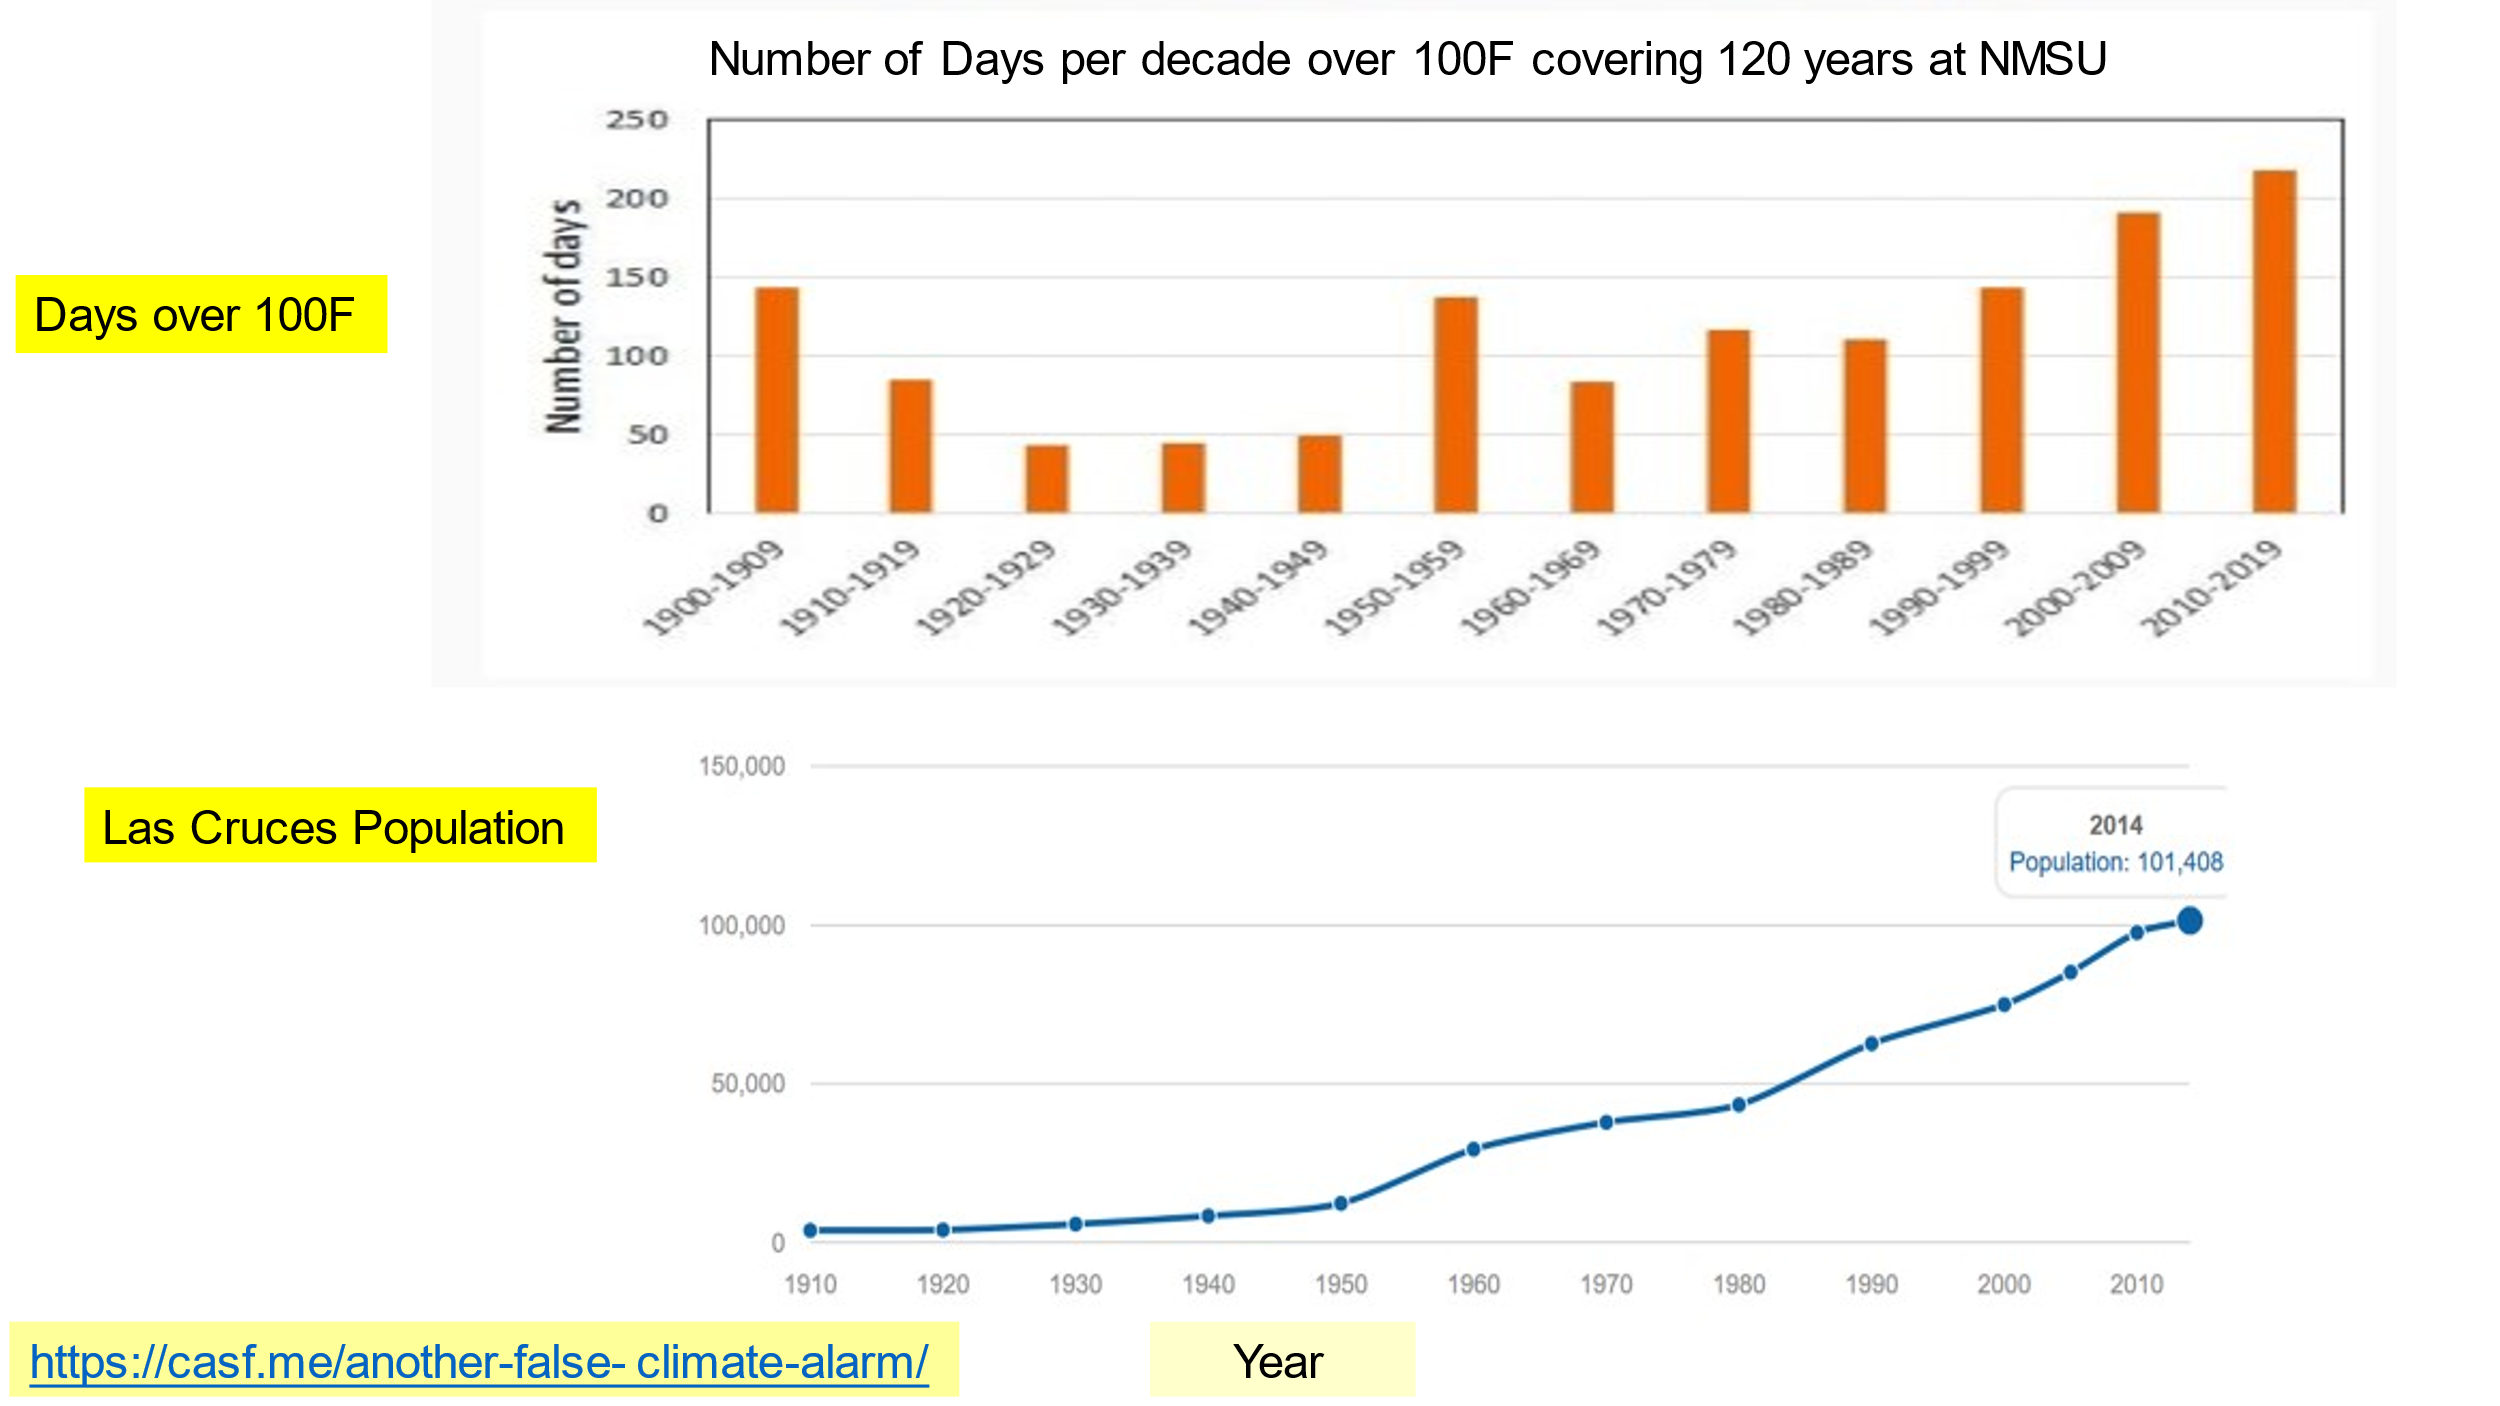
The warming at NMSU clearly reflects Las Cruces’ Urban Heat Island effect illustrated in Figures 1 and 2 below. NMSU’s rise in temperatures reflects the population gains of Las Cruces from Territorial days (New Mexico gained statehood in 1912) to the present.
DIRECT MEASUREMENTS QUANTIFY LAS CRUCES’ URBAN HEAT ISLAND
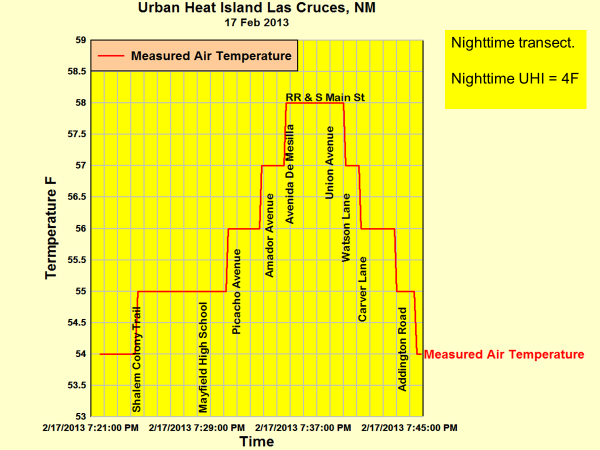
Our group made several transects of Las Cruces in 2013 and found a very repeatable Urban Heat Island. Our transects started well north of Las Cruces at the Lujan Hill Road intersection of NM 185/North Valley Drive, proceeded south to the intersection with South Main Street at the railroad grade crossing (warmest on the 4 F transect) and further south on NM 478/South Main Street to Mesquite, NM, a 20-mile base line. The NMSU meteorological instruments are only about ½ mile east of the transect baseline near the peak of the urban heat island, so NMSU’s instruments are very close to the warmest temperatures on the transects.
Figure 2 below clearly demonstrates the 4-degree Fahrenheit effect of the urban heat island on the NMSU temperature readings.
Based on our measurements, NMSU’s meteorological instrument field is only about 2800 ft east of the 20-mile long North-South transect.
NMSU’S INSTRUMENTS FAIL WORLD METEOROLOGICAL STANDARDS
On 19 October 2019 I presented a critique of an alarmist story in the Las Cruces Sun News. Part of the alarm was that the author used analyses from the NMSU meteorological instrument field by NM State Climatologist Dr David Dubois.
In addition to the NMSU temperature instruments being located close to the center of Las Cruces’ Urban Heat Island, the instruments are mounted over bare dirt which retains daytime solar heat more readily than vegetated surfaces which remain cooler due to evaporation.
The World Meteorological Organization standards (which are also NOAA’s standards) call for thermometers to be mounted over, “ground covered with natural and low vegetation (<10 cm) representative of the region,” and “…more than 100 m from heat sources or reflective surfaces (buildings, concrete surfaces, car parks, etc.)”
The presentation graphics slides 29 and 30 show that NMSU’s thermometers fail both of these standards. In addition to the problem with the bare dirt surface, there is close by an infrastructure support building within the chain link fence surrounding the instruments, a nearby sizeable concrete pad, and a gravel drive / car park adjacent to the instruments.
MANY THERMOMETERS FAIL NATIONAL AND INTERNATIONAL STANDARDS FOR EXPOSURE
NMSU is not alone in using instruments which fail the World Meteorological Organization (WMO) standards for exposure.
In 2009 Anthony Watts published Is the US Surface Temperature Record Reliable? a report which is available on-line at http://surfacestations.org/, or hard copy available from the Heartland Institute.
The answer to the question posed by the title of Watts’ report is a resounding NO!
Watts’ report, based on eye-witness observations of hundreds of stations, found only 11% of the stations visited met exposure standards; 20% of stations were over 1 C in error, 58% of stations were over 2 C in error, and 11% were over 5 C in error.
Both the US Office of Inspector General (USOIG) and the Government Accountability Office (GAO) sent reports to NOAA criticizing the positioning of instruments and the data derived from them. In response to Watts’ damning report and the USOIG and GAO reports, the then Obama Administration issued a flurry of hastily prepared releases and rolled out a revised “US Climate Reference Network” to “fix” the problem.
The follow-on report on the 2022 status of US Surface Temperatures was published by the Heartland Institute on 27 August 2022, CORRUPTED CLIMATE STATIONS, The Official U.S. Temperature Record Remains Fatally Flawed. This new report could have the sub-title, “It’s worse than we thought!” because it found that some 96% of the US Surface Thermometers now fail NOAA’s own standards and only 4% meet the US and International standards.
Were there efforts by NOAA to “fix” the biases in the US temperature data? None seem apparent. So much for Inspector General and GAO recommendations to NOAA.
The focus, then, might have been to rely more on the US Climate Reference Network, since it seems to have achieved most or perhaps all of the technical goodness goals which led to the comment that it would be an “unimpeachable” source of climate data for decades, and by some estimates, at least fifty years.
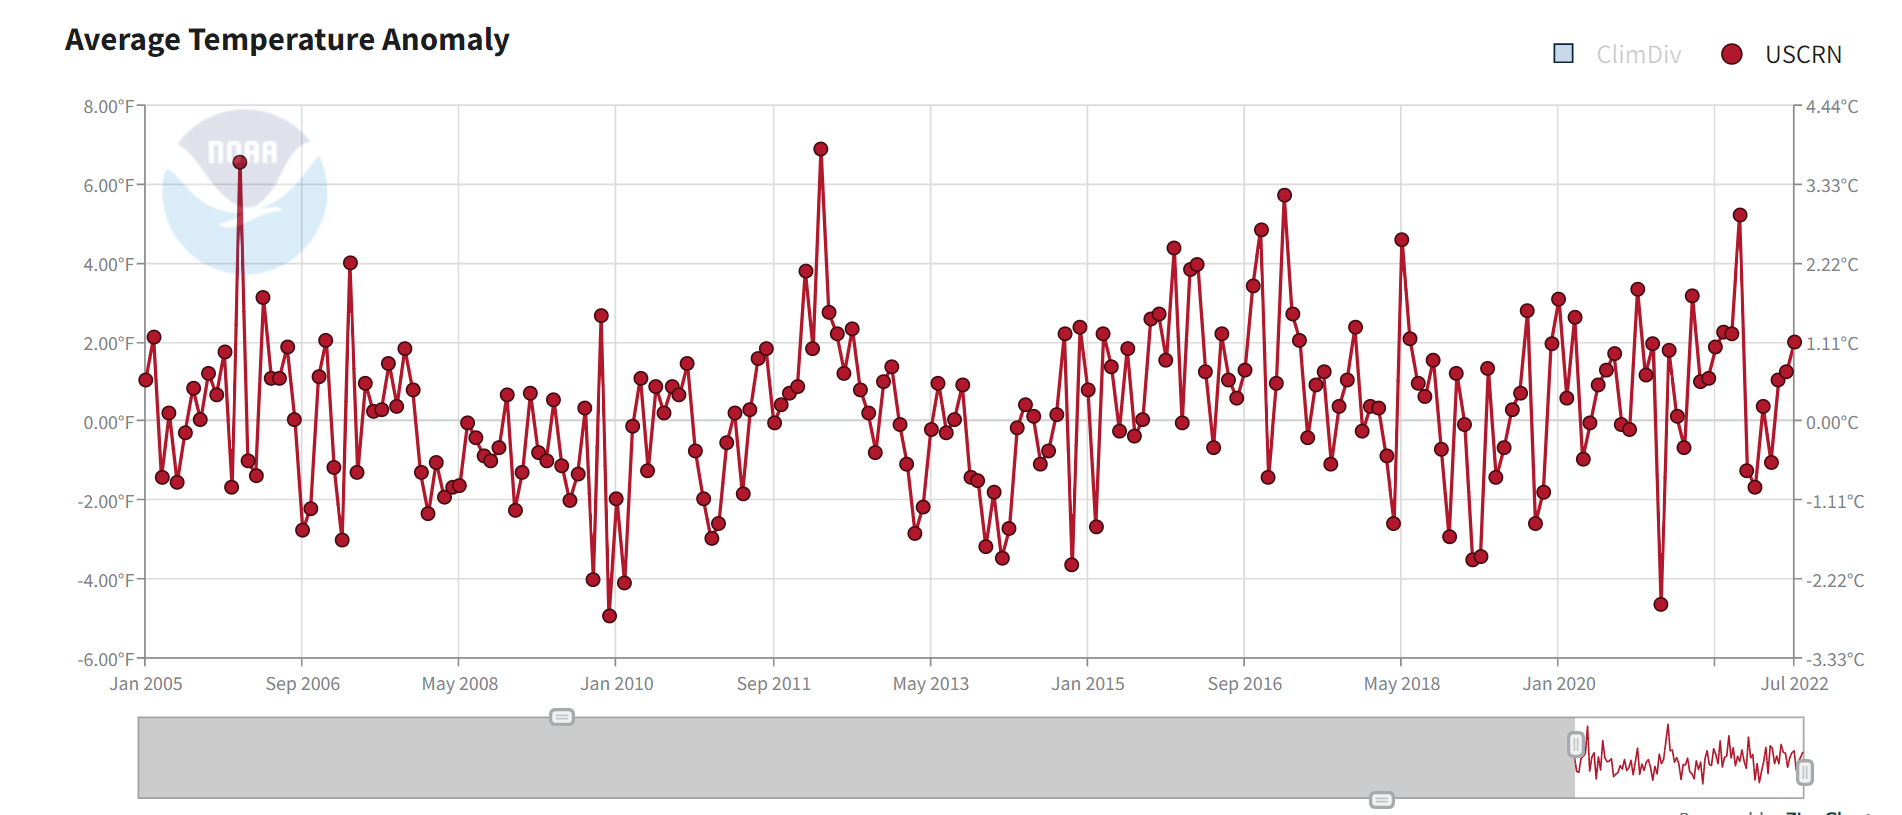
Alas, this has not been the case. Yes, the USCRN is doing its job, but stories about the data from USCRN seem not to be published for easy access by the public, instead the stories NOAA wants to push seem to be one of hotter and hotter temperatures seemingly leading toward climate catastrophe. These stories use the 96% of thermometers which fail NOAA’s own standards.
What do the data from USCRN look like? There are data since Jan 2005, or a little more than seventeen years of data. In that time US surface temperatures have changed little, as we see below.
METHANE MADNESS IN NEW MEXICO
In September 2014 New Mexico was seemingly rocked by publication in AGU’s Geophysical Research Letters the story, “Four corners: The largest US methane anomaly viewed from space,” by Kort et al.
Here at CASF, Dave Tofsted and I tried without success to reproduce the AGU results based on the Letter itself along with the Supplementary Information provided. I spoke of this effort on 18 Jun 2016, which included emails to the lead author Eric Kort of the University of Michigan, but we received no replies.
Subsequent to the Kort report, THERE WERE methane leaks found at natural gas production facilities. A 2016 story in the Santa Fe New Mexican reported that after scientists found Methane leaks, the producers promptly repaired the leaks. Similarly, a 2016 story from Michigan News from the University of Michigan had this sentence:
“A research team was able to identify this leak from the air, verify it on the ground, and it was immediately fixed.”
It seems as if Kort et. al, got their AGU paper’s results by taking satellite data and attempting a form of deconvolution algorithm designed to accentuate fluctuations. This algorithm appears to have artificially added back a hypothetical load of methane in the Four Corners region which might have extended from the observation height down to sea level. Farmington’s Airport is 5506 Ft MSL, and to the east, Aztec NM’s Airport is 5877 Ft MSL, so adding in this hypothetical load resulted in significant increases; increases which are not observed in the Envisat satellite data, discussed below.
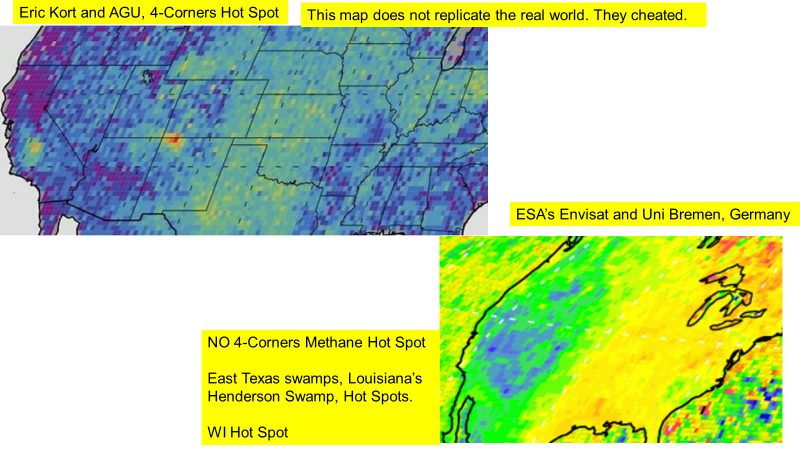
The graphic below, Figure 4, is the Kort et al. Methane reconstruction.
In contrast to the Kort results, from 2002 to 2012 the European Space Agency’s “Envisat” satellite collected atmospheric trace gases via its Scanning Imaging Absorption Spectrometer for Atmospheric Cartography (SCIAMACHY) imaging spectrometer which measured global amounts of trace gases in the Earth’s troposphere and stratosphere. Data analyzed by a team of scientists at the University of Bremen reveal a starkly different picture (from Kort, et al) of Earth’s Methane concentrations, displayed in the examples below.
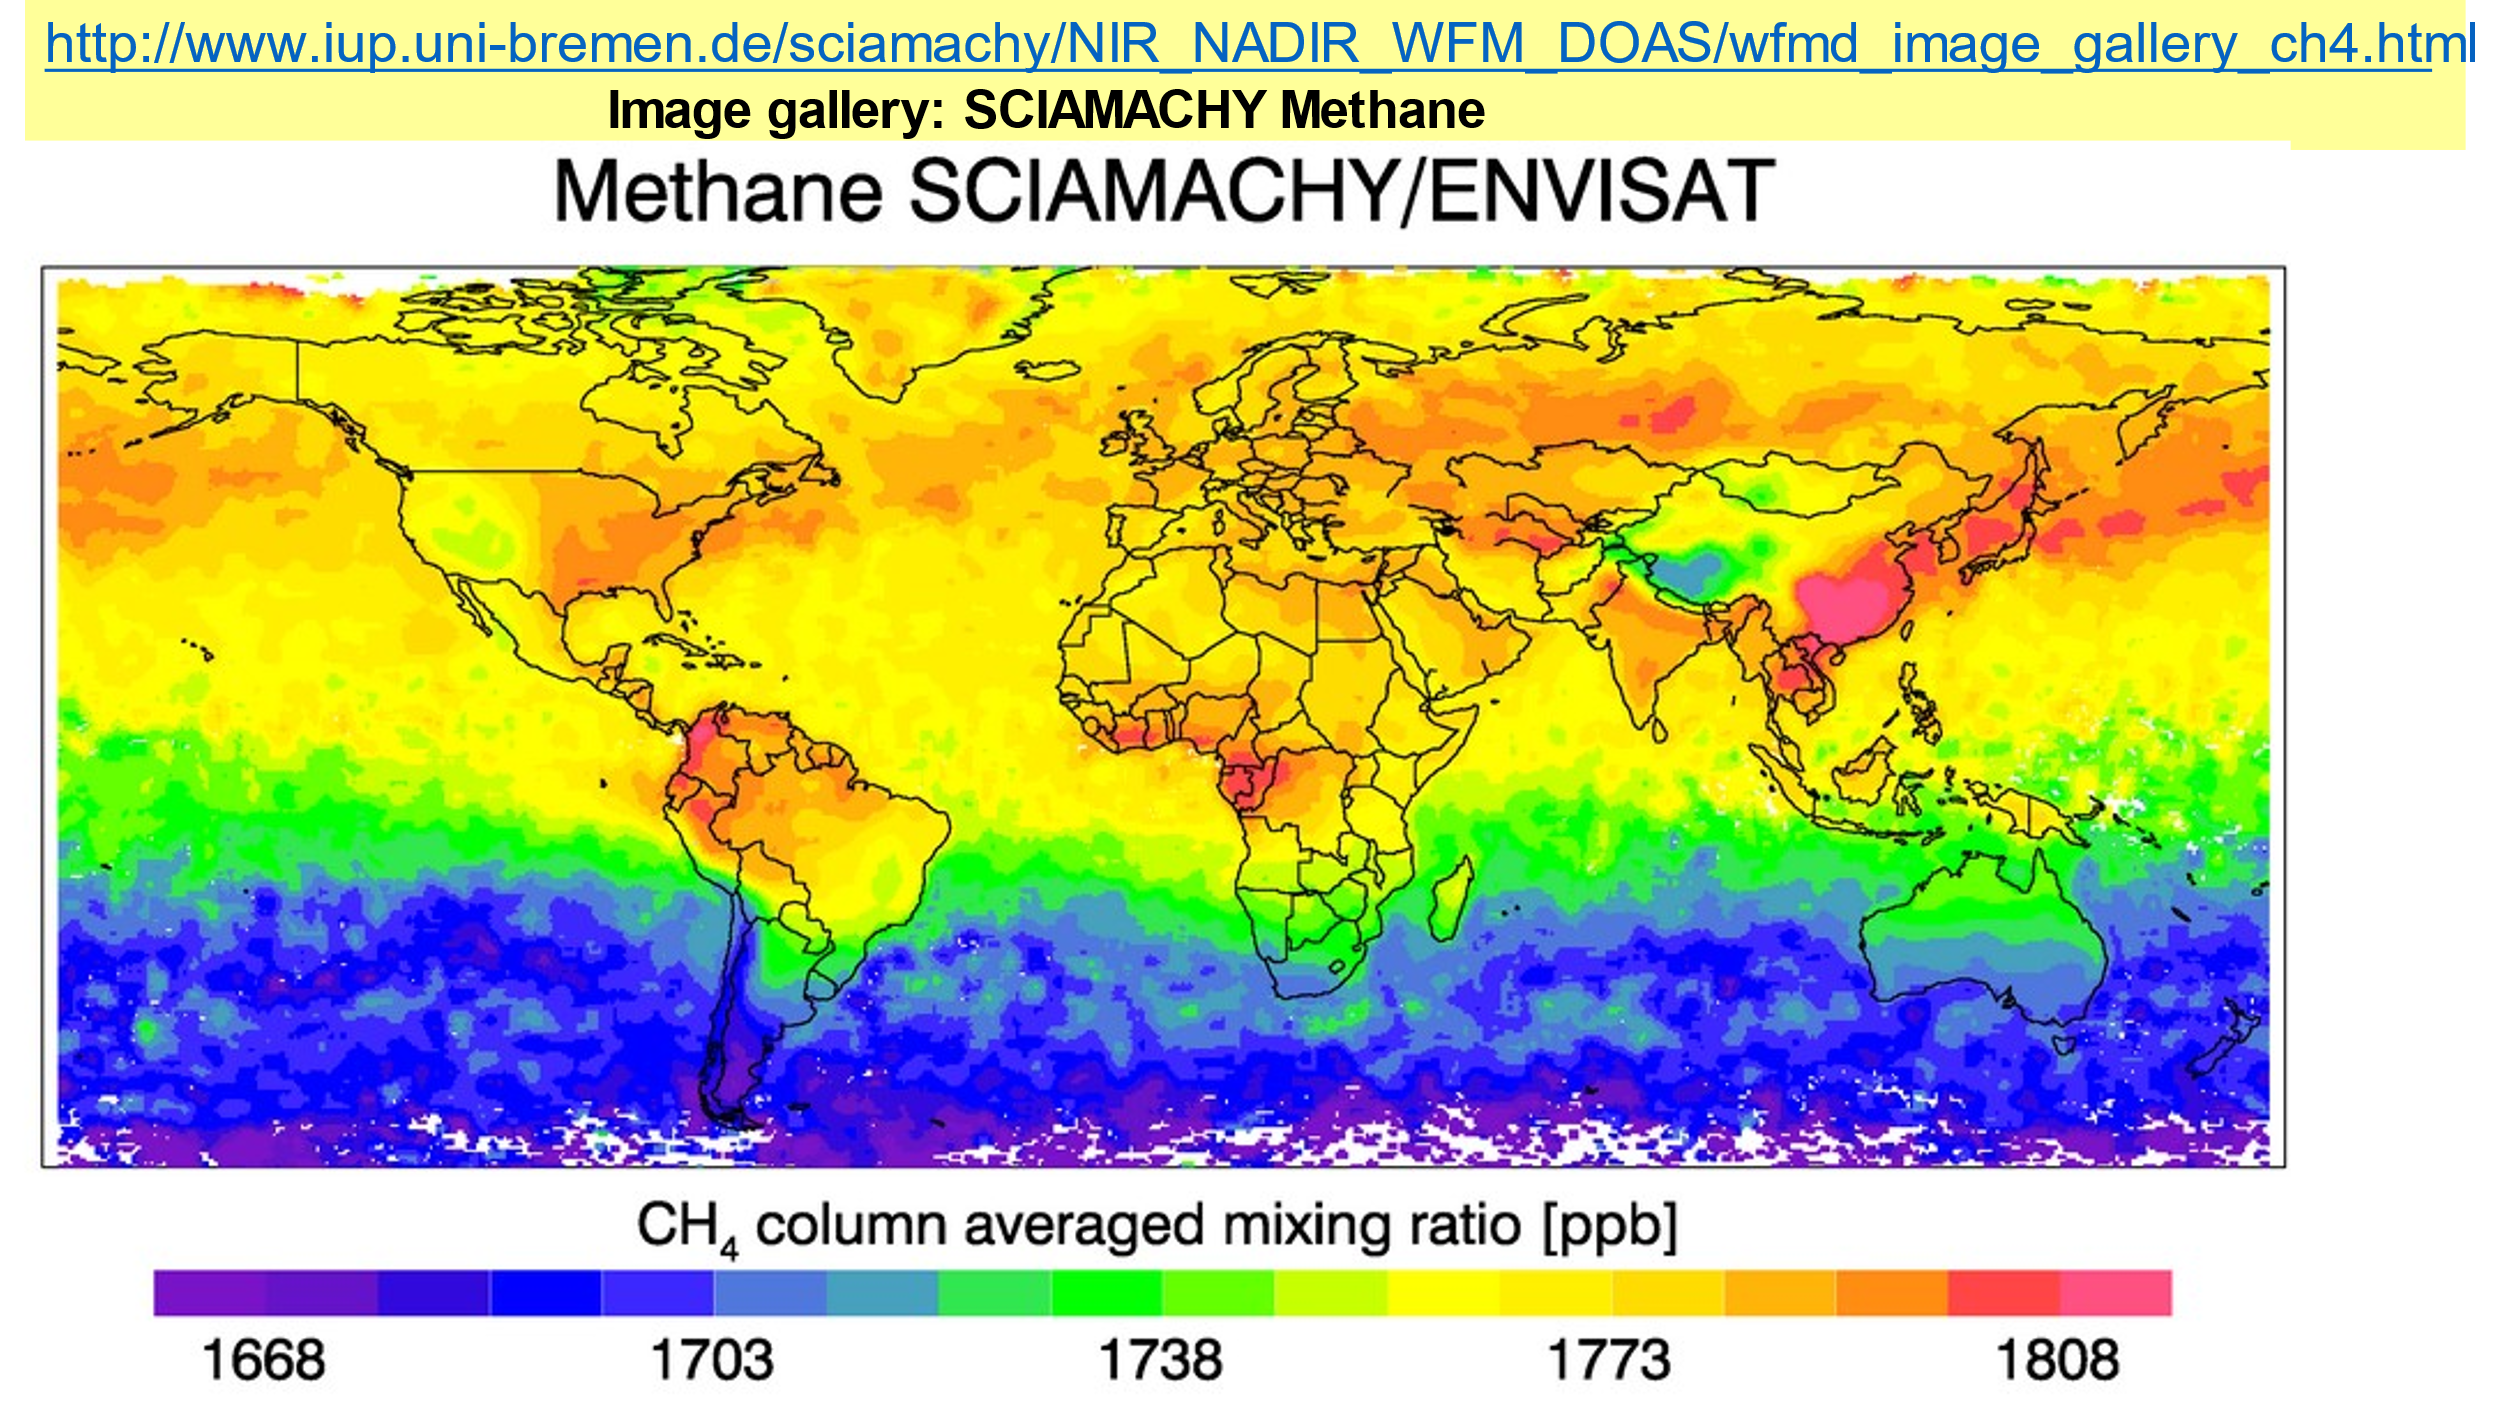
Notably missing from the Envisat/University of Bremen graph is any hint of a methane enhancement over New Mexico.
There is and was no enhancement caused by leaking methane observed by Envisat in the 4 Corners region of New Mexico, Colorado, Utah, and Arizona.
Instead, huge methane concentrations are observed from East Texas to Georgia. Automobile travelers following US Interstate Highway 10 (I-10) from Santa Monica CA to Jacksonville FL will note the significant increase in the numbers of swamps while traveling from East Texas through Louisiana, notably the swamps of Louisiana, especially under the Atchafalaya Basin Bridge east of Lafayette, a 20-mile-long bridge over the Henderson Swamp. All swamps are huge producers of methane.
The present Governor of New Mexico, Michelle Lujan-Grisham, made a campaign promise to drastically reduce methane emissions in the state, essentially using the excuse of Methane emissions as a cudgel to attack the oil and gas industry of the state. In a 28 Jul 2022 Press Release she boasted that her new Methane rules are,
“…enabling New Mexico to lead the nation and serve as a model in smart regulation.”
While this notion of action by New Mexico may appear laudable, it is in actuality Quixotically dollar- and-effort-expensive and will yield no measurable impact on Methane concentrations globally.
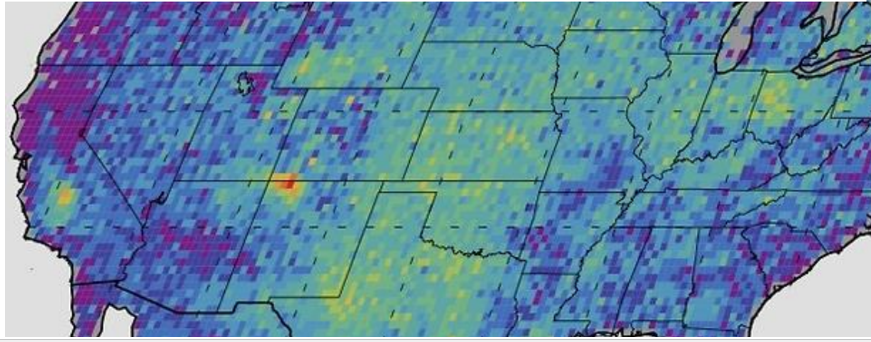
As seen in Fig. 5, concentrations of methane in the US are dominated by sources in the Ohio and Mississippi River basins, while globally Russia’s Ob River Basin, the north Atlantic and Pacific, China, northern South America, and Equatorial Africa are clearly the dominant sources. The comparison for the US is further emphasized in Figure 6.
A BRIEF QUANTITATIVE ANALYSIS
Near the end of the presentation, I use an approximate 2003 global mean concentration of Methane, 1850 parts per billion, PPB, and the Kort et al enhancement of Methane of 14 PPB, so the enhancement as a ratio is 14/1850, less than 1%, about 0.76%.
The time series from Montana del Oro California from the old Carbon Dioxide Information and Analysis Center at Oak Ridge National Laboratory showed an annual wave of Methane concentrations on the order of 50 parts per billion, or the mean +/- 25 parts per billion. From the University of Bremen, there was no increase in <Methane> over the Four Corners during the ENVISAT years; therefore, there was no fracking signature visible from Envisat’s sensors.
From 2003 to 2016 Methane’s global mean increased from about 1740 to 1834 PPB, about 5%. It is easily possible that this increase in methane is completely attributable to increased agricultural production associated with a yearly increase in Earth’s human population of 2%.
The International Panel on Climate Change has modeled huge increases in Methane but measured concentrations of Methane actually decreased for a few years, clear indications that basic understanding of the behavior of this gas in the atmosphere was lacking.
All of this effort and energy over a less than 1% increase in Methane during a time when the global mean increased by 5% seems to me to be a terrible waste of money, effort, and a serious lack of critical thinking.
It seems to me that instead of guiding New Mexico’s spending priorities to tilt at windmills, that is, to place emphasis on reducing the tiny amounts of New Mexico’s methane emissions in a global sense to near zero which will have zero impact on the global emissions of methane from the swamps, river basins and oceans we can see from the University of Bremen’s global Methane maps.
Instead, consider this: New Mexico’s students rank last in the nation in educational achievement, and we’ve been at the bottom for decades. Maybe most of that money might be better spent making sure our students can read by third grade, rather than continuing the practice of social promotion.
On Methane, this thought is hammered home by a 27 Jun 2022 post, Why There’s No Need to Panic about Methane in the Atmosphere where research by Happer and van Wijngaarden shows that even a doubling of the present Methane concentration would have only a “trivial” effect on climate.
CONCLUDING REMARKS
Critical thinking might lead investigators to an understanding of the urban heat islands’ effects on the often-hysterical reporting that accompanies stories of “hottest year ever” we frequently see in the media.
“Critical Thinking” mainly involves the process of abduction – the Matching of a series of facts to a series of possible explanations and considering which explanation provides the Best Match to the available data. This is often described as ‘Inference to the Best Explanation.’
In this case, we have two sets of data – one (Kort et al.) obtained by dubious backtracking algorithms that appear to find two hot spots, one in New Mexico, and one in California’s central valley, the other (Envisat-based) identifies generalized regions of methane production due to agricultural and swampland/rainforest/ocean production regions and it seems accurate.
Likewise, we have two groups of analysts: One politically motivated to find reasons to inflict damage on oil and gas production in New Mexico. The other, following the data where it leads, to obvious sources of methane planet-wide seems non-political.
Perhaps it is asking too much for individuals to think beyond their prejudices, but objective analysis is the goal of Critical Thinking.