
Robert W. Endlich
A few months ago, I picked up the June 2021 issue of the AARP BULLETIN. What greeted me was inch-high letters blaring the title of their feature article: “CLIMATE CHANGE AND YOU; Extreme Weather Is Affecting Older Americans’ Daily Life…”
On the front cover, four huge images, vivid color photos: white-shirted man on rooftop looking into a wildfire in southern California, flood victims of Hurricane Florence in an overloaded boat in South Carolina, woman in jeans and white shirt in Mississippi assessing damage after Hurricane Katrina, and a view of slushy streets in Texas, February 2021.
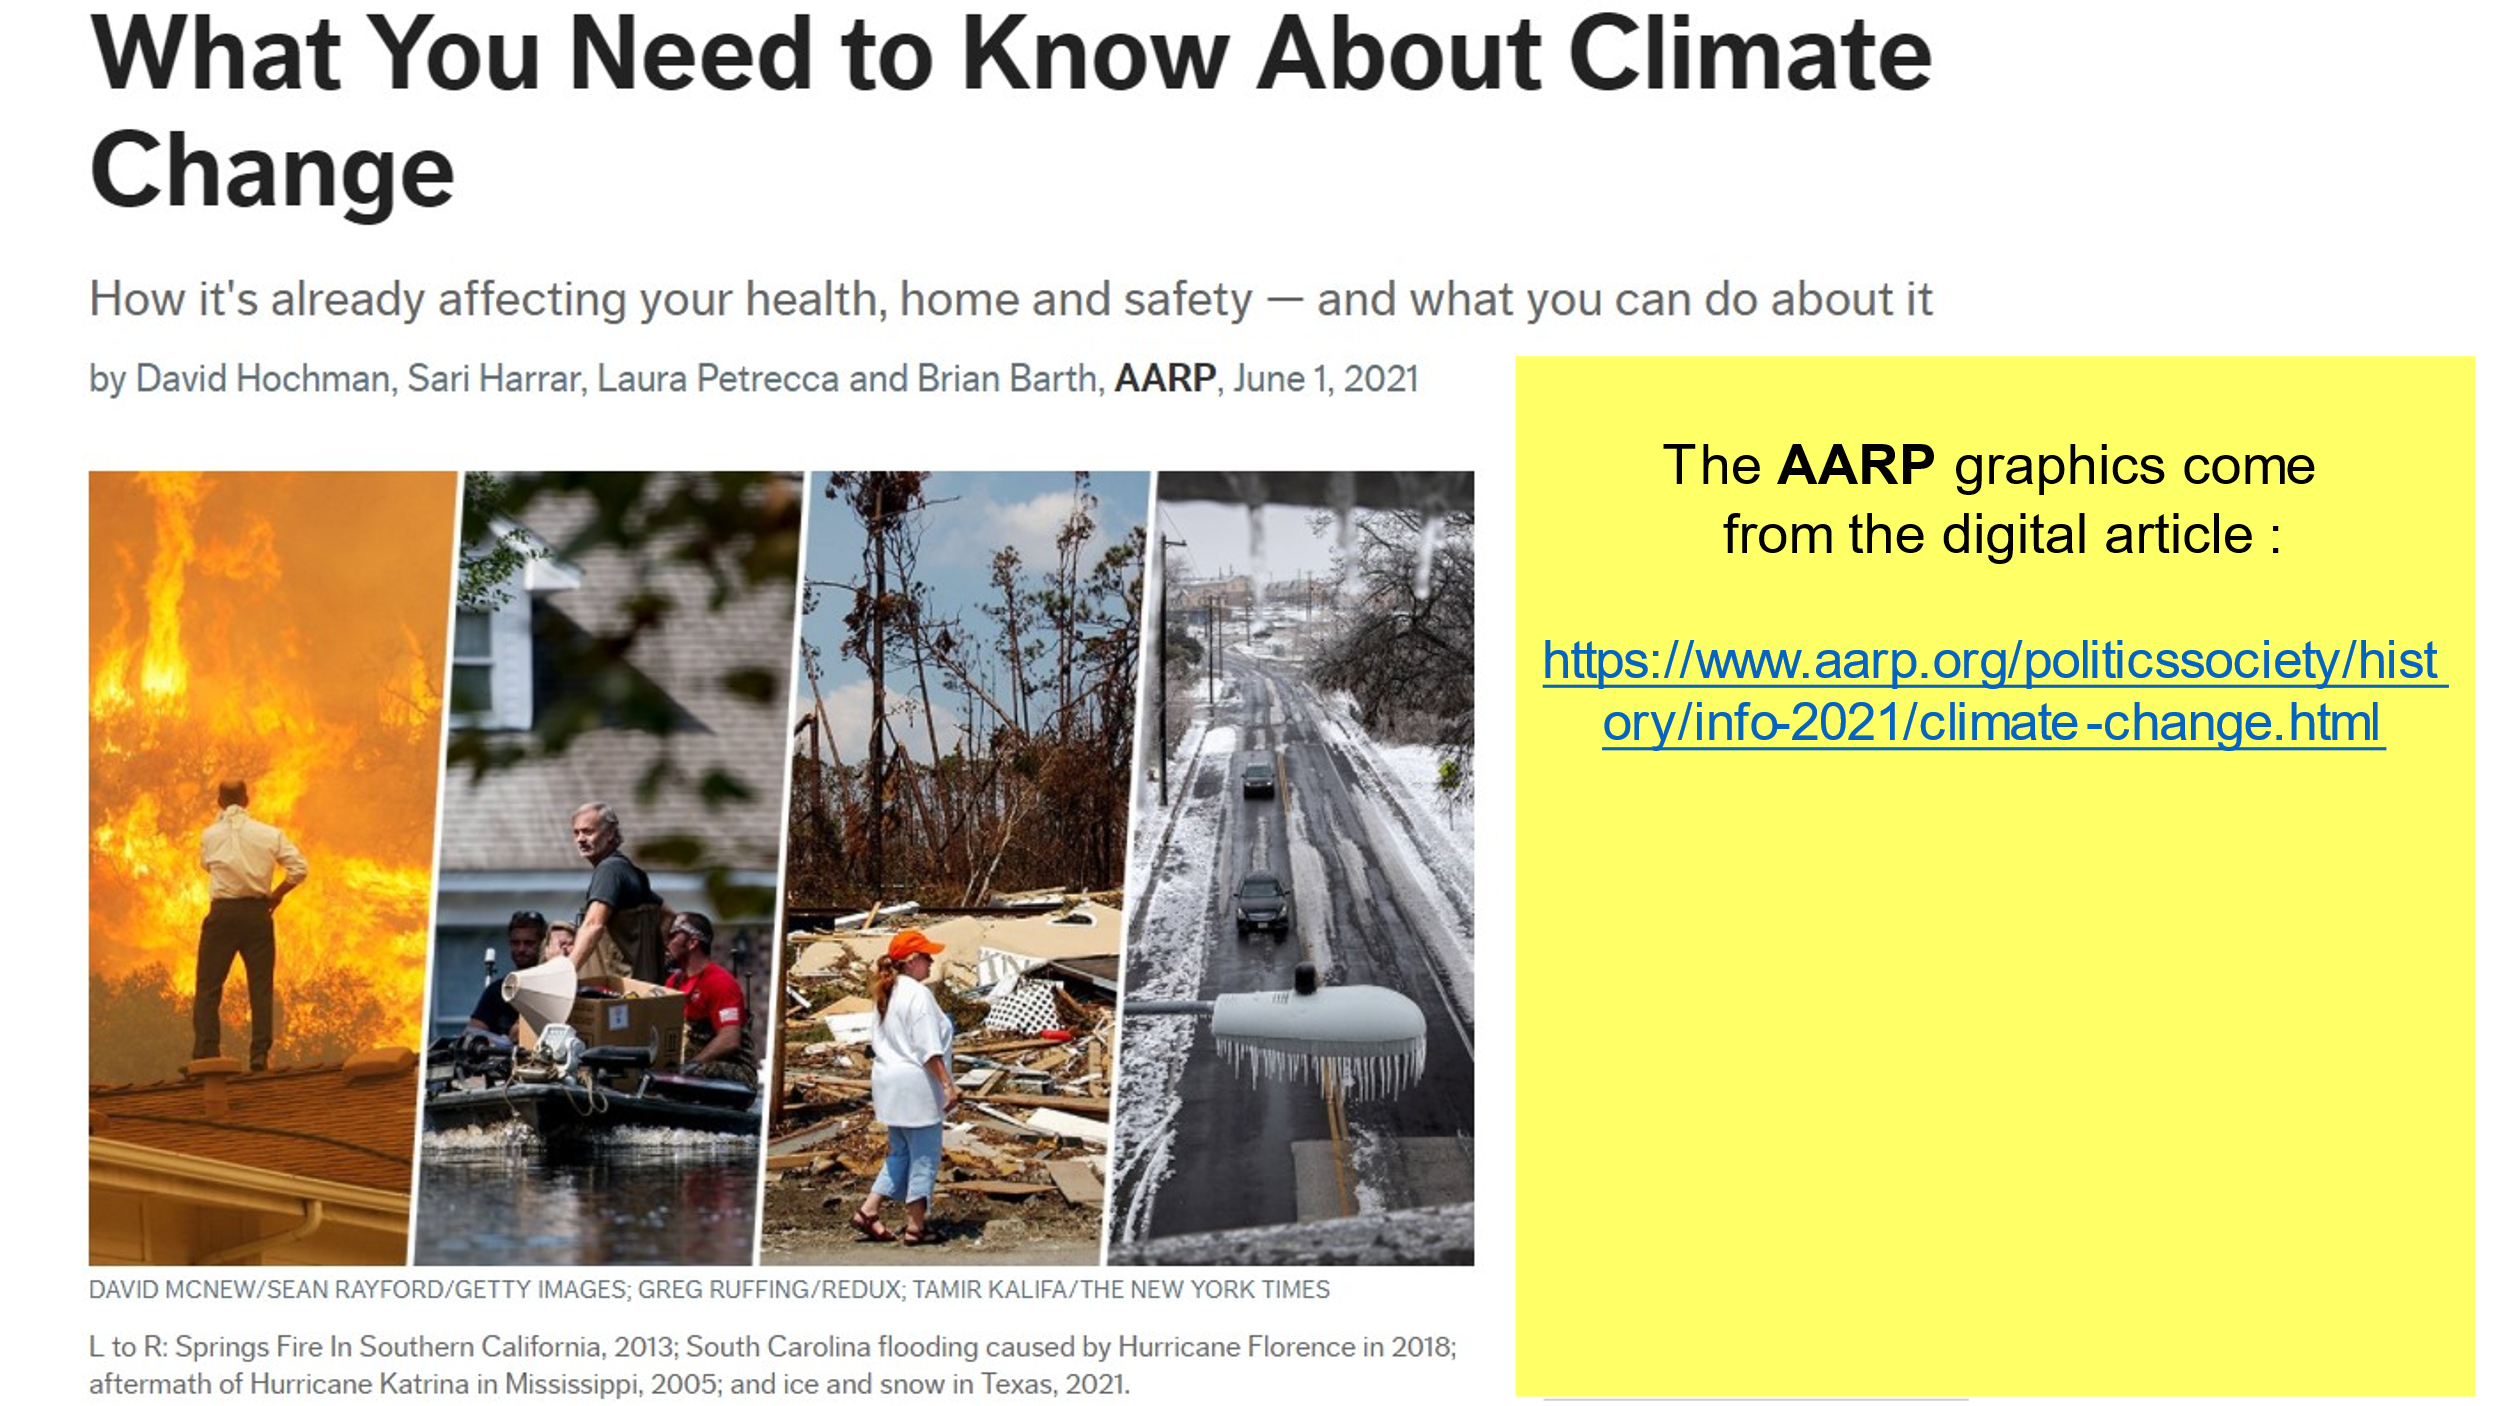
The photos are dramatic, of course, classic emotional appeals by the media. But I thought,
“Is AARP subliminally trying to tell us that wildfires are new news in southern California? That floods and hurricane damage are rare in South Carolina and Mississippi? That freezing rain, snow, and slush don’t happen much in Texas?”
FALSE NEWS THAT NEEDS ITS OWN PRIZE
Spoiler Alert! I found that AARP’s writers came up with more False News in such a few pages that perhaps they need to be nominated for a new False News Prize. It surely isn’t journalism, where facts are presented and analyzed.
In reading this article, I found instances where our own Federal Government is lying to us, or at least attempting to hide the truth from us. Members of prominent government organizations, yes, members of the Deep State, are deliberately obfuscating data, truth which is (or used to be) available in climate records. We, who pay their salaries with our tax dollars, are being lied to; I include specific examples below.
Much more detail is available from my presentation graphics on the CASF website under Special Pages>CASF Monthly Meeting Presentations, December 2021.
AARP starts with three main paragraphs which mimic the climate alarm cookbook, and I use each in the beginning sections of this post. Later, in some of AARP’s quotes are false climate claims; I highlight each with its own section.
THE TEXAS FREEZE OF FEBRUARY 2021
The quote below comes from AARP:
“Remember the Great Texas Freeze this past February? Never-before-seen ice storms crashed trees onto power lines and froze the wind turbines Texans turn (sic) depend on for heat and light.”
This immediately reminded me that while I was a second lieutenant in Air Force Basic Meteorology studies at Texas A&M’s campus at College Station, Texas, in January 1964, when we had a freezing rain event. So, I knew immediately the notion that freezing rain events in Texas were, “never before seen,” was complete BS.
Eleven years ago, in 2011, there was a similar cold weather storm which brought similar significant winter weather to New Mexico, West Texas and Arizona; that one brought so much Arctic air to the region that El Paso Electric had to cut electricity to New Mexico State University, White Sands Missile Range, and Ft Bliss, TX. There were rolling blackouts in the city. Electricity to pump natural gas to El Paso Natural Gas customers in southern Arizona and others was cut; thousands of homes with gas furnaces were without heat. Oklahoma set a new extreme cold temperature record, -31 F, on 10 Feb 2011. Albuquerque Public Schools was closed the first whole school week of February 2011, for the cold weather and snow. It got so cold there that the diesel fuel for the school busses turned to jelly; the fuel pumps could not pump the diesel fuel into the engines.
Weather records show that snow, freezing rain and extremely cold temperatures are a once-a-decade, and even fewer years, feature of the climate of Texas and other areas not far from the center of continental North America.
AARP says that the cold weather event of February 2021 in Texas brought,
“snowfalls not seen since the Truman administration,”
but there is an article about the San Antonio snowstorm of 1985, which said it was
“the worst snowstorm San Antonio had seen in 100 years,”
a clear indication that the period of return of snow events of 100 years or more is a feature of the climate and weather events seen in this part of the country, not an indication of climate change.
Washington Post’s article from 24 Dec 1989, “Texas Citrus Growers Fear Crop is Destroyed,” notes that a December 1989 freeze in the Lower Rio Grande valley destroyed the crop of citrus, source of Texas’ pink grapefruit, just as that region was recovering from a December 1983 freeze.
So, the assertion that the Feb 2021 freeze in Texas was some sort of never-before-seen event, an indication of a changing climate, is pure bunk. These winter weather events happen; the freezing rain I witnessed in 1964 was only one of many cold weather events which happens when the jet stream pattern changes to bring Arctic air to the nation’s midsection and, yes, Texas.
THE 2020 FIRE SEASON IN CALIFORNIA
Here are some quotes from the AARP article describing the 2020 fire season in California:
“Now, let’s recall the California fires of 2020, with nearly 10,000 blazes that consumed more than 4.2 million acres of forest…”,
“Last year’s fire season was the worst in California history.”
And
“extreme weather played a role: Lightning and a record-breaking heat wave, combined with Diablo and Santa Ana winds, sparked wildfires…”
I do not dispute that summer and fall of 2020 were times of great fires and fire damage in California. What I do dispute is that this happened as a result of changes in climate. I especially dispute that severity of the 2020 fire season occurred because of human-caused, CO2-fueled, global warming.
AARP says that the 2020 fire season at
“more that 4.2 million acres of forest”
burned was,
“the worst in California history.”
A look at the literature provides a different perspective, data which show that AARP’s claims are wrong. Stephens, et al in Forest Ecology and Management, find that before 1800, some 4.4 million acres of forest and shrubland burned annually. Stephens:
“before the Gold Rush, roughly 4.5 million acres a year in California burned.”
A ProPublica piece which decries the huge fuel loads in California estimates that peak burns in the past were up to 11.8 million acres per year!
So, it is clear that AARP’s claim that 2020’s,
“fire season was the worst in California history”
is hyperbole. It is not true if you look in the literature.
Now, about AARP’s,
“extreme weather played a role: Lightning and a record-breaking heat wave, combined with Diablo and Santa Ana winds, sparked wildfires…”
The conditions for severe fires especially in California, are hot, dry conditions, lots of fuel for the fires, lots of oxygen for the fires, and an ignition source to get the blaze going. No ignition source, no fire.
But that ProPublica piece says,
“We live in a Mediterranean climate that’s designed to burn, and we’ve prevented it from burning anywhere close to enough for well over a hundred years… and the fire we’ve been forestalling is going to happen, fast, whether we plan for it or not.”
HUMAN FACTORS ARE MAKING CALIFORNIA FIRE SEASONS WORSE
Over a hundred years of over-zealous firefighting, what we later called “Smoky Bear” policies, allowed the fuel load to grow to unworkably high amounts. These human activities brought the title of that ProPublica piece, “They Know How to Prevent Megafires. Why Won’t Anybody Listen?”
But Wikipedia and ProPublica never blurt out the presence of the proverbial 800-pound gorilla in the room, the Spotted Owl Decision, the 1991 Court Order which halted logging on National Forests in northern California, Oregon, and Washington on the grounds those forests were prime Northern Spotted Owl habitats. As a result, over 80% of the timber harvest was stopped, thousands of loggers were put out of work, businesses in logging towns were ruined, and this sparked (maybe an inappropriate word)
“growth-without-harvest”
of even more trees in California; fuel loads grew even faster and bigger.
An early 2020 article in the San Diego Union Tribune provides important information on the subject. Under normal conditions,
“Outside the Sierra Nevada and the state’s northernmost tier, there is little lightning, nature’s ignition source.”
And
“It doesn’t matter how dry the vegetation, how fierce the winds or how high the temperature; if there is no ignition, there is no wildfire.”
Several more elements add to this story:
The human cause factor, or as the title of that early 2020 San Diego Union Tribune article says,
“Human-caused ignitions spark California’s worst wildfires but get little state focus.”
It’s true. Writer Bettina Boxall says,
“Of the known causes of the state’s 20 most destructive wildfires, all are human-related.”
The four most important elements causing wildfires in California are: equipment (which generates sparks, such as mowers, grinders, and chainsaws), overhead electrical power lines, lightning, and arson.
AARP blames climate change for the 2020 wildfire season in California and mentions lighting.
When I put <lightning strike history in California> into a search engine, the Wikipedia return said that the US had 22% below the average number of strikes, that California had 51% below average lightning strikes, and mentioned a
“deadly surge”
(of lightning) in August 2020. That deadly surge was caused by a very unusual weather event,
“a siege of dry lightning from rare, massive summer thunderstorms, which were caused by an unusual combination of very hot, dry air at the surface, dry fuels, and advection of moisture from the remains of Tropical Storm Fausto northward into the Bay Area.”
So, this
“siege of dry lightning”
was a very rare weather event. AARP’s notion this is caused by changing climate is untrue. It is the journalistic ambulance-chasing that is typical of much of the Mainstream Media today. Despicable and wrong.
There is more, on this, below, where I discuss that
“siege of dry lightning”
in the section on Diablo and Santa Ana winds.
WHAT “RECORD-BREAKING HEAT WAVE?”
NOAA provides an easy way to determine, from the recorded data, time series of a number of meteorological elements, from a National, Regional, Statewide, State Divisions, Counties or City basis, from the Climate at a Glance web site.
So, to check the veracity of the AARP authors’ claim, I plotted the temperatures for the entire period of record for California from the NOAA data base, copied it and pasted it in Figure 2 below. From that plot, see that the start year for the temperature data was in 1895 and the last month of the time series was November 2021. There is a plot of the temperature, one data point every year.
The year 2020 was not a year with a
“record breaking heat wave”
in California, according to NOAA’s data from the plot.
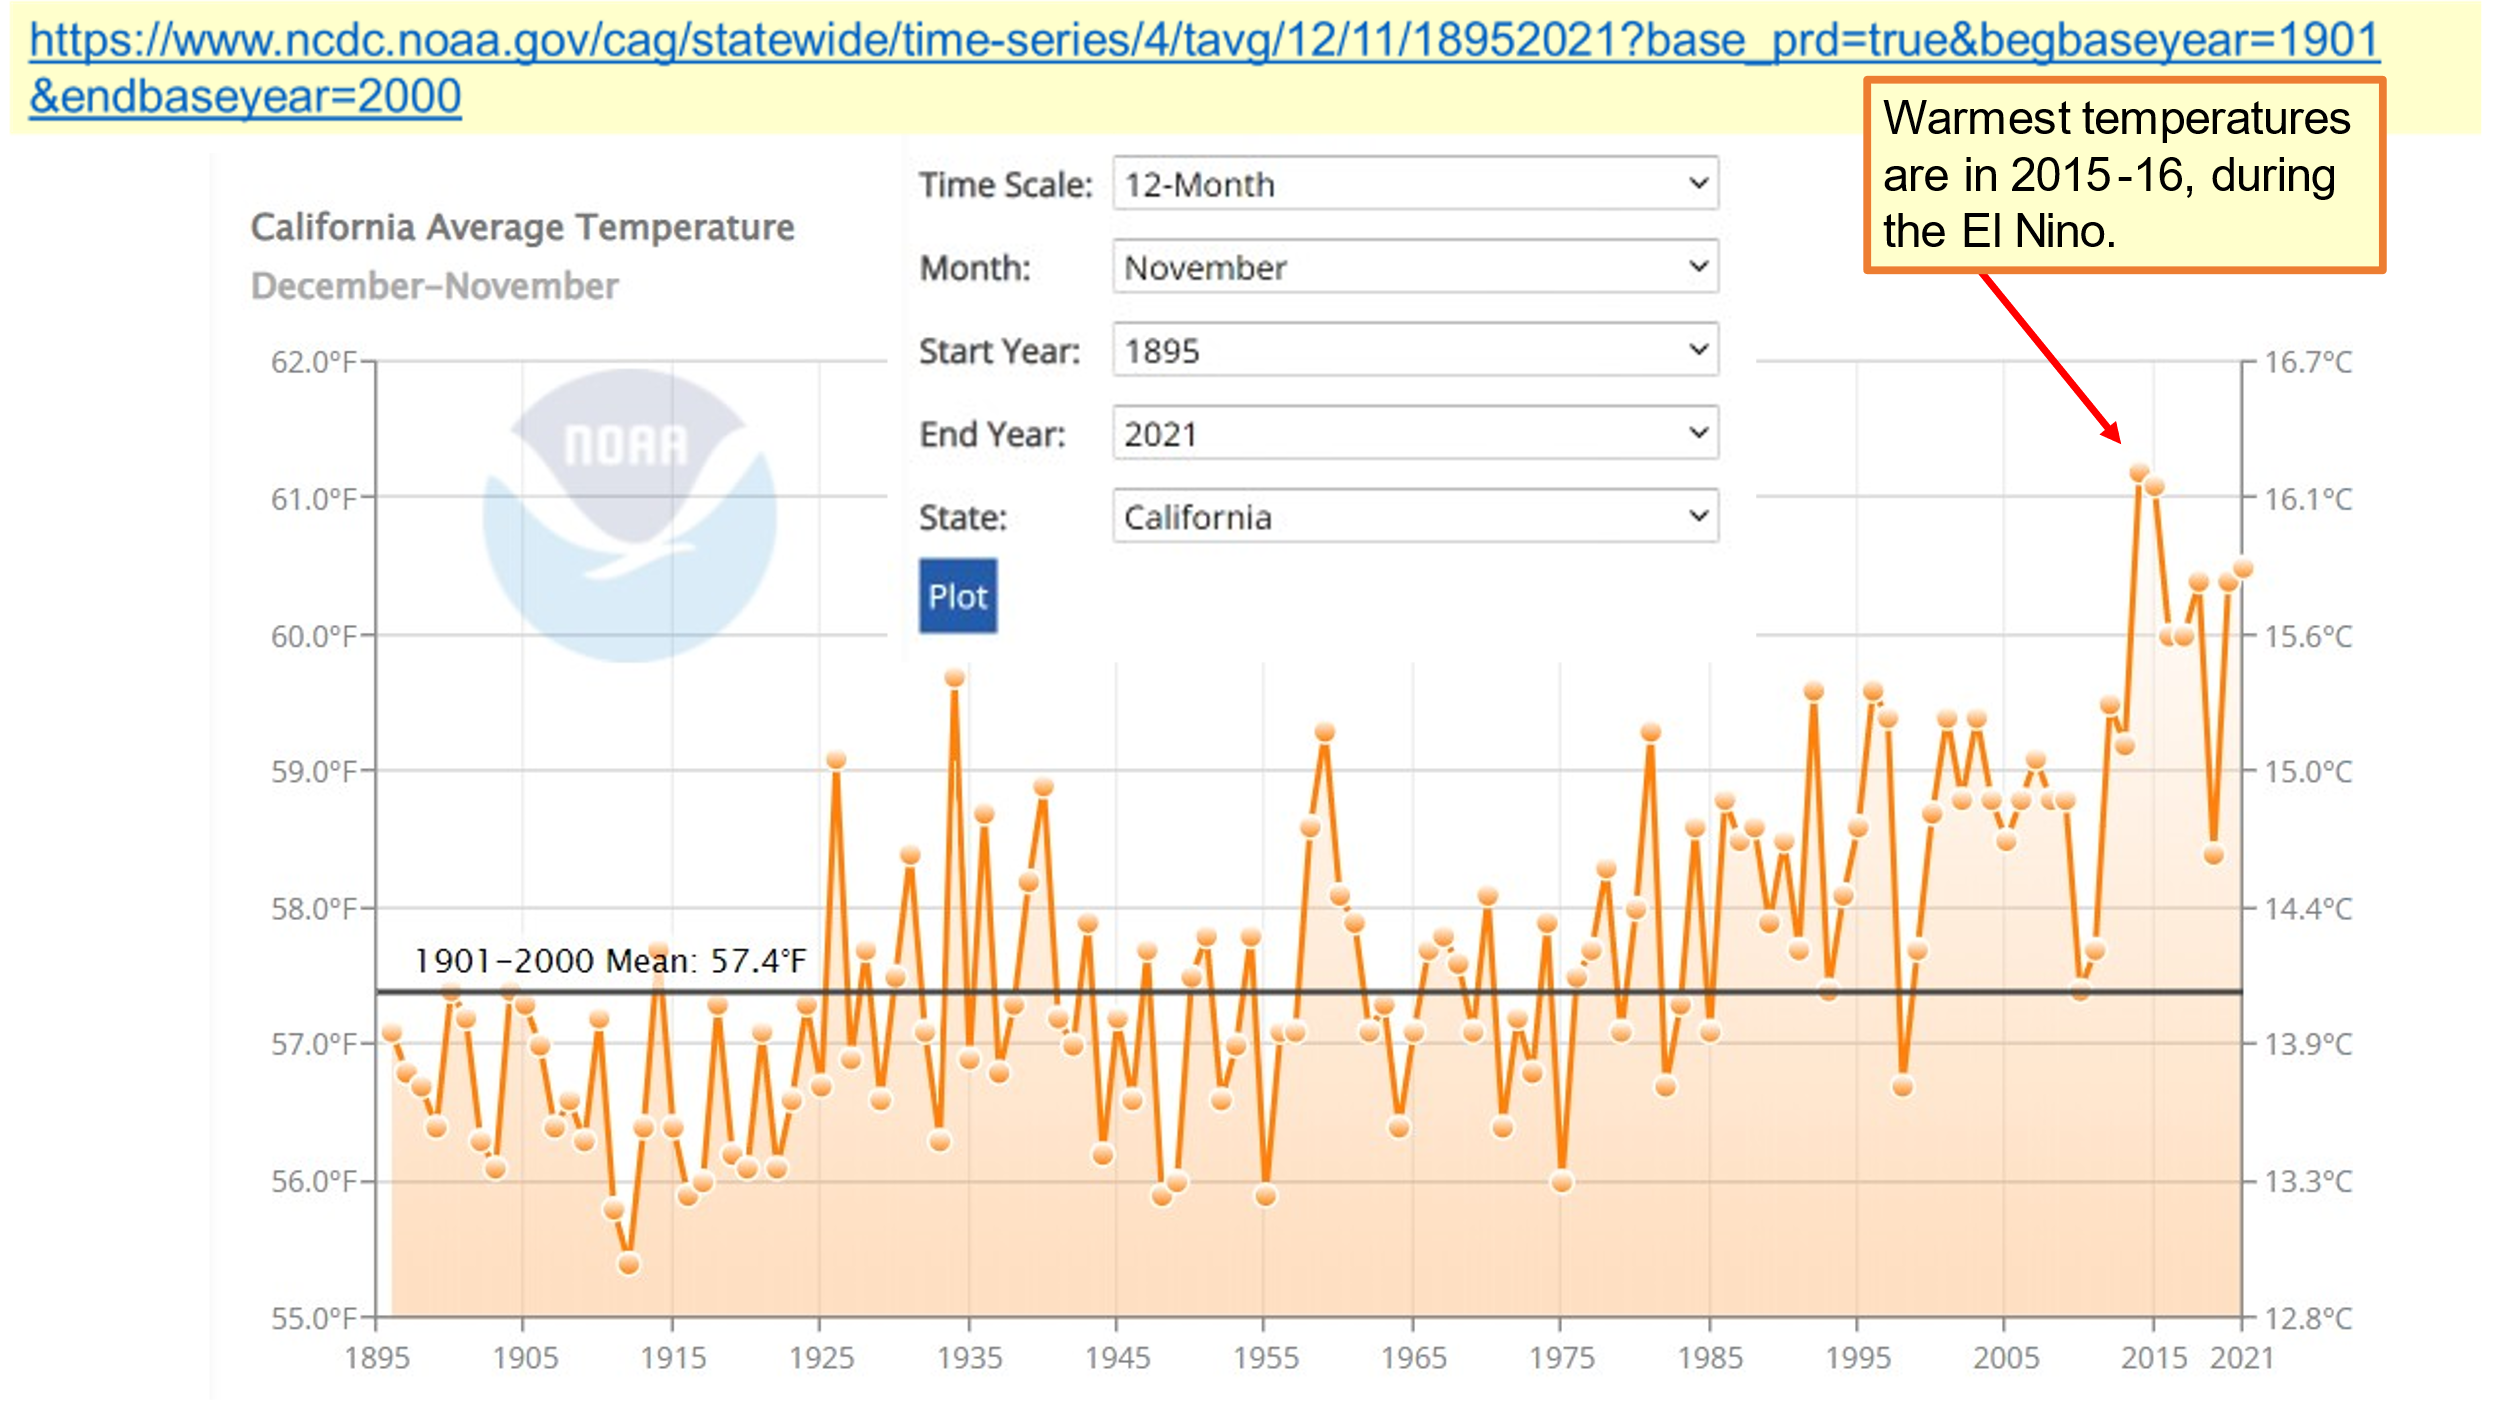
In 2015-2016 there is a spike in temperatures in California, a spike which occurred because of the peak in temperatures caused by the El Nino weather event of that time period. If you are not familiar with this phenomenon, one way to get spun up on El Nino is to read my post, https://casf.me/el-nino-and-la-nina-controls-rainfall-and-drought-in-western-usa/
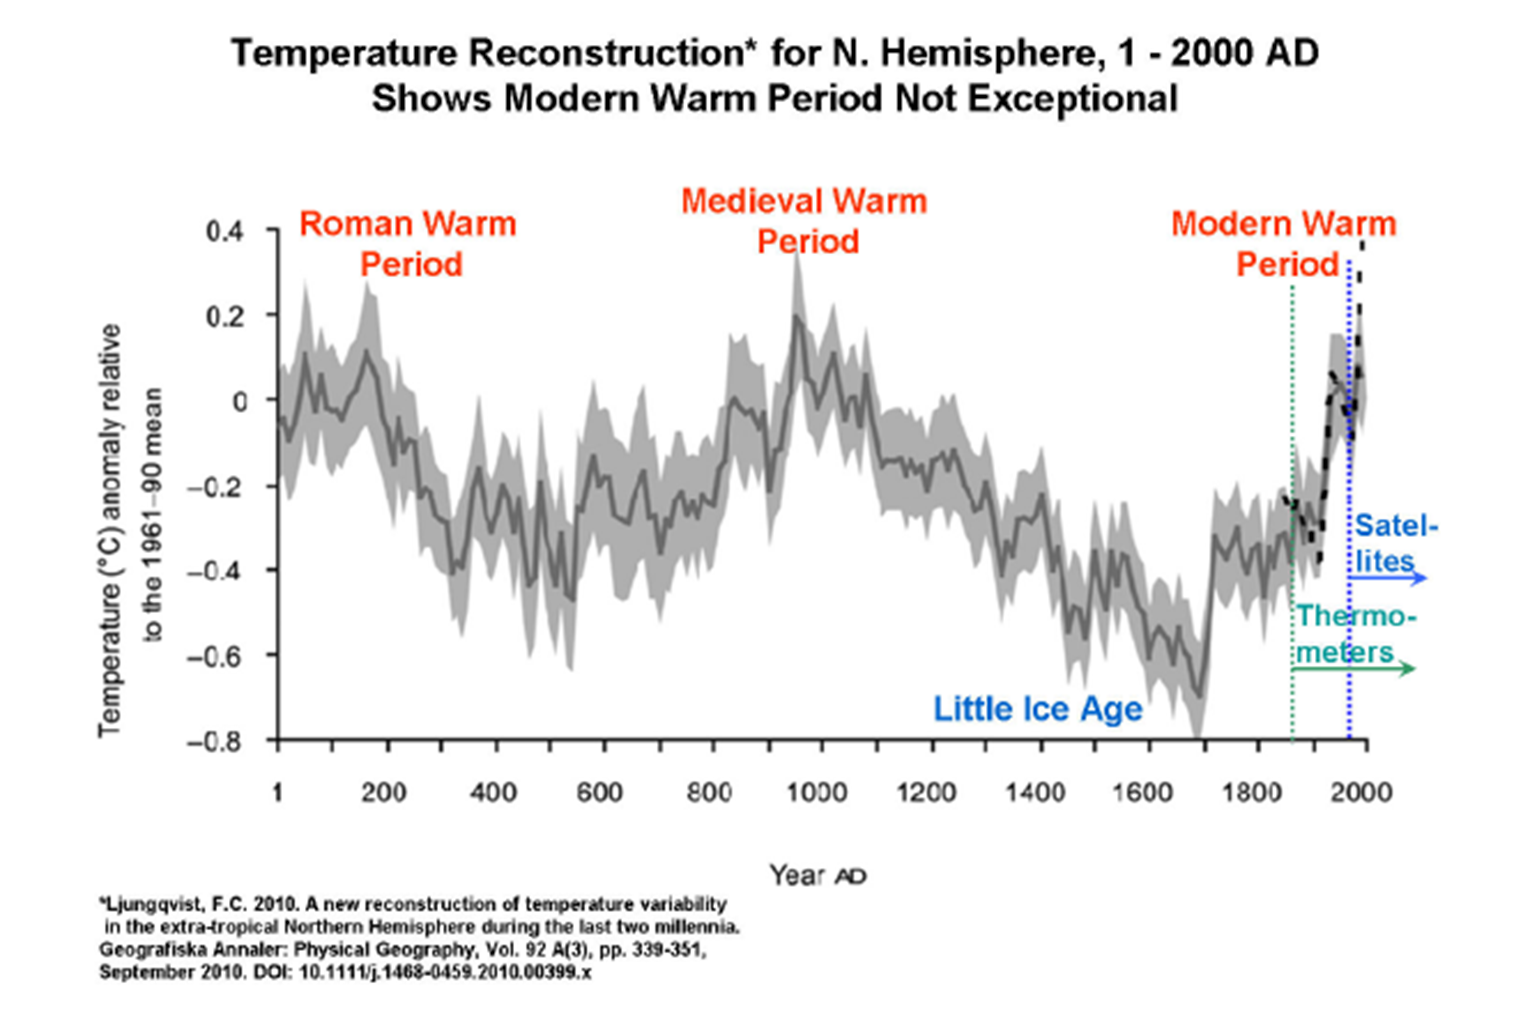
There are two factors which govern the long-term temperatures in California not mentioned by AARP.
ONE: There is a millennium-scale increase in temperatures, the quasi-thousand-year cycle, which many call the Bond Cycles, <Paywalled, but available for free here> discovered and published by the late Gerard Bond of Columbia University, which I discuss here. So, the Modern Warm Period is similar to the Roman Warm Period of 2000 years ago, and similar to the Medieval Warm Period of about 1000 years ago.
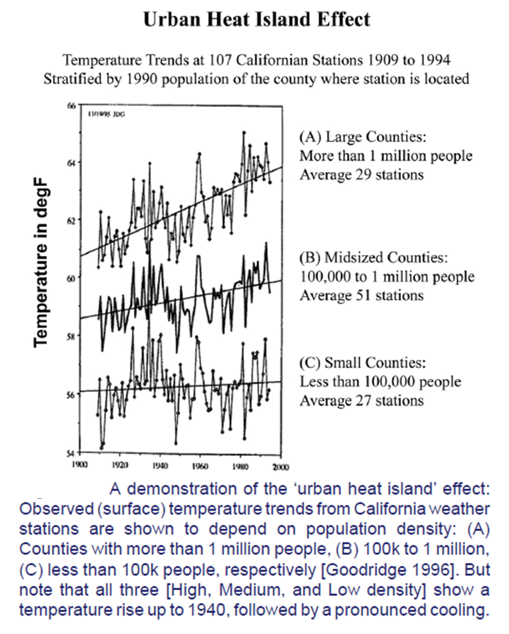
TWO: Most of the warming of California as a whole is a result of urban growth of the populous counties of California, as seen in the chart by Goodridge published in the Bulletin of the American Meteorological Society in 1996.
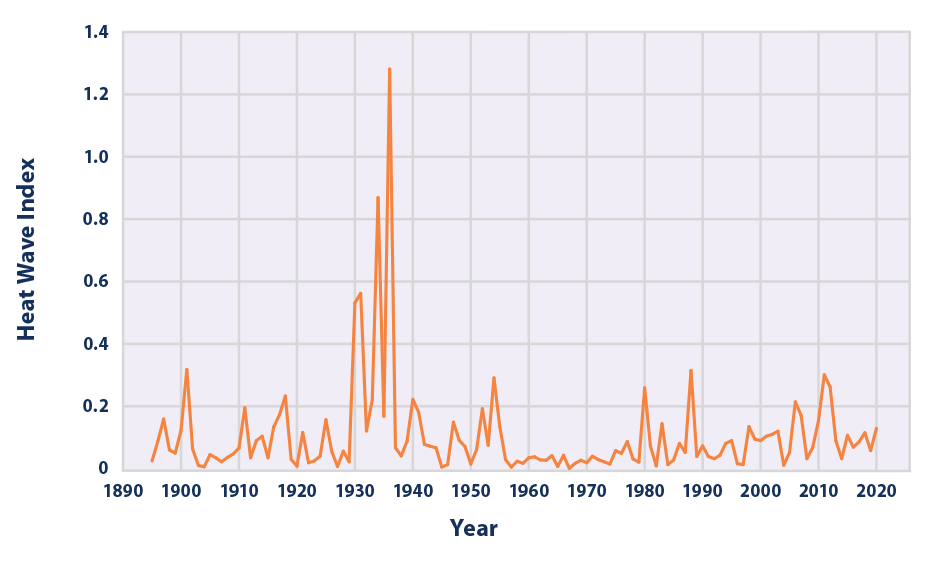
The EPA’s methodology for calculating heat waves from the free atmosphere is plotted below, from their web site at https://www.epa.gov/climate-indicators/climate-change-indicators-heat-waves
So, it is easy to see from this source, in addition to NOAA’s “Climate at a Glance” site, that there was no “record setting heat wave” in 2020.
But this is not the entire story. EPA recently “modernized” their web site to emphasize their own definitions of heat waves, almost exclusively in the 50 largest cities, where the Urban Heat Island effect has contaminated temperature measurements. The presence of buildings, roads, stores, shopping centers, parking lots, transport, and people using energy-consuming appliances and vehicles has caused the average temperatures to increase. The urban environment contains human-constructed elements which absorb the sun’s visible radiation during the daytime, energy which is re-emitted in the form of infrared energy at night. As a result, urban temperatures increase.
There is an excellent piece by Anthony Watts analyzing the Urban Heat Island of Las Vegas, NV, which shows that the increase in temperatures in Las Vegas has been driven by increasing minimum temperatures, and if you look at his post, you’ll see that the average annual maximum temperature in Las Vegas decreased from the 1940s to the 2010s, a big hit on CO2-fueled global warming theory.
So, in visiting the EPA’s Heat Waves Page, it is possible to find the time series chart plotted in Figure 5 above, but it is third out of three figures once you get there. EPA’s figure three, almost an afterthought, tells the story that is repeated many times at rural climate reporting sites having long periods of record. The Dust Bowl years of the 1930s are the years having the strongest heat waves, by far. So the EPA’s heat waves story, in that third out of three listings, finds the same story in the USA that we found in New Mexico’s temperature records.
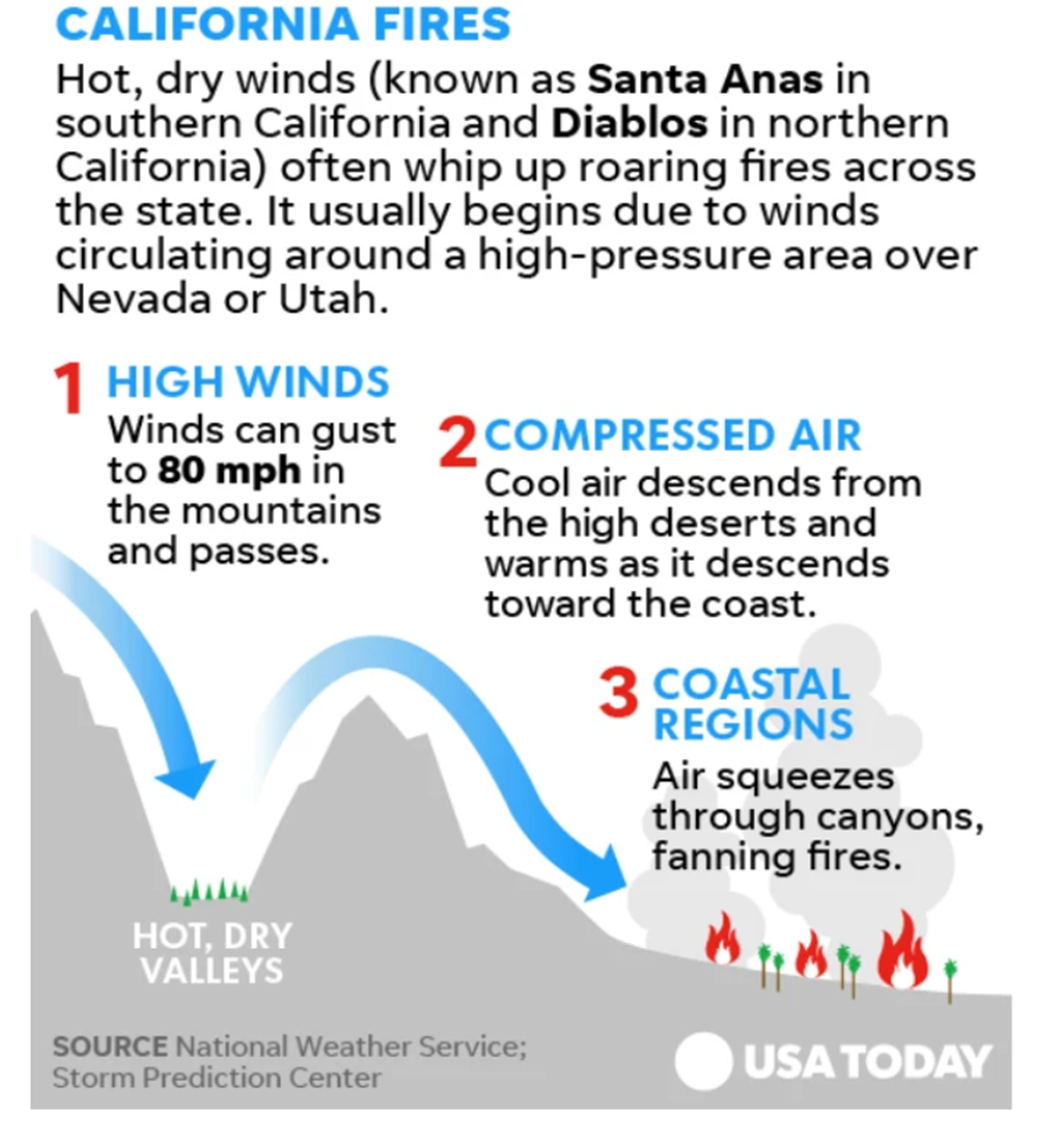
CALIFORNIA’S STRONG EAST WINDS BEGINNING IN OCTOBER, THE DIABLO AND SANTA ANA WINDS
AARP:
“Lightning and a record-breaking heat wave, combined with Diablo and Santa Ana winds, sparked wildfires…”
The Diablo, Santa Ana and even the El Norte winds are features of the climate of California, especially in October, even according to TIME magazine. This feature is part of the climate of California and has been known since the first Spanish settlers came to the area.
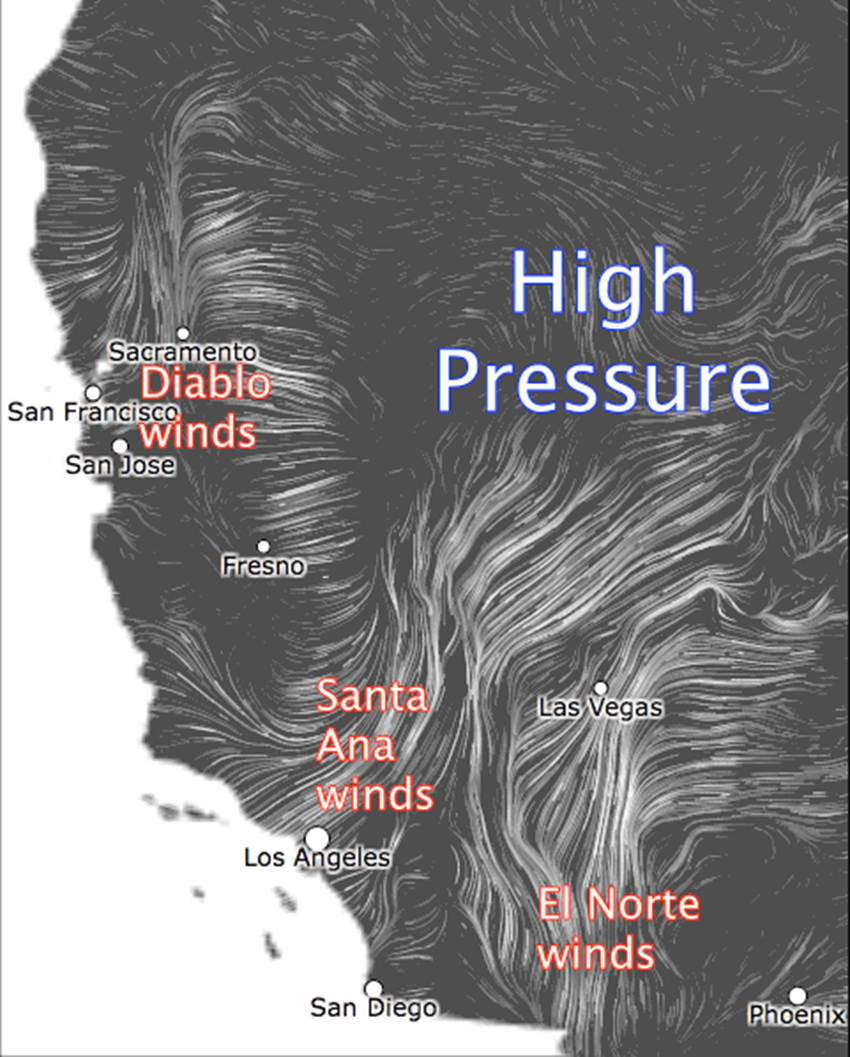
Every year, every autumn, cooler air with higher surface pressure pours into the mountain West behind the first Pacific storms, into Nevada. Development of high pressure over Nevada with lower pressure over the Pacific Ocean causes winds from the east and northeast, the Diablo and Santa Ana winds of California.
In the case of El Norte winds, strong winds from the north affect the Colorado River basin of California and adjacent Arizona. A physical property of the atmosphere takes hold when the air blows, for instance, from the high country of Nevada into California. The air warms “dry adiabatically” (it warms by compression) as it descends into the interior valleys of California and the coastal communities.
The chunks or “parcels” of air get hot and dry in a hurry. This feature is so well known that California’s arsonists are also very aware of this annual set-up for fire danger. Sadly, the arsonists often ignite blazes which quickly can become infernos, because the hot, dry winds provide extra oxygen into flames which burn tinder-dry grasses, other undergrowth, and trees which have not seen rainfall since early the previous spring.
The Diablo, Santa Ana, and El Norte winds, as a feature of the climate of California, are part of the climate we have, not a result of “climate change,” and certainly are not a result of human-caused CO2-fueled global warming.
AARP’s writers do not know the difference between weather and climate, nor the seasonal changes in the wind patterns of California. That they call ordinary seasonal changes “climate change,” further marks their ignorance.
Now, more about that AARP claim:
“Lightning and a record-breaking heat wave, combined with Diablo and Santa Ana winds, sparked wildfires…”
I mentioned above that the mid-August 2020 dry lightning surge was caused by a very rare weather event, the leftovers from Tropical Storm Fausto bringing middle level atmospheric moisture to the Bay Area of California. I also mentioned that it is October that brings the high-pressure systems to Nevada to bring the strong pressure differences between Nevada and the California coast.
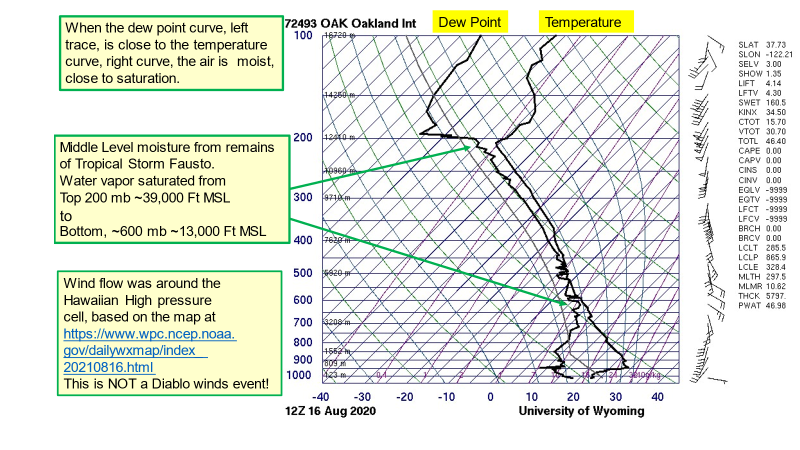
Using the University of Wyoming Upper Air Sounding Web Site, I checked every upper air sounding from NOAA’s Oakland, California upper air site from 1 Aug 2020 to 15 Sep 2020, with 16 August being the onset day of the lightning-caused fires near the Bay Area, to check the veracity of AARP’s claim that the dry lightning surge acted in combination with Diablo Winds to intensify the fires. There were precisely ZERO occurrences of Diablo Winds during this period.
But of course. The Diablo and Santa Anas are cool season episodes brought on by high pressure over Nevada. Anyone who can use a web browser can look at the August sequence of upper air soundings from Oakland and see the intrusion of middle level moisture which reached its peak at 1200 Zulu time on 16 August 2021. An annotated sounding is Figure 8 below. And that intrusion of middle level moisture, left over from Tropical Storm Fausto, was the highly unusual weather event that set off the “siege of dry lightning.”
For those needing an introduction to the SkewT-Log P thermodynamic diagram, there is a brief introduction at https://casf.me/wp-content/uploads/2019/09/Weather-Climate-and-Climate-Change_Instructor-Intro_4_Sep_2019.pdf slide 18. The “SkewT” is a type of graph paper for meteorologists. The lower right shows the convention in plotting the winds, the “wind barbs” mentioned below.
The
“siege of dry lightning”
was a very rare weather event; it had nothing to do with Diablo or Santa Ana winds, and it had Zero to do with a changing climate. AARPs writers could not be more wrong in their assertions.
This again points to the overgrowth of vegetation, trees, and forests, especially with the Spotted Owl Decision which essentially halted harvest of forest products from most of this area.
Visitors here might recall that I previously described the late 2017 California fires which were fueled by Diablo and Santa Ana winds.
OTHER AARP ERRORS: “YOUR FINANCES RISK: GREATER STORM RISK IMPACT: RISING HOME INSURANCE RATES”
This 2021 AARP story claims that there is a greater storm risk which will lead to rising home insurance rates. It uses the rainfall in 2017 with the landfall of Hurricane Harvey very close to Houston as a metric.
AARP:
“For instance, a storm delivering 40 inches of rain over four days in Texas was nearly unfathomable – until Hurricane Harvey in 2017. After that, actuaries recalculated the odds to 18 percent for a similar or bigger storm by the end of the 21st century because of climate change. That means higher bills.”
What’s wrong is more rain fell nearby, fewer than forty-two years previously, and in fewer hours. Such an occurrence was NOT “unfathomable;” it happened before, in almost the same place, Alvin, Texas, fewer than ten miles south of Houston’s Hobby Airport, in 1979 with the Texas landfall of Tropical Storm Claudette. At least 42 inches of rain fell in 24 hours at Alvin, according to NOAA’s extreme record data base for Texas.
Based on these facts, it might appear that AARP is working with the insurance companies to jack up insurance rates paid by AARPs members who pay the higher homeowners’ insurance rates.
ANOTHER AARP ERROR: “RISK: HOTTER CLIMATE IMPACT: HEAT RELATED AILMENTS”
AARP:
“in September 2020, L.A. County recorded its highest temperature on record — 121 degrees — a few weeks after California’s Death Valley reached what might be the highest temperature ever recorded on Earth: 130 degrees”
The 121 F record in Los Angeles County was set in the Woodland Hills observing station on the campus of Pierce College. The Wikipedia entry for Pierce College gives us insight into this record temperature:
“…Pierce College comprises 426 acres amidst a dense metropolis…” bolding added.
The Goodridge diagram shown previously in Figure 4 tells us that the warmer temperatures and the steeper rate of increase of temperatures are driven by the Urban Heat Island effect, not CO2-fueled climate change.
AARP is discussing a weather event, Death Valley reaching a 2020 temperature of 130 F. But according to NOAA’s Extremes Data base, the extreme maximum surface temperature of 134 F was set at Greenland Ranch, Death Valley National Park on 10 July 1913.
AARP Cites a hot weather event in 2020 as proof of a hotter climate. However, the extreme was 4 F hotter, a record set over 100 years ago, in 1913.
YET ANOTHER AARP ERROR. “RISK: RISING OZONE LEVELS IMPACT: INCREASED LUNG DISEASE”
AARP points out correctly that rates of smoking are going down and notes that emphysema rates have remained steady. AARP:
“One culprit, scientists surmise, is rising levels of ground ozone, an invisible gas associated with automobile exhaust and factory emissions.”
Below is what I found when I looked up the EPA data on ground level ozone at https://www.epa.gov/air-trends/ozone-trends
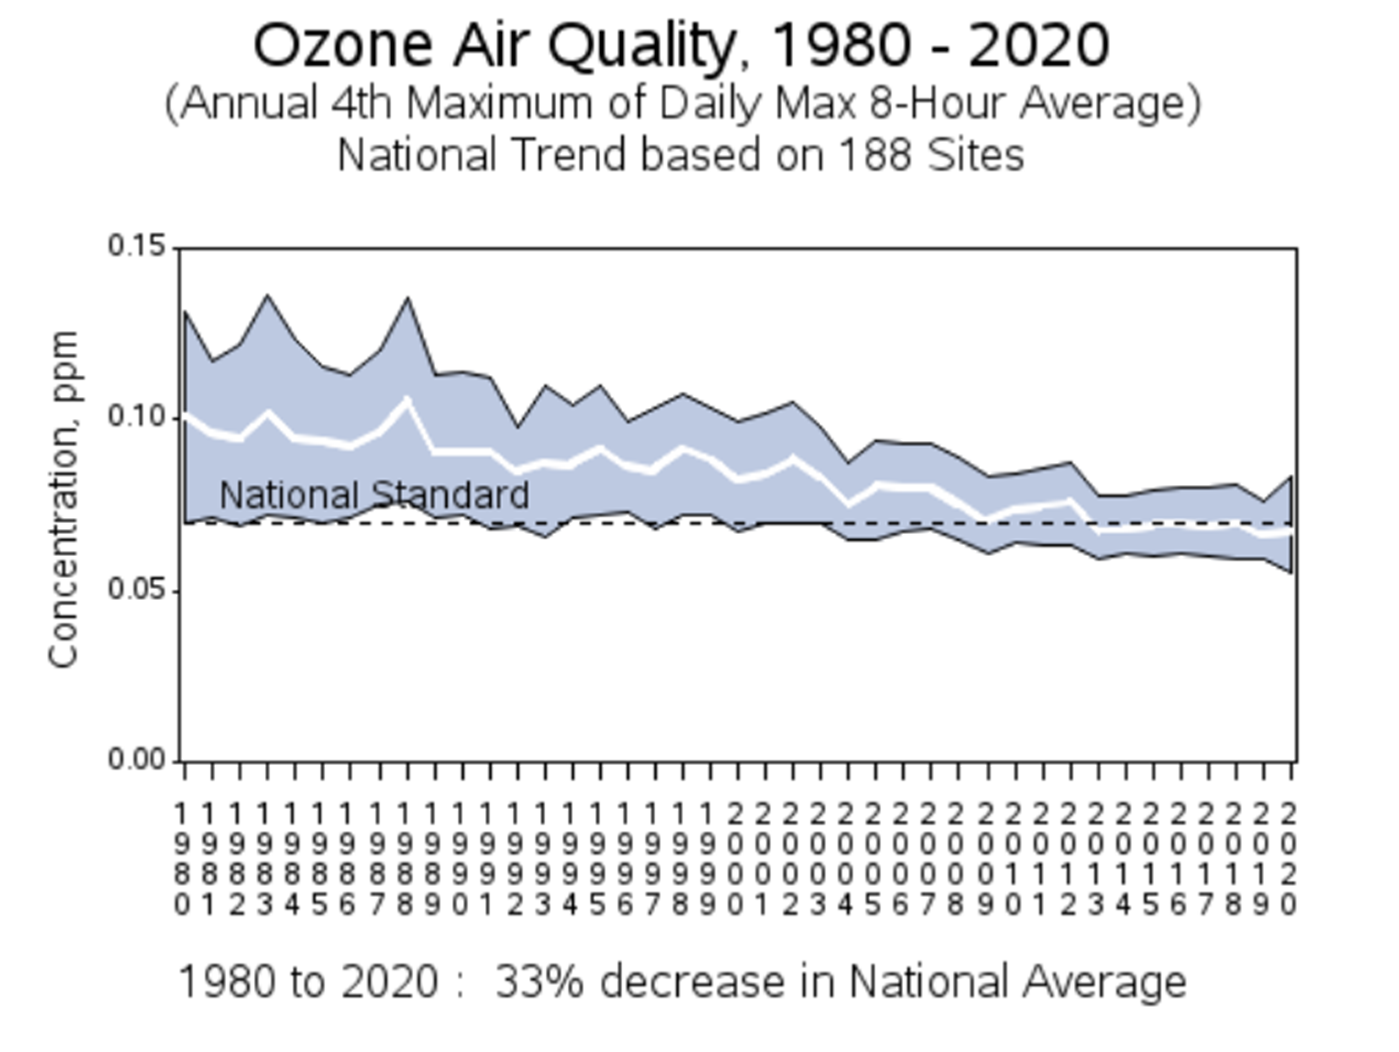
The AARP says that in the US, Ozone levels are rising and contributing to lung disease. The data show a completely different story. In truth, in the US, Ozone levels are falling, 33%, based on data published by the EPA.
AARP is putting out more false news with this claim.
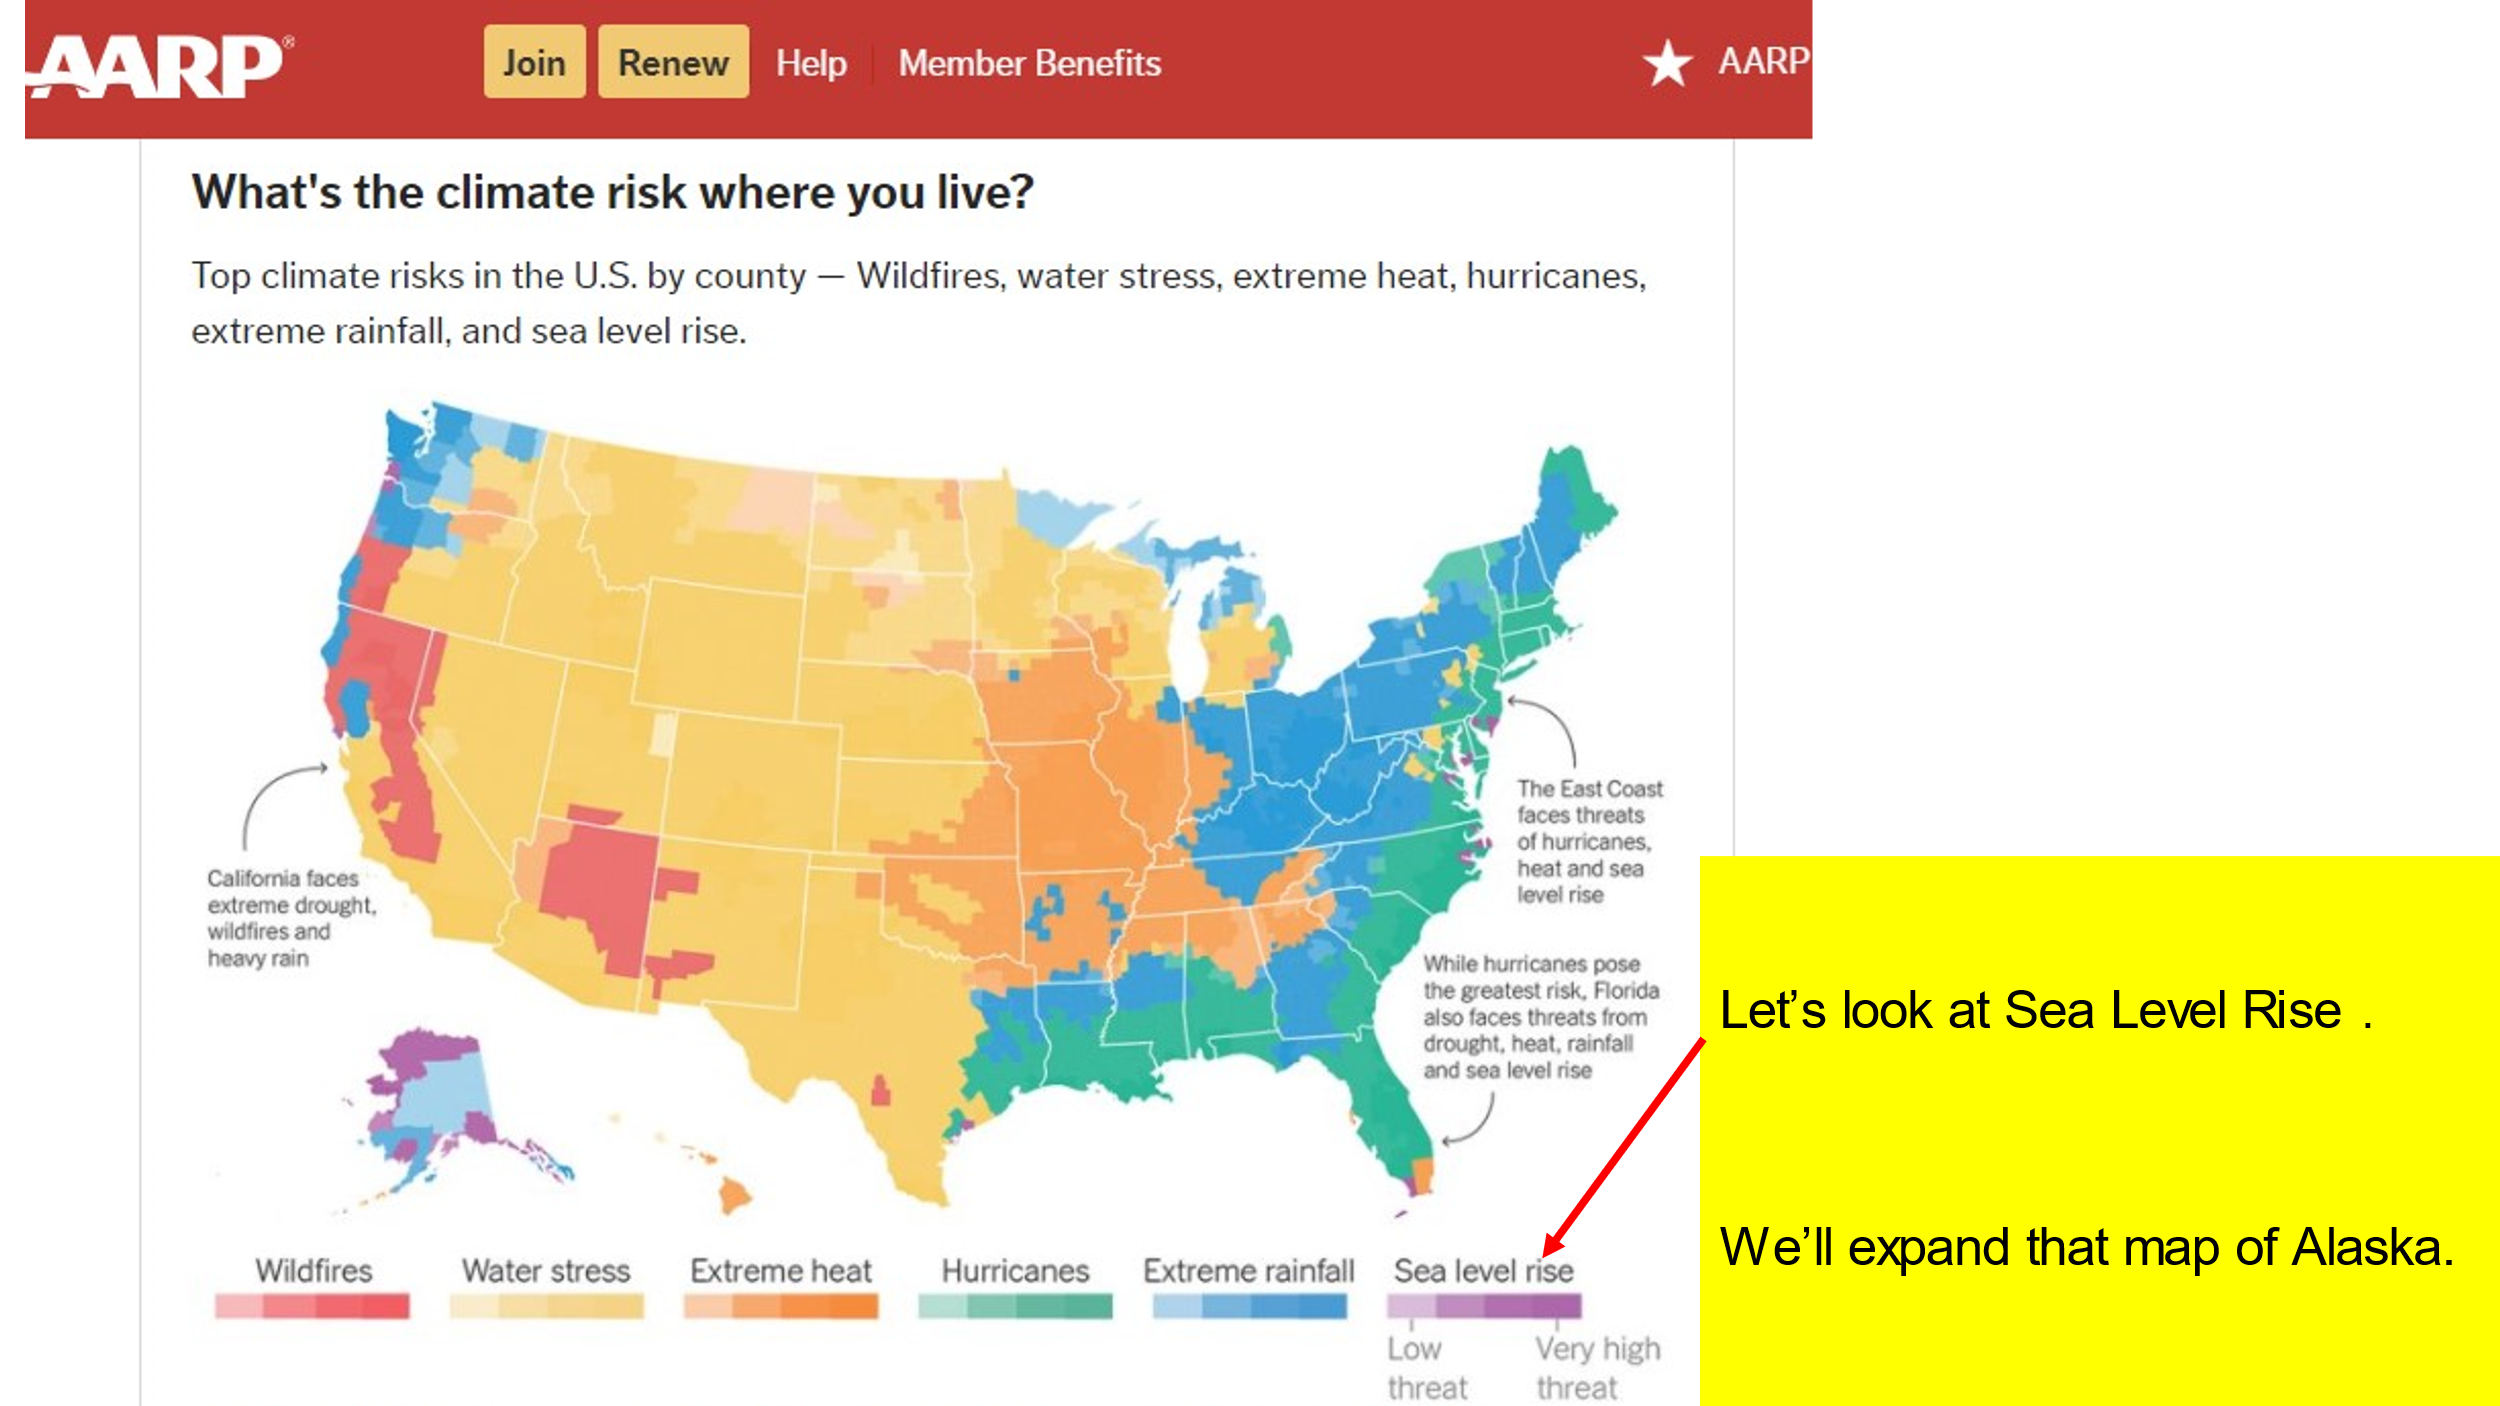
AARP’S SEA LEVEL CLAIMS FROM THEIR MAP, ALASKA’S GULF COAST IS BEING THREATENED BY A “VERY HIGH THREAT” FROM SEA LEVEL RISE
AARP’s article has a map which claims the entire country is plagued by worsening conditions caused by climate change.
Among the most egregious claims is that the populated areas on Alaska’s Gulf Coast are being threatened by a “very high threat” from Sea Level Rise.
This claim is wrong, because the rate of sea level rise has not changed since at least 1856, when Franklin Pierce was President of the US, and the first tide gages were installed at Manhattan’s Battery, and in San Francisco Bay. While “no acceleration in sea level rise” is true in the USA, it is also true worldwide.
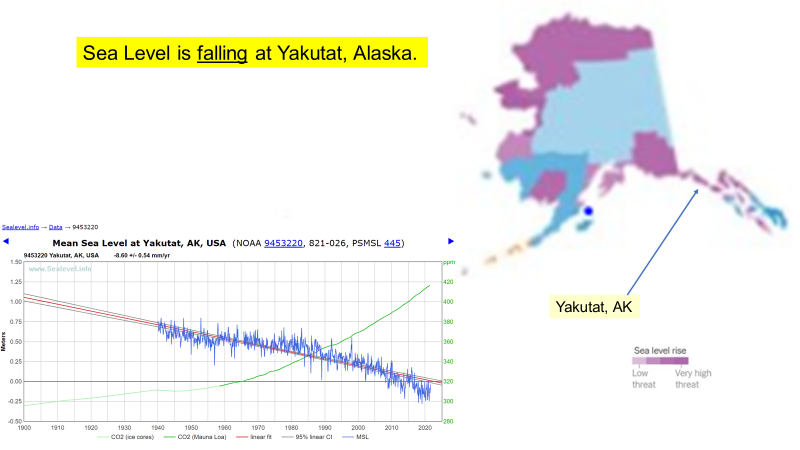
AARP’s claims for Alaska are entirely wrong because sea levels are falling (!), not rising, along the Gulf of Alaska coast. The post-glacial rebound effect is strong on the Gulf of Alaska coast, because the Wisconsin Ice Sheet melted away thousands of years ago. The crust, which had been pressed down into the mantle by heavy accumulations of ice, is continuing to rebound, so the tide gages show the sea falling away from the land.
I demonstrate this in the next two graphics.
I found six NOAA tide gages on the Gulf of Alaska shoreline: Juneau, Nikiski, Anchorage, Yakutat, Seldovia, and Skagway, and using Dave Burton’s web site https://sealevel.info plotted the time series of sea level change over the time domain of the period of record for each.
An example, for Yakutat, Alaska is shown below. I used AARP’s map of Alaska, color-coded for rate of sea level change, and displayed the location of each of the six tide gage stations.
These are the six stations and rates of sea level change that I found for NOAA’s Gulf of Alaska stations:
STATION RATE OF SEA LEVEL RISE
Yakutat -8.60 +/- 0.54 mm/year.
Skagway -18.04 +/- 0.52 mm/year
Anchorage -2.10 +/- 0.79 mm/year
Nikiski -10.57 +/- 0.95 mm/year
Juneau -13.36 +/- 0.33 mm/year
Seldovia -9.88 =/- 0.70 mm/year
Graphs and maps for each of these six stations are in the presentation graphics, link at the top of the post.
AARP could not be more wrong on their claims of rapid sea level rise in the Gulf of Alaska. Terrain is rising, and seas are falling away from the land as the crust rebounds from the loss of the glaciers which formed during the Wisconsin Ice Age, and have subsequently melted away during this, the Holocene warm period.
The only way that AARP could have been so wrong in their pronouncements of
“Very high threat”
of sea level rise is to have writers who have had no Earth Sciences education and have developed no ability to look things up before committing their “work” to the keyboard. This is poor scholarship. Demonstrable ignorance of the subject yields demonstrably fake news.
WE FOUND WHERE THE GOVERNMENT HAS BEEN NOT TELLING US THE TRUTH, OR NOT TELLING THE ENTIRE TRUTH
The National Interagency Fire Center, NIFC, hides all fire records before 1983, the El Nino year at the peak of the last PDO-warm period. With copious rainfall, few fires occurred in 1983. Starting the NIFC records in 1983 cherry picks the starting point and portrays a false picture that fires are increasing.
NOAA stopped reporting on Tornadoes EF3 and higher; they now report “all tornadoes.” Technology and higher population allow more weak tornadoes to be seen and reported. The marked decrease in strong to severe tornadoes in recent years is being deliberately hidden from the public.
Not explicitly shown, but clearly the case, it was very difficult to obtain the USCRN time series for the presentation graphics from Internet Search. I had to email NCDC THREE TIMES before they could provide me the internet location and sequence of keystrokes to access the USCRN time series of temperatures.
EPA’s Heat Wave Index was de-emphasized, because it showed the Dust Bowl of the 1930s had the greatest number of heat waves in the USA. The data put the lie to the AARP claim of a
“record-setting heat wave in 2020.”
NASA GISS has been fudging surface temperature records for years. The presentation graphics show they cool the past, eliminate hot temperatures from the 1880s and 1890s and make present temperatures hotter than measured.
CONCLUSIONS
The AARP June 2021 BULLETIN’s feature article, “Climate Change and You,” is a target-rich environment for anyone inquisitive of their copious claims of climate catastrophe confronting the country’s citizenry.
AARP’s use of Texas’ February 2021 cold weather events as an example of “climate change” is shown to be wrong, false, and more evidence of poor scholarship in the pursuit of narrative. Every several years the jet stream pattern brings Arctic air pouring south from the Canadian Arctic into Texas. My BS detector went off immediately when AARP claimed at the top in their story that Texas’ freezing rain in Feb 2021 was a
“never before seen”
event, when I had seen just such an event while attending Air Force Basic Meteorology training at Texas A&M in 1964. A search of news stories and weather records turned up the numerous articles showing how wrong AARP’s writers were about occurrences of Texas’ winter weather.
AARP’s use of the 2020 fires in California as an exemplar of changing climate brought forth another plethora of scholarship errors. Journal references, news articles and internet search found that contrary to AARP’s claims, 2020 was NOT the worst fire season on record, and that 2020 did NOT bring a
“record-setting heat wave”
to California.
AARP’s claims that,
“Lightning and a record-breaking heat wave, combined with Diablo and Santa Ana winds, sparked wildfires…”
were not examples of a changing climate, rather an extremely rare weather event, partly caused by left-over moisture from dissipated Tropical Storm Fausto, which brought dry August thunderstorms to the Bay Area. Also, extremely dry grass, other vegetation, and especially trees, unharvested for thirty years since the Spotted Owl Decision, were set alight by lightning without rain.
There were NO Diablo or Santa Ana winds fanning the flames as claimed by AARP, it was overgrown vegetation’s excessive fuel load which caused the severity of the fires, man-caused for sure, but nothing to do with a changing climate.
AARP claimed that 40 inches of rain in Houston, Texas in four days following landfall of Hurricane Harvey in 2017 was
“nearly unfathomable.”
But AARP is clearly out of its depth in making this claim, because 42 years previously the US 24-hour record was set with the landfall of Tropical Storm Claudette on 24 July 1979 and the accumulation of at least 42 inches of rain, which occurred at Alvin, Texas, fewer than ten miles south of Houston’s Hobby Airport. More rain in one day a few miles away from Houston, in Alvin, Texas! What is “unfathomable” is AARP’s stunning ignorance of Texas’ rainfall records.
AARP claimed that increasing lung disease in the US was caused by rising levels of surface ozone, supposedly because of automobile exhaust and factory emissions. What’s wrong with AARP’s claim? EPA measured a 33% decrease of surface ozone from 1980 to 2020.
AARP claims that a surface temperature record of 121 degrees in Los Angeles County was an indication of a hotter climate, but we saw that Urban Heat Island effect in large population counties dominates California temperatures. That 121 F record was set in Woodland Hills, on the campus of Pierce College;
“426 acres amidst a dense metropolis”
is the give-away that this is Urban Heat Island effect: warmer city temperatures for sure, but not climate change.
In the same paragraph, AARP says, that the 121 F at Woodland Hills followed,
“a few weeks after California’s Death Valley reached what might be the highest temperature ever recorded on Earth: 130 degrees.”
The extreme maximum surface temperature on Earth was set at Greenland Ranch, Death Valley National Park, 134 F, recorded 10 Jul 1913. That is correct! The record was 4 F higher and set over 100 years prior. This is yet another “Oops!” needed to describe errors in the AARP narrative.
In what appears to be the biggest error in terms of area, at least, are AARP’s claims of a
“very high threat”
of sea level rise along the entire Alaska coast on the Gulf of Alaska.
This is the region of Post-Glacial Rebound, where the Wisconsin Ice Sheet was so deep that the ice pressed the continental crust into the earth’s mantle. At the end of the Wisconsin Ice Age some 20,000 years ago, that ice sheet melted, and the stored water in the form of glacial ice ran off into the oceans.
With that mass of ice removed, Earth’s crust is rebounding. Tide gages show the sea falling away from the rising land making it appear to the tide gages that sea levels are falling.
These six tide gage locations show significant sea level falls: Anchorage, Juneau, Nikiski, Seldovia, Skagway, and Yakutat. It takes a particularly ignorant set of AARP authors to mistake dramatic sea level falls for a “very high threat” of sea level rise along the entire Alaska coast on the Gulf of Alaska.
AARP’s “Climate Change and You” is a stunningly ignorant story. Poor scholarship only begins to characterize this material. Woefully ignorant in Earth Science, and the study of Atmospheric Science, the authors compile a supposed litany of “climate change” stories based on one of many winter storm events in Texas, and an extremely rare event, leftover clouds and water vapor from dissipated Tropical Storm Fausto. This unusual weather event triggered dry lightning in the Bay Area, which set alight dry grasses and a huge fuel load of unharvested trees. The intensity of the fires which resulted was caused by a huge buildup of undergrowth and trees unharvested since the Spotted Owl decision of thirty year ago.
The AARP authors have shown that ignorance of earth and atmospheric science, combined with lack of critical thinking skills, can lead to, and has led to, a near record number of errors, worthy of mention in a to-be-established Fake News Journalism Hall of Shame.