
By Robert W. Endlich
In describing the errors in the Fourth National Climate Assessment, ‘NCA4’, I’ll use the words from the Executive Summary which purport to link climate changes in the USA to global climate change.
The first claim, “The last few years have also seen record-breaking, climate-related weather extremes,“ is shown to be false, simply by examining climate records, some from the National Climate Data Center.
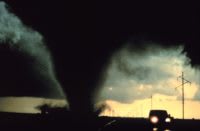
Tornadoes have been decreasing over the past six decades as temperatures moderate from the significant cooling of the 1940s to 1970s. As a basic knowledge of meteorology teaches, it is the pole to equator temperature difference that drives the intensity of cold season storms and especially the spring-season storms which bring the extremely strong tornado outbreaks.
Emblematic of the 1965 spike seen in Figure 1 below, is the 1965 Palm Sunday Tornado Outbreak, which occurred when I was an Air Force shift forecaster on duty that day. I clearly recollect my first glance at the weather map that day was followed with a sense of dread; I had studied and presented to my class at Texas A&M the year before on severe weather, using the Dallas Tornado of 1956 as a model to understand how the weather situation controls such outbreaks.
Emblematic of the prominent 1974 spike in Figure 1 is the 1974 Super Tornado Outbreak and the devastating tornado that destroyed much of Xenia, Ohio. From the story at the link above, “It was also the most violent tornado outbreak ever recorded, with 30 F4/F5 tornadoes confirmed,” and, “Never before had so many violent (F4 and F5) tornadoes been observed in a single tornado outbreak. There were seven F5 tornadoes and 23 F4 tornadoes.” Among the communities affected, the death toll was dreadful – Xenia, OH, 34, Brandenburg, KY, 31, and Guin, AL, 28. The devastation imposed on the communities affected was catastrophic. Notable was the capture on video of a triple-vortex tornado in Xenia, previously thought to exist, but this was the first such filmed and subsequently broadcast. Dr Ted Fujita’s report on this outbreak, previous link, a remarkable document, is contemporary with his study of this event.
Readers of popular literature of the time will recall that the extensive cooling of those years was leading to open and frequent speculation of a return to the cold of the Little Ice Age. A number of these are posted in WEEK FIVE of the UTEP CLASS presentations, beginning with slide 101 and extending to slide 117, and which includes such present alarmist publications as TIME, NEWSWEEK, and the New York Times. Slides 118-120 show that the extensive cooling measurements extended to the technical literature of the American Meteorological Society, which also has since become an alarmist organization, especially with the story on slide 120 by alarmists Peterson, Connolley and Fleck which tells you that those stories of cooling are a myth.
Nonetheless, Figure 1 shows demonstrably that the extensive tornado activity of the 1950s to the 1970s exists in the data base, and that the slight warming of the past decades has resulted in fewer tornados and fewer tornado outbreaks, not more, as claimed by NCA4.

Looking at global hurricane frequency since 1980 with Ryan Maue’s data sets, beginning with Figure 2, below, clearly the total number of hurricanes globally is decreasing, although there’s an increase in major hurricane frequency. Since the gross amount of CO2 is increasing almost monotonically, with an annual cycle driven by Northern Hemisphere plant growth and decay, Maue’s chart shows a distinct multi-annual and perhaps multi-decadal saw-toothed pattern. There is little related to increasing <CO2> in this data set.

The next data set shows accumulated cyclone energy, which some call “ACE” for short, from the early 1970s to the present. For those of you not familiar with the term, “accumulated cyclone energy” derives from kinetic energy as learned in high school physics. Kinetic energy is defined as mass times the square of velocity, so accumulated cyclone energy is accumulating or summing the square of the maximum speed of each tropical storm or hurricane, every six hours, for every day of its life, continuing this process for each storm, and counting through every day of the year, and then analyzing the result. Below is the accumulated cyclone energy chart Dr. Maue has posted on his web site.

Typhoon is another name for the same type of system in the Western Pacific north of the Equator. The claim that weather extremes in terms of the energetics of global tropical storms, hurricanes, and typhoons is increasing as carbon dioxide increases is plainly wrong.
What about major hurricanes striking the US mainland? What about 2017’s Hurricanes Harvey and Irma hitting Texas and Florida, and 2018’s Hurricane Florence? We have a lot more data on hurricane strikes to the Continental US, since the 1930s which is displayed in Figure 4 below, from Dr. Roy Spencer’s blog.

The claim that extreme weather is increasing in the form of hurricane effects is clearly wrong, and to miss these data while NCA4 claims the opposite seems ignorant, poor scholarship, or fraudulent, take your choice.
This next section deals with the large California fires of the past couple of years, often characterized as extreme weather effects.
In 2017, we saw the Wine Country Fire of northern California and the Thomas Fire near the mountainous areas above Santa Barbara. I described them here, writing and illustrating how the combination of geography, topography, Mediterranean-type of climate, and the progression of seasonal wind patterns produces the conditions where such fire danger occurs almost on an every-year basis.
The 2018 autumn also resulted in numerous California fires, among the most notable being the Woolsey fire of Los Angeles and Ventura Counties with three killed by the flames, and the Camp Fire of Butte County which destroyed almost the entire town of Paradise on 8 November. The Camp Fire killed an estimated eighty-six people as of this writing, making it the deadliest fire in California history.
Amidst the claim that human-caused CO2-fueled warming was the cause, it seems obvious that the most important element of this and the 2017 fires was the dramatic increases in fuel loads associated with the substantial reduction of lumber board feet harvested, a lack of clearing underbrush and debris, and the estimated 129 million unharvested dead trees in California, many of which were victims of drought and pine bark beetles.
The decision to close California forests to most logging to help the Northern Spotted Owl in 1991, followed by restrictions in cleaning and clearing forests of litter and debris, allowed fuel to accumulate to this dangerous level. The consequences of that action seem clear: when pines are not thinned, they become over-ripe and the favorite food for bark beetles. These un-thinned forests are much more susceptible to bark beetle infestation, some up to ten times more, based on research by Montana State University and the US Forest Service, the latter in California forests.
Figure 5 below is a graphic showing the likely linkage of that Spotted Owl decision with the dramatic decrease in board feet harvested followed by a substantial increase in spending for wildfire suppression, following the changeover from PDO Warm (wet in the west) to PDO Cold (dry in the west) about 1999.

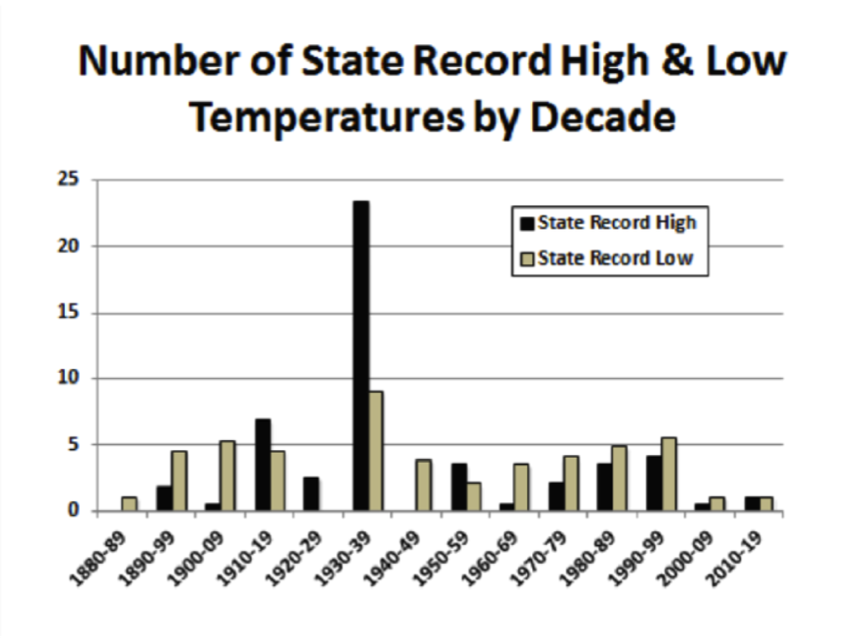
We also have this from the same executive summary for NCA4, “The last few years have also seen record-breaking, climate-related weather extremes, and the last three years have been the warmest years on record for the globe,” bolding added. The last three years have been very warm, due in part to the dramatic El Nino weather event from 2016 and 2017. However, the claim that these last three years have been the warmest on record should note that we’ve had modern thermometers widely available only since the 1800s, and the Dust Bowl years of the 1930s in the USA had wide ranging effects both in the USA and world-wide.
In the USA, for the fifty states, fully 23 states had their extreme record maximum temperatures set in the decade of the 1930s, as shown in Figure 6 below.

That twenty-three of the extreme maximum temperatures were set in the decade of the 1930s leads me to doubt the claim by the NCA4 authors that the last three years are the warmest in the historic record.
Numerous stories in contemporary news accounts from the 1930s also lend doubt to the claim that the present temperatures are the hottest in modern times. Among the newspapers quoted (15 December 2018 presentation, slides 55-63) are the Los Angeles Times, Chicago Tribune, the Manchester Guardian, the Hartford Courant, and the Bend (Oregon) Bulletin.
Since there’s a dearth of modern extreme maximum temperatures, there is another explanation for the claim of increasing modern heat which has nothing to do with “more CO2 trapping the sun’s heat,” but does account for increased station warming.
A station’s daily average temperature is calculated: T(avg) = [T(max) + T(min)]/2. Urban heat island (UHI)-contaminated stations have the condition where buildings, roads, culverts, bridges and the like absorb the sun’s energy during the day, and release that energy during the course of the night, causing the minimum temperature measured by sunrise to tend to increase, because the energy absorbed during the day from those artifacts of human construction and activity is retained into the night time hours. Two splendid examples of UHI-contamination are Las Cruces, NM, and Las Vegas, NV, the latter showing the increase in station temperature is caused only by the increase in minimum temperatures, while maximum temperatures seem to be decreasing.
This post only scratches the surface of the misstatements, mischaracterizations, errors and outright falsehoods being perpetuated by NCA4’s alarmist claptrap.