Global Warming – Listener’s Dissenting View: Climate One | KRWG by Bob Endlich

The data I show here demonstrates the claims by CLIMATE ONE and their parent organization, the Commonwealth Club, are refuted by data and publications in the public domain. Claims of the “Settled Science” of catastrophic warming are without foundation, if you look at the data. In science, the debate is never over and the science is never settled.

The last three minutes of the program were the most egregious.  This was the segment suggesting that the notion of catastrophic, human-caused, CO2-fueled global warming was not broadcast enough or with enough fervor.  Therefore, there should be more – both in broadcasts, and in a to-be-developed application on smart phones – which would drum in the below “truths” to listeners:

Fires, presumably wildfires and forest fires, are human-caused, from our use of fossil fuels

Tornadoes are caused by humans using fossil fuels

Hurricanes are caused by our use of fossil fuels

Droughts are caused by human use of fossil fuels.

Not in the last three minutes but an earlier passage, perhaps 35 minutes into the presentation, said that “rising tides,” (presumable any rise or acceleration in rise of sea level) was caused by human use of fossil fuels.

There was absolutely not a single fact, measurement, observation or data element quoted to support these global warming assertions.  Indeed, there could have not been, because there are no facts to support such assertions.

The purpose of this post is to present a balanced view which provides evidence to the contrary of CLIMATE ONE’s assertions.

My career was as a meteorologist, but I was also educated as a geologist, so Earth Science is my forte;  highlights of my career are appended at the bottom of this post.

Below, using Facts, Measurements, Observations and Data, I show that any human influence on global warming is so vanishingly small as to be unmeasurable.

Here are the data, and my references, to back up my statements:

Fire data

Fire data are collected and available at the National Interagency Fire Center in Boise, Idaho.

This plot shows the numbers of fires for each year in the NIFC data base, available from the NIFC web page.


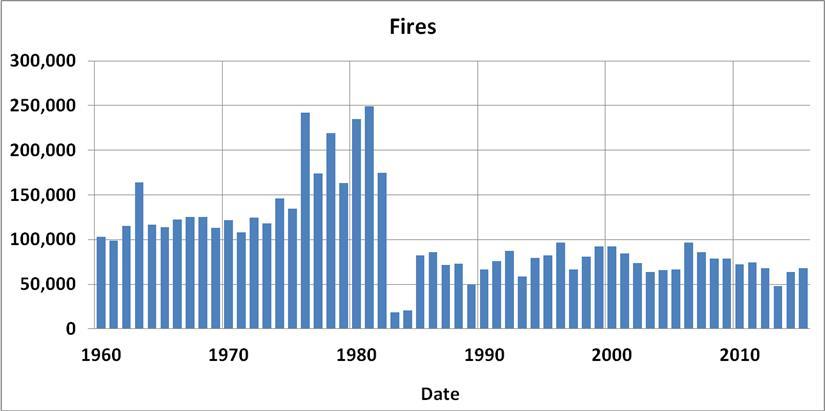
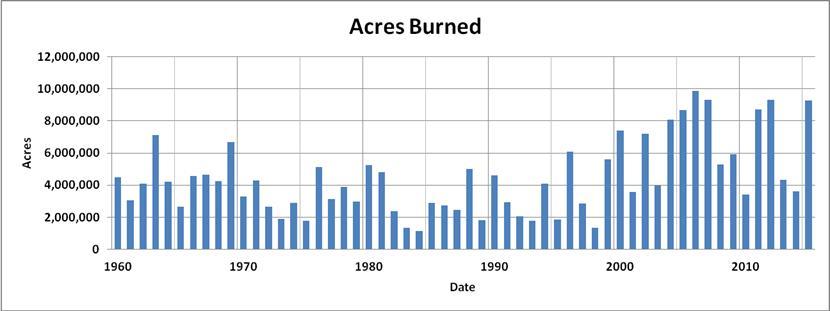
The late 20th century minimum of acres burned represents the wet years associated with the Pacific Decadal Oscillation “Warm” phase, the post-2000 increase represents the return to PDO “Cold” phase.

I downloaded the data from the NIFC web site and plotted them in Excel, a skill seemingly unknown to CLIMATE ONE.

Tornadoes

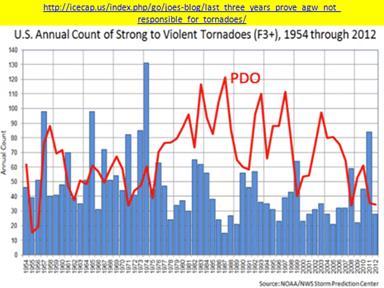
The strength of the pole to equator temperature difference determines the atmospheric baroclinicity.  Baroclinicity is a measure of the storminess of the atmosphere.  Note in the plot below, the peak in the tornado activity associated with the great Xenia, Ohio tornado outbreak of 1974.  This is the period when TIME, NEWSWEEK, and the New York Times were describing the global cooling, which had been occurring since 1940.  Global Cooling results in stronger equator to pole temperature differences, stronger baroclinicity, storm systems, and convective outbreaks, including tornadoes.

The Pacific Decadal Oscillation was discovered in the late 1990s.  It describes a change in the temperature distribution in the Pacific Ocean, the world’s largest ocean, which affects the world’s weather patterns.

When the atmosphere went into PDO-Warm,  baroclinicity decreased, and the strength of the tornadoes and their numbers decreased.   As the PDO cycle went Cold, baroclinicity increased, and more strong to severe tornadoes occurred.

The chart below shows the number of strong to violent tornadoes for each year from 1954 to 2012 as blue bars.  An index of the strength of the Pacific Decadal Oscillation is plotted in Red.  It is obvious from the chart that the Pacific Decadal Oscillation exerts a strong control on strong to severe tornado formation.

The nearly monotonic increase in the concentration of carbon dioxide has no effect.
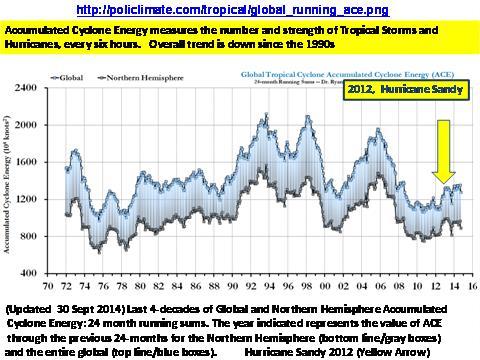
 

Hurricanes

Hurricanes and tropical storm intensities and numbers are tabulated each day of the year, and their total Accumulated Cyclone Energy is plotted by Ryan Maue, now of Weatherbell, but formerly of Florida State University.


Drought

A commonly used measure of drought is the Palmer Drought Severity Index, or PDSI.

The National Climatic Data Center’s “Climate at a Glance” page allows users to calculate and display climate data on-line.

The data for the PDSI since recordkeeping in the USA became available for such calculations are available here:

Clicking on the above link will allow you to generate, plot and view the data directly at the NCDC site: the yellow-orange bars describe the Palmer Drought Severity Index


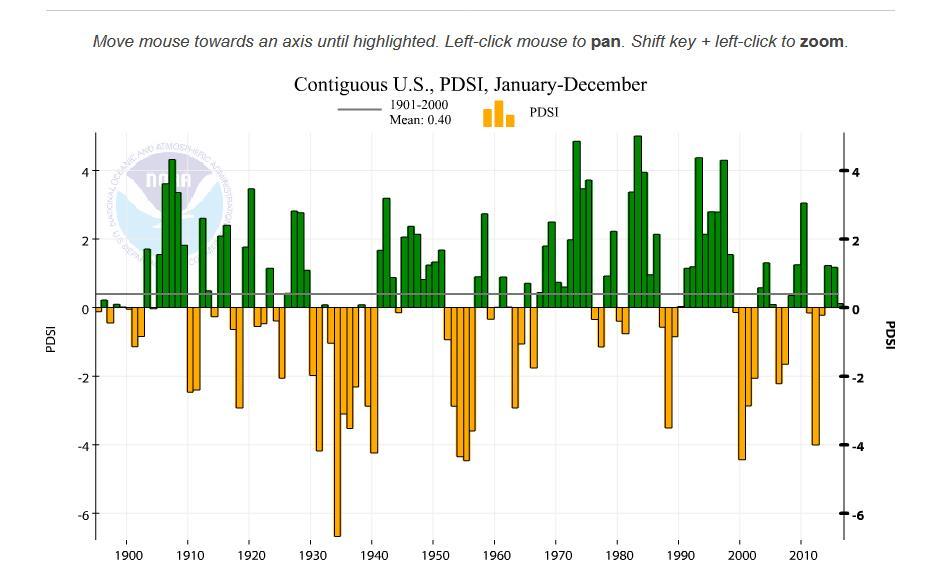
Please notice these features, some of which I have previously described:

The 1930s drought, the Dust Bowl Years, show the maximum drought. You can see the 1950s drought which hit New Mexico and Texas especially hard. The green bars show excess rainfall in the PDO warm period at the end of the 20th century.  As we have been entering PDO Cold more drought appears, but it is not as strong as the 1950s or the Dust Bowl Years.

Sea Level

Seas were higher than today in the Roman and Medieval Warm periods as described in my blog post, History Falsifies Climate Alarmist Sea Level Claims.

Sea levels fell during the Little Ice Age, and have started rising, but as seen in the above post, have not reached the heights in the not too distant historic past.

Dave Burton has a Sea Level Page here.

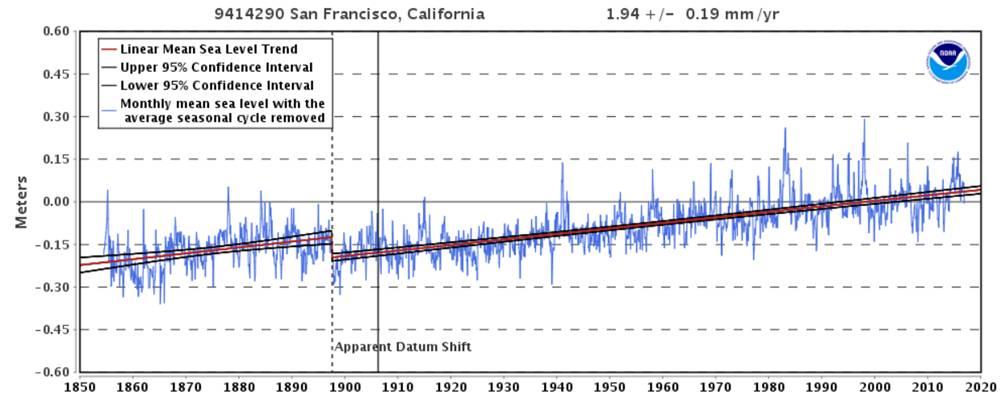
NOAA has a web page on sea level at their web page, Tides and Currents.

This is an interactive map where you click on a station and view the sea level trend.  Among the longest tide gage records is from the San Francisco station.


Also, the Battery, New York City, has a long tide gage record.

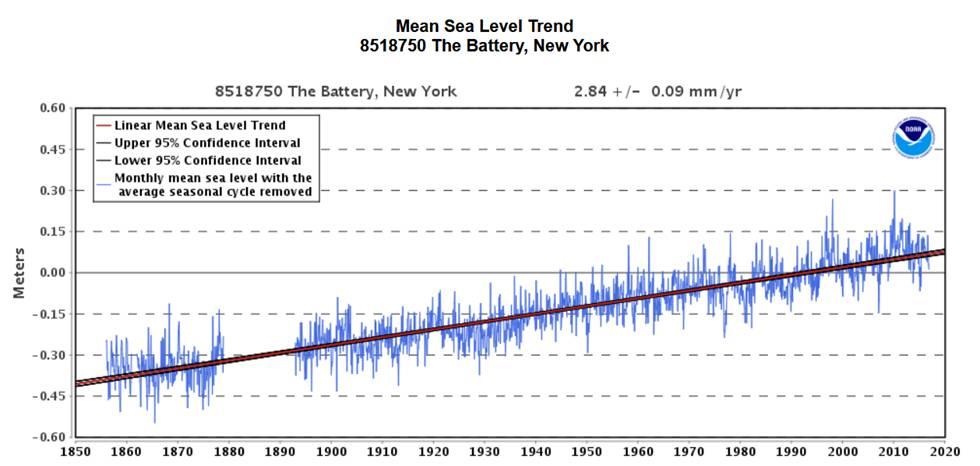
US tide gages show no acceleration of sea level since shortly before the US Civil War, when record keeping began.

These data plots falsify the notion espoused by CLIMATE ONE, that our use of fossil fuels has accelerated the rate of sea level rise.

Houston and Dean in the Journal of Coastal Research found no 20th century acceleration in the rate of sea level rise. This also falsifies the statement by the CLIMATE ONE broadcast on the Commonwealth Club on 11 and 12 March on KRWG.  The Coastal Research link is still live.

As the Southern New Mexico affiliate of NPR, KRWG’s broadcasts almost never air material which run counter to the mythical “consensus of scientists” that human use of fossil fuels and the associated increase in atmospheric carbon dioxide is directly responsible for increases in temperature of the past decades. However, science is about facts, measurements, observations and data, not consensus.

The data I show here refutes the claims by CLIMATE ONE and their parent organization, the Commonwealth Club.  Claims of the “Settled Science” of catastrophic warming are without foundation, if you look at the data.

In science, the debate is never over and the science is never settled.

The Author

Robert W. Endlich served as Weather Officer in the USAF for 21 Years. From 1984-1993 he provided toxic corridor and laser propagation support to the High Energy Laser Systems Test Facility at White Sands Missile Range. He has published in the technical literature and worked as software test engineer at New Mexico State University.

 As a Basic Meteorology student at Texas A&M University, he was elected to Chi Epsilon Pi, the national Meteorology Honor Society.  He also earned a bachelor’s degree in Geology from Rutgers University and a master’s in Meteorology from the Pennsylvania State University.

___________________________________________

Comments

  • How refreshing to see statements of fact backed up by scientific measurements and records. Claims made by climate alarmists/activists never seem to be substantiated but instead are backed up by nonsense such as the “97 percent” and “consensus,” neither of which have a place in any scientific discussion. In science, the debate is never over.


    • https://judithcurry.com/201…

      Mr. Endlich seems to be out of step with the majority of American Meteorological Association’s membership on the issue of human contribution to climate change. 5% of the AMA members who responded believe that any increase in the earth’s temperature is due to natural causes and that there will be no harm from that increase.

      •  

        As I stated above, consensus has no place in any scientific discussion. I notice you did not disagree with anything that Mr. Endlich said. He provided fully referenced factual data to back up his position. Science is not done with polls.


        • https://tamino.wordpress.co…

          There’s your answer from a respected climate scientist regarding the acceleration of sea level rise.

        • Surely you realize that Mr Endlich’s graph selections are not definitive evidence that human influence on the climate is not a serious long-term threat to the planet as it exists today.
          One example-

          https://skepticalscience.co…

          I would not tout my credentials with a professional organization that completely contradicts my own beliefs:

          https://www.ametsoc.org/ams…


          • Since you bring it up, and since you link to a propaganda site to boot, what are your credentials Ratana?


          • Each graph disproves a claim made by Climate One. Claims of a “long-term threat to the planet as it exists today” are based on climate model output. None of these projections have ever come close to the observations. The model projection contain error bounds that are even higher than the observed temperatures. It would be ludicrous to expect long term projections to be any better or even as good — not that the model results are good.

            Regarding the AMS, a lot of members resigned from the organization because of their stand on climate change, which way overstates what is known about the climate and how it is likely to change. Because of overstatements such as this, the AMS and a number of other professional societies have created a serious credibility gap with many of their past and present members.

            As to touting his credentials, Mr. Endlich didn’t tout anything associated with the AMS. His profile simply provides facts regarding his background just as his article provides facts which disprove or cast serious doubt on claims made by Climate One.
            Your example of Skeptical Science is a bad choice. They are simply a propaganda machine and should not be taken seriously as a scientific blog.


            • Since 2 of the scientific luminaries (Christy and Spencer) in the skeptical camp claim that their heavily massaged satellite data is definitive what do you say about the Trump administration’s request to reject 3 new NASA satellite projects designed to provide additional data?


              Bob Endlich > Robert Wegrzen

              First, thanks to Fred Martino for posting my concerns and to each of you for your comments. I will reply to each of you with this comment.

              American Meteorological Society

              I was a Professional dues-paying Member of the AMS from 1964 to ~2000. About 2000 I attended the Annual Meeting which was held in Phoenix, and sat in on the discussion on the posited ‘human-caused CO2-fueled global warming’ group meeting of maybe 50 people. I expected to see some serious discussions about what data sets might be used to determine whether human actions were influencing climate and how the human influence could be separated from natural cycles.   I was amused and dismayed at the group; they reminded me of 2d graders wanting to play with the 6th graders, the Big Kids, who seemingly were about to be ignored, not scientists.

              Reading the AMS Climate Change Statement, I am dismayed that this seems to be a regurgitation of the IPCC Summary for Policymakers. There is no recognition that most of the past 10,000 years, the Holocene, has been warmer than the present as seen in proxy temperature data from the Greenland Ice Sheet.

              The AMS has no recognition that there have been on the order of 12 Holocene warm periods, and this current warm period is but one of many and, by what these data say, it is not a notably strong warm period, especially when compared with the Holocene Climate Optimum, 3000 to 8000 years before the present. The wording is alarmist, and to me, deceptive.

              Examples: “Arctic sea ice extent and volume have been decreasing for the past several decades…” but in the AMS’ own Journal of Climate in 2001, we see the Arctic Sea Ice has been decreasing since the mid 1800s and the rate of decrease has been decreasing: Vinje, T. 2001. Anomalies and Trends of Sea-Ice Extent and Atmospheric Circulation in the Nordic Seas during the period 1864-1998. Journal of Climate, February 2001, 255-267.

              See the graph itself and some context in my blog post.

              Example: “…widespread melting of snow and ice and rising globally averaged sea level.” Sea levels have been rising since the end of the Wisconsin Ice age ~23,000 years ago, so this is not new news, though AMS tries to present it as so. However, as I mentioned previously in my blog piece, sea levels were higher than today in historic times as indicated from historical buildings, harbors, and accounts, from Biblical times in Iraq, the Greeks and Thermopylae, Ephesus, and Patara, from Roman ports of Ostia Antica and Portus, and the Saxon Sea Forts described in the Notitia Dignatum, a directory of the Western Roman Empire. There is geologic evidence for sea levels higher than today in Australia, Brazil, Hawaii, Key Biscayne, Florida, Central Texas Coast, South Africa and Malaysia, many, to me, important facts seemingly deliberately missing from the AMS piece. Or, is the AMS ignorant of these facts?

              The literature has descriptions of ~1000 year natural cycles, Bond Cycles, described here: Persistent solar influence on North Atlantic climate during the Holocene

              Gerard Bond; Bernd Kromer; Juerg Beer; Raimund Muscheler; et al

              Science; Dec 7, 2001; 294, 5549. You may view the Bond et al paper here.  The present warm period, which is part of natural warming, part of a Bond Cycle, is ignored by the AMS.

              Example: “Warming of the climate system now is unequivocal, according to many different kinds of evidence.” The AMS reports this like a news flash, seemingly ignorant that this has happened many times in the past 10,000 years, just as the GISP2 data show.

              Example: “Spring maximum snowpack is decreasing…” Yes, but they “conveniently” forget to tell us that the Fall snowpack is increasing.

              They also “conveniently” forget to tell us that Winter snowpack is increasing.

              I must tell you that I find these omissions deliberately deceptive.

              This is not the only deceptive publication of the AMS; there are these:

              Example: Sherwood, et al, 2008, “Robust Tropospheric Warming Revealed by Iteratively Homogenized Radiosonde Data.”  Sherwood uses a Red-Orange temperature for Zero Change, that most others use for +0.8C warming, a deliberate deception.

              Example: This Bulletin of the AMS article, The Myth of the 1970s Global Cooling Scientific Consensus.” There were cooling concerns which reached the National Academy of Sciences, National Center for Atmospheric Research, NOAA, Columbia University, University of Wisconsin, plus there were numerous articles in the New York Times, NEWSWEEK, TIME and Der Spiegel in Germany. One of the authors of this AMS article is William Connolley, “Wikipedia’s Climate Doctor,” who rewrote or deleted 5428 separate climate articles on Wikipedia: http://www.nationalpost.com/opinion/columnists/story.html?id=62e1c98e-01ed-4c55-bf3d-5078af9cb409; the author is Lawrence Solomon, who wrote the book, “The Deniers.”  

              My point is that this BAMS article is deliberately deceptive, and was written by at least one author whose history includes deliberately removing from Wikipedia any reference to the Medieval Warm Period which was, according to GISP2 and many other data, warmer than the present.

              <Here are numerous data showing the MWP warmer than today.  Yet the AMS publishes as fact materials from this world-class master of deception.>

              At one time I held the AMS in high esteem, but no longer. My views parallel those of my friend, the late Bill Gray, here.  Bill Gray mentions James Hansen about 6 paragraphs down.

              <My 2013 encounter with James Hansen is described here.>

              Sea Level Rise

              Your comments lead to SKS and a blog post by Grant Foster, AKA Tamino, who is good with math and statistics but not so good with science. Basically Foster asks us to jump through his mathematical hoops in describing sea level rise and believe him.

              I don’t, and my reasons follow:

              I believe the IPCCs measured sea level rate of rise data published here.

              Please note that these actual published data look nothing like the results published by SKS or Grant Foster, nor could they. Measurements always trump climate models, because puffery <”these predictions are based on physics, not statistics”> aside, there are no solutions to the nonlinear partial differential equations within the equations of motion of the atmosphere, which is why climate models fail.

              People ignorant of the actual measurement results, here I mean SKS and Grant Foster, will of course, come up with nonsensical results.

              The notion of anthropogenic acceleration of sea level rise was included in a presentation to the Senate by Judith Curry here. Pages 9 and 10 are the pertinent pages.

              The measured rates of sea level rise from 1910-1940 when fuel burn rates were 1 GT/year, are GREATER than the rates of sea level rise from the 1970s to 1990, when the CO2 emissions were 8 GT/year.  With data like these, it is difficult to see an anthropogenic signal in sea level rates of rise. So neither the tide gage data sets from San Francisco and the Battery, nor anywhere else, show acceleration of the rate of sea level rise.

              This is the reason for my statement in the basic post: “These data plots falsify the notion espoused by CLIMATE ONE, that our use of fossil fuels has accelerated the rate of sea level rise.”


Author: Robert Endlich

Robert W. Endlich served as Weather Officer in the USAF for 21 Years. From 1984-1993, he provided toxic corridor and laser propagation support to the High Energy Laser Systems Test Facility at White Sands Missile Range. He has published in the technical literature and worked as software test engineer. He was elected to Chi Epsilon Pi, the national Meteorology Honor Society, while a Basic Meteorology student at Texas A&M University. He has a BA degree in Geology from Rutgers University and an MS in Meteorology from the Pennsylvania State University.