
There’s no imminent climate threat to southern New Mexico’s famous chile-producing region
Robert W. Endlich
A NEWS FEATURE WITH DISTURBING MESSAGES
A recent “news feature” in Las Cruces’ Sun-News was full of gloom, portraying a picture of approaching “climate uncertainty” for New

Mexico’s beloved chile pepper crop, because of purported looming drought and increasing temperatures, with a subtext of human-caused CO2-fueled global warming. The front-page article, by Leah Romero from New Mexico in Depth, was accompanied with a foreboding graph and story, showing seemingly unending upward temperatures, copy below, with an aura of authority. After all, the data came from New Mexico’s Land Grant College, New Mexico State University, NMSU, on the south side of Las Cruces.

Since I live here and had earlier measured Las Cruces’ Urban Heat Island, I investigated the claims of the climate change the author describes,…“increased uncertainty in the future due to climate change… steadily increasing temperatures disrupt(ing) historic patterns…more dry years in the future.”
These prominent statements attempted to lend credibility to the news feature:
From New Mexico’s State Climatologist, Dr David Dubois: “ … temperatures have been increasing since the 1970s.”
From NOAA: “According to the National Oceanic and Atmospheric Administration, the average temperature in New Mexico has risen two degrees since then.”
Quoting Dubois, “…the…fingerprint of climate change…is making something a bit worse over time,” “it’s just going to keep climbing,” and, “droughts are going to be hotter.”
Author Leah Romero describing a picture of ever-decreasing availability of water in New Mexico’s largest reservoir, nearby Elephant Butte Lake, “The one thing New Mexico does not have is more water.” Romero included this below graphic, continuing the story of climate gloom and doom:

WHAT DO CORROBORATING MEASUREMENTS REVEAL?
What does examination of climate data from the region reveal? I looked at five stations from the Western Regional Climate Center, stations located near the chile-growing region of southern New Mexico with long periods of record. Four were from the US Historical Climatology Network. The fifth was the coop station at the Bosque Del Apache National Wildlife Refuge.
Actual measurements reveal a far different picture from that portrayed in the Sun-News story, and offer another picture of unrepresentative temperatures from a poorly exposed and urban heat island-contaminated measurement site, similar to those I found for the alleged record-setting temperatures from summer 2019 in Europe.
WHY START THE STORY IN 1970 WHEN WE HAVE OVER A CENTURY OF DATA?
Let’s start with cherry-picking the data to further the narrative of climate doom in this story, using 1970 as the beginning of the “temperatures have been increasing since the 1970s,” part of the story.
Why start there? Looking at Figure 3 below, from the National Center for Atmospheric Research, NCAR, offers this clue.

The Atlantic Multidecadal Oscillation is a naturally occurring temperature cycle, a periodic weather event which has been observed for some 150 years. By choosing 1970 as the starting point for the narrative of ever-increasing warmer temperatures, alarmists “conveniently” eliminate the heat and drought of the 1930s, the Dust Bowl years of the American West. The decade of the 1930s had the largest number of State extreme maximums of temperature since record-keeping started in the late 1800s.
GETTING LOST IN THE SNOW-TEL
There is another missing element from the, “average temperature in New Mexico has risen two degrees since then,” part of the story. Specifically, none of the narratives ever mention the erroneously warm temperatures that the US Department of Agriculture’s SNOTEL sites in the mountain West reported for years.
SNOTEL is the network of snow and temperature reporting stations which attempt to provide in-situ data from high in the western mountains, but the temperatures reported were in error, with a strong warm bias. This quote is from the abstract: ”extreme warming observed at higher elevations is the result of systematic artifacts and not climatic conditions.”
NO MENTION OF EL NINO
Nowhere in the story does the writer mention that periods of rainfall and drought in the US West are controlled by offshore water temperatures in the Pacific, and the dominance of El Nino Southern Oscillation, ENSO, and its 60-year long big brother, the Pacific Decadal Oscillation in controlling western states’ rainfall and drought.
Leah Romero’s storyline uses Fig 2 above and shows April snowpack declines which ended in either 2013 or 2015, the text is unclear. But about five years have passed and dramatic changes occurred, a fact missed by Romero. More importantly, two El Nino events completely changed Romero’s picture, with large amounts of rainfall, snowfall and water storage in the west and at Elephant Butte Lake.
In 2017 El Nino-fueled storms dumped such incredibly huge amounts of water in California that the Oroville Dam nearly failed, and according to the Los Angeles Times, “Large swaths of the region are on track to experience their wettest winter on record.”
In Spring of 2019, TV station KTLA in Los Angeles reported on another El Nino-fueled cold season: the massive snowfall series of events produced 188% of average snowfall. This is summarized in the graphic below. (Link works but the video does not play)

Closer, in New Mexico, in 2019 the Las Cruces Sun-News published a story on snowpack in New Mexico, extracted in Figure 5 below:

SHE COULD NOT FIND THE BANNER
Romero’s storyline mentions “it’s been a struggle this year because of insufficient water,” but Romero seems not to have actually looked at the measurements made daily at Elephant Butte Lake and available on-line. If she looked, she would have found about seven times more water than a year ago.
Perhaps even worse, on 14 May 2019 a Sun News article described 2019 as a “Banner Year” for water and water storage, so described by Dr Philip King, NMSU Professor of Civil Engineering and consultant to Elephant Butte Irrigation District, provider of agricultural water in the region.

WHAT ELSE DOES THE NARRATIVE OF THIS STORY GET WRONG?
When it comes to rainfall and temperature, almost everything reported in this “news feature” was wrong.
Let’s examine the records available from the Western Regional Climate Center, the WRCC. As mentioned above, I looked at data from four US Historical Climatology Network, USHCN, stations and one coop station that have long periods of record and are close to the chile-pepper producing areas on and near the flood plain of the Rio Grande.
Here are the climate stations with the WRCC descriptor that I used. Bosque Del Apache is the coop station and the rest are USHCN.
Station Internet Address
First, a glance at the precipitation records:


It is, in a way, amazing. Every station shows increasing rainfall over the period of record. Since the news feature in the Sun-News showed only New Mexico State University, I made that station’s plot a little larger than the other plots. Even New Mexico State University shows increasing rainfall.
To me the amazing part is that both Author Leah Romero and New Mexico State Climatologist Dr David Dubois have missed the point that over a century of data shows increasing rainfall over the entire region. The Socorro station has data going back to 1893, and the entire record shows increasing rainfall. Missing data in the first fifteen years and wild fluctuations in those early years are present. Rainfall data since 1942 for Socorro and rainfall since 1958 for Los Lunas 3 SSW are also shown in Figure 7.
The missing data in the Bosque Del Apache NWR plots for rainfall (above) and temperature (below) show graphically some of the issues in working with the data we find in real world records.
WHAT IS THE STORY OF MEASURED TEMPERATURE CHANGE?
Since the “news feature” also described a period of seemingly ever-increasing temperatures, I also plotted and examined the temperatures for these same five stations, which are presented in Figure 8 below:
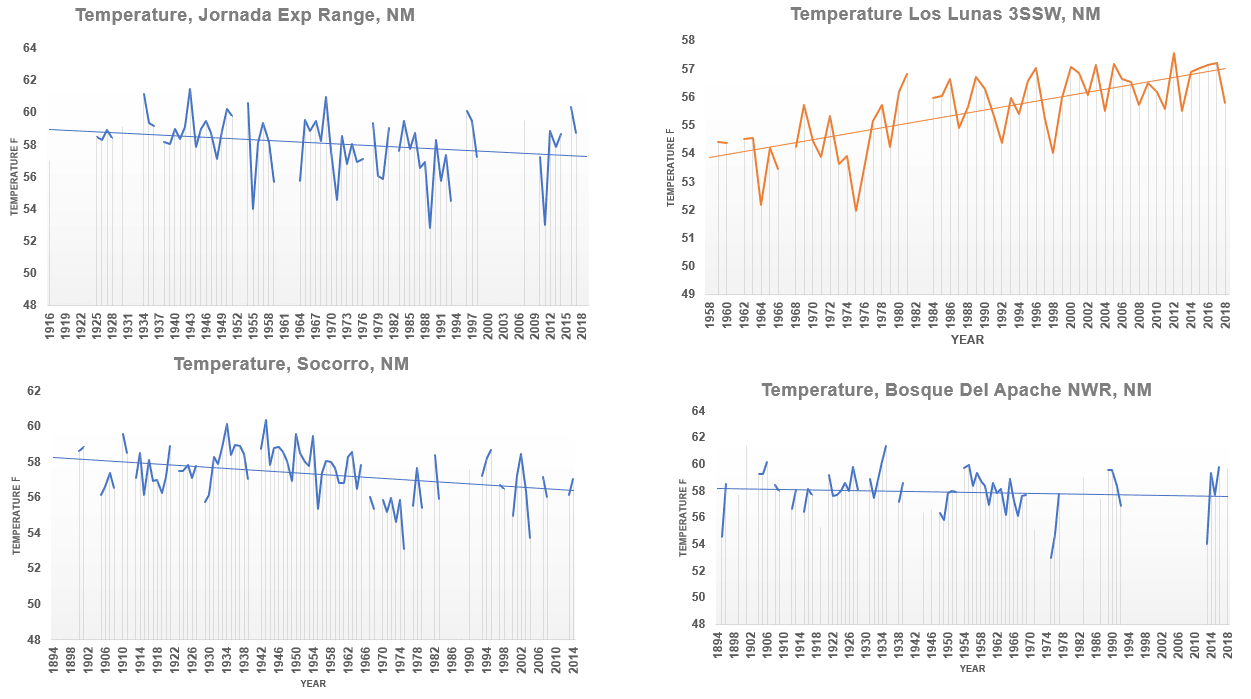
Of the five stations, three had falling temperatures, viz., Jornada Experimental Range, located 20 miles north of Las Cruces, Socorro, and Bosque Del Apache National Wildlife Refuge; all three had more than a century of data.
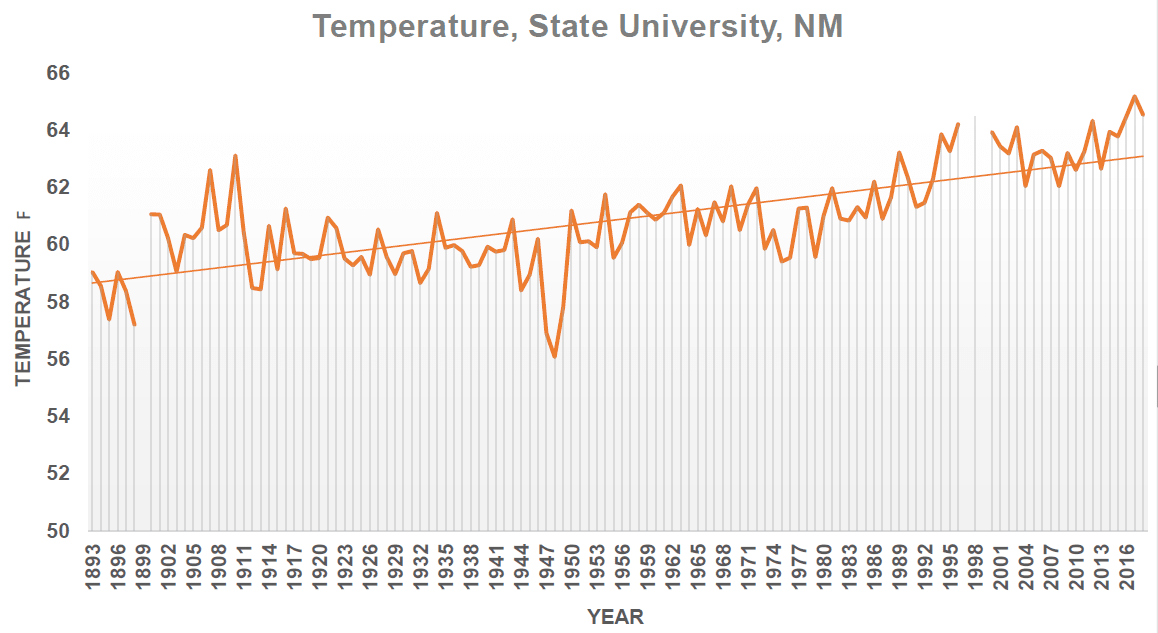
These two had rising temperatures, Los Lunas 3 SSW, and New Mexico State University.
Los Lunas 3 SSW period of record started in 1958, and the strong rising temperature tendency starts after the cold of the 1970s , when the ice age scare happened. Temperatures after 1976 mirror the great climate shift of 1976.
The only station having a century or longer period AND rising temperatures is New Mexico State University. I visited this station, photographed it, and compared the instrument exposure with the World Meteorological Organization, WMO, standards for Class One stations. Class One stations have reliable measurements, Classes Three, Four and Five have errors >1 C, >3 C and >5 C respectively.
The WMO’s published standards for Class One stations includes this statement: “Ground covered with natural and low vegetation (< 10 cm) representative of the region.”

Barefoot kids, farmers, and meteorologists know, or should know, that bare ground gets a lot hotter in direct sunlight than ground covered with vegetation, so Figure 9 above shows one prime reason why the temperature curve in Figure 1 and Leah Romero’s story is highly suspect.
The story does not stop with the unrepresentative bare ground at the station, however. When temperatures started being collected at NMSU’s predecessor school, the New Mexico College of Agriculture and Mechanic Arts around 1900, the school was three miles distant from the center of Las Cruces, the streets were dirt, and Las Cruces’ 1920 population was 3969. I could not find Las Cruces’ population records earlier than 1920, and to be more complete, New Mexico did not achieve statehood until 1912.
Las Cruces’ dirt streets were not paved until the 1950s, while Interstates I-10 and I-25, which intersect here, were not constructed in this area until the 1960s. I show how the population growth of Las Cruces rises in parallel with the rise of the temperatures (of Figure 1) by juxtaposing two graphs, from the “feature news story” and the population data, shown below.

I compare Las Cruces Urban Heat Island temperature and distance measurements with the distance from New Mexico State University’s weather and climate station to the UHI peak temperatures. Las Cruces Urban Heat Island is very well defined and repeatable from numerous transects made in 2013, Figure 11 below.

Las Cruces’ urban heat island is very well-defined and persistent. We measured the length of the UHI one-degree F increase above ambient as 12 miles long. The length of the four-degrees F above ambient was almost two miles long, 9,000 ft, using GPS and Google Maps.
The distance from the UHI transect axis on South Main Street to the NMSU weather and climate observation station is 2,800 ft. There is no guarantee that we were able to measure the exact center of the UHI with our vehicle-based measurements.
Nonetheless, the NMSU weather and climate observation station, image in Figure 9, must be very close to the center of Las Cruces’ UHI and clearly is not representative of the agricultural fields where southern New Mexico’s chile fields are located.
CONCLUSIONS
New Mexico State University’s temperature record is fatally flawed. Temperatures are taken in a bare dirt yard when the specification calls for it to be covered with low vegetation representative of the area. Las Cruces growth from fewer than 4000 in 1920 to over 100,000 today has transformed a rural station three miles outside town to close to the center of the urban heat island of a small city.
The story of ever-increasing temperatures in the chile fields of New Mexico is belied by century-long records of decreasing temperatures measured at Socorro, Bosque Del Apache and nearby Jornada Experimental Range.
Rather than hotter droughts, the region is characterized by a century of increasing precipitation in all five locations in and near the chile-producing areas of southern New Mexico.
Of the five locations, three of them, those outside urban heat island effects and having over a century of data, showed decreasing temperatures.
Two El Nino episodes since 2015 have resulted in substantial increases in water levels in Elephant Butte Reservoir. The lowest reservoir level since records began occurred on 6 August 1954, at 0.1 percent of capacity. Reservoir levels on 2 Nov 2019 were 22.1% of capacity or 221 TIMES more water than the low water of the 1950s droughts.
It would be difficult for Leah Romero’s story to be more misleading to the readership. The lack of scholarship and careful study of a subject where data are readily available is dismaying. With recent emphasis on purported climate change, the lack of knowledge of events reported in the pages of the Las Cruces Sun-News points to little oversight by editors.
The “news feature” from the 19 Sep 2019 edition of the Las Cruces Sun-News contains so many errors that it is a candidate for a Fake News award.