
By Robert W. Endlich
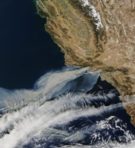
The year 2017 featured incredibly intense, damaging wildfires in California. First the Wine Country fires of October, and later, in December, the massive Thomas Fire, each destroyed hundreds of homes. The latter, in many of the affluent suburbs and enclaves northwest of Los Angeles and Hollywood. The Thomas Fire is the largest in modern California history with over 1000 structures destroyed.
California’s Governor Jerry Brown blamed human-caused CO2-fueled
global warming for this conflagration during a visit to Ventura County on 9 December, saying the drought conditions were the “new normal.” To quote the governor, “There have (historically) been very long droughts in California and we are getting some of those returning very bad, and we’re going to get them returning more often.”
But, Governor Brown is just wrong about this, as an examination of some meteorological and climate data shows:
Let’s look at the rainfall for California since measurements started, when William McKinley was US President, in the late 1800s:

Figure 1: Precipitation in California from the US Government’s Climate at a Glance web site
As we will see below, California’s rainfall is mostly in the winter, so this plot centers the 12-month rainfall in the winter months so the chart accounts for the record rainfall which fell in the 2017 winter, and almost resulted in the loss of Oroville Dam. The actual trend in the data, the blue line, shows that, contrary to Governor Brown’s contention, rainfall and snowfall in California are increasing a bit over time.
What we see below is that meteorological conditions, as they develop over the course of a year, and as they develop during the multi-year El-Nino to La Nina cycles known as ENSO, El Nino Southern Oscillation, result in the conditions which favor wildfires in California. Remember, fire is a part of nature, much to the consternation of those who disagree, and much to the dismay of those whose lives are disrupted by wildfire events such as these.
OVERVIEW OF METEOROLOGICAL CONDITIONS LEADING TO CALIFORNIA WILDFIRES
In the US, the “Sun Belt,” that portion of the Lower 48 from California extending to Florida, received that name because a feature of global circulation, the Hadley cell, causes descending air about 30 degrees north and south of the equator; the source? Rising air in the tropics as can be seen in the diagram below.

Figure 2: Diagram of large-scale atmospheric circulation patterns which shows the subtropical high pressure feature at the surface, 30 degrees latitude under the subsiding air of the Hadley Cell, see the diagram on the left edge of the figure.
While the diagram at Figure 2 shows the average position of the subtropical high, what is equally important for this story is that the position and strength of the subtropical high changes over the course of the year, with that high pressure cell getting stronger and moving further north (in the northern hemisphere) in the summer.
This feature is also called the “subtropical ridge,” and, as it strengthens and moves northward in summer, cities in the American southwest deserts, such as in New Mexico and Arizona experience a surface wind change from westerly to easterly, allowing moisture from the Gulf of Mexico to flow into those desert regions. This poleward movement of the subtropical ridge causes the North American Monsoon and the ensuing development of the summer thunderstorm season, the “monsoon season.”
A splendid example of this change is shown in the climatology of Tucson, Arizona, displayed in the figure below, where the green bars show the average monthly precipitation.

Figure 3: Climatology of Tucson, Arizona, from http://www.tucson.climatemps.com/index.php The green bars show monthly precipitation; the dramatic increase in rainfall from June to July is evidence of the onset of the monsoon / thunderstorm season immediately after the annual maximum temperatures in June. This dramatic increase in rainfall is caused by the inflow of moist southeasterly winds from the Gulf of Mexico.
In California, however, the poleward migration of the subtropical ridge diverts rain-producing storm systems poleward, to the north, resulting in an almost complete loss of rainfall in the summer. This “Mediterranean” rainfall pattern is, therefore, almost the opposite from that found in the southwest deserts. The figure below is an annual climatology of Los Angeles, California, which helps tell the story of the wildfire season in California.
Figure 4: Climatology of Los Angeles, California, from http://www.los-angeles.climatemps.com/ The green bars show the monthly rainfall which peak in winter and fall off dramatically as the subtropical ridge strengthens and moves poleward. On average there is almost no rainfall in the summer months because rain-producing storms are shunted to the north.
With this information, if we think critically, the usual situation is for vegetation to sprout and grow in wet winter months, and dry out because of the lack of summer rainfall, resulting in driest vegetation in the late summer and early fall.
This is exactly the situation described in a recent article, which mentions October as the worst month for wildfires, and quoted Max Moritz, fire expert from the University of California, “By the time you get to this season, right when you’re starting to anticipate some rain, it’s actually the most fire prone part of the year.”
CALIFORNIA’S 2017 WEATHER AS THE PRECURSOR FOR EXTENSIVE WILDFIRES
The year 2017 started with an immense burst of rain in the lowlands and snow in the mountains. By some accounts, it was the wettest winter on record, which translated to abundant moisture for the grasses and plants which abound in the semi-tropical environment.
However, that’s only one part of the story. An editorial at the end of the Wine Country fires blamed several human causes for that particular conflagration, including: “Decades of aggressive firefighting left too much fuel on the ground,” and “another man-made initiative: building more and more homes in hilly communities adjacent to brush and woodlands.”
With increased atmospheric <CO2> the grass and brush growth spurt with the generous rainfall of the winter was aided by the “plant fertilization effect.” This growth and the drying which comes with spring, summer and early autumn in these climates, set the stage for the Wine Country and Thomas Fire episodes.
AUTUMN SETS THE STAGE FOR CALIFORNIA WILDFIRES
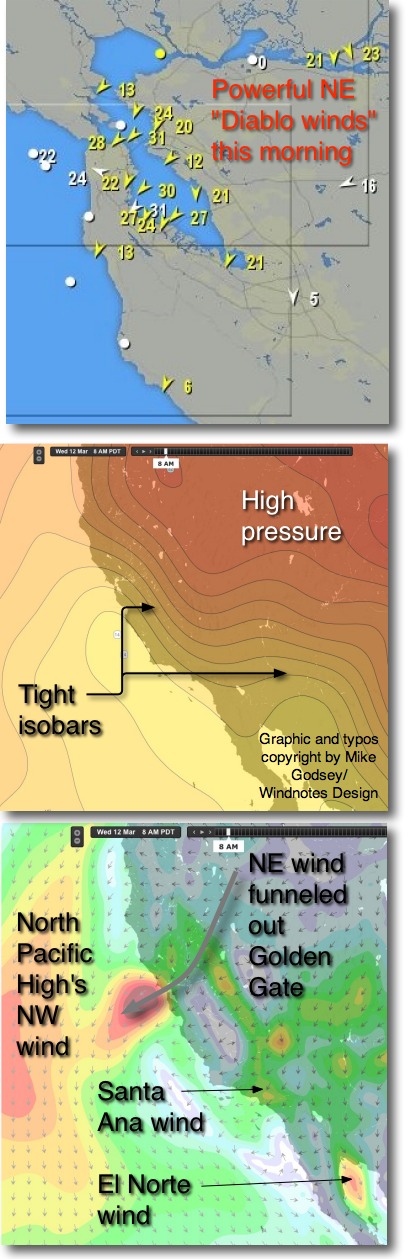
This pattern, the set-up for the autumn maximum of fire weather in California, has its own set of names to describe these conditions. In the Wine Country and San Francisco Bay region, the strong winds are called “Diablo Winds,” in Southern California, they’re called “Santa Ana Winds,” and around the Santa Barbara area they’re called “Sundowner Winds.”
As autumn sets in, it brings the first cold frontal passages, and cold air masses which build into Nevada and adjacent states. As these cold high pressure areas build into Nevada, a northeasterly pressure gradient develops over California. Because of the physics of the atmosphere, in a process called adiabatic compression, hot, dry winds develop, often quickly and dramatically. This process is shown in the next couple of graphics:

Figure 5. This graphic shows the surface pressure gradients associated with the onset of Diablo and Santa Ana winds.
A cross section of the wind flow from the high country to the Pacific coast is shown below:

Figure 6. This cross section from the Sierras to California’s Coasts shows the path of the winds and the adiabatic compression which causes the drying and heating of the air.
This situation is evident in surface weather maps and upper air charts routinely used by weather forecasters.
THE OCTOBER 2017 WINE COUNTRY WILDFIRES
Here are the weather charts which show a “textbook example” of the meteorological conditions with the onset of the Wine Country fires of October 2017. First a surface chart:

Figure 7. Surface Chart from http://weather.unisys.com/surface/sfc_map.gif for the morning of 9 October, showing a cold front moving from north to south across the USA, and cool, high pressure, the H graphics, over Nevada and Wyoming. Wind barbs show surface winds from the north and northeast over wide areas of Nevada and California, Santa Ana Winds in southern California, and Diablo Winds in northern California.
Next is an upper air sounding from a weather balloon launched from Oakland International Airport:

Figure 8: Representation of the upper air conditions at Oakland International Airport from a sounding balloon launched on 9 October 2017 at 1200 GMT, or 0500 local time. This is a “Skew-T Log P” diagram with temperatures indicated along the bottom from -40 to 40C near the earth’s surface, showing blue lines of constant temperature slanting upwards and to the right (Skewed Temperatures). Pressures are the horizontal lines on the left axis of the chart, 1000 = 1000 millibars, the pressure near sea level, 500 = 500 millibars, the pressure at which half of the mass of the atmosphere is below, and half above, about 18,000 ft. MSL. The arrangement of pressures in the vertical mimics the behavior of pressure in the atmosphere, “Log P.” Atmospheric Temperatures measured during the balloon ascent is the fat line on the right extending upward, while dew point, a measure of water content, is the other fat line towards the left, extending upward. Wind directions and speeds are plotted to the right; winds straight out of the north, at 700 millibars, about 10,000 ft., are represented by vertically-oriented wind shafts. The orange arrow shows the atmospheric levels where winds from the northeast are bringing downslope air from the Sierra Nevada Mountains to sea level, accompanied with warming and drying, the latter evidenced by the large difference between air temperature and dew point temperature. These are “classic” Diablo Wind conditions.
The Wine country fires of 2017 onset suddenly during the evening of 8 October with development of the first fierce Diablo Winds of the season; contemporary news accounts link the onset of ten fires within thirty minutes to PG&E power poles falling, many into dry trees. In one account, a Sonoma County resident said, “Trees were on fire like torches.” The Mercury News carried a story that Governor Brown had vetoed a unanimously-passed in 2016 bill to fund power line safety measures.
PATTERN CHANGE SETS THE STAGE FOR ENHANCED DRYING OF CALIFORNIA VEGETATION
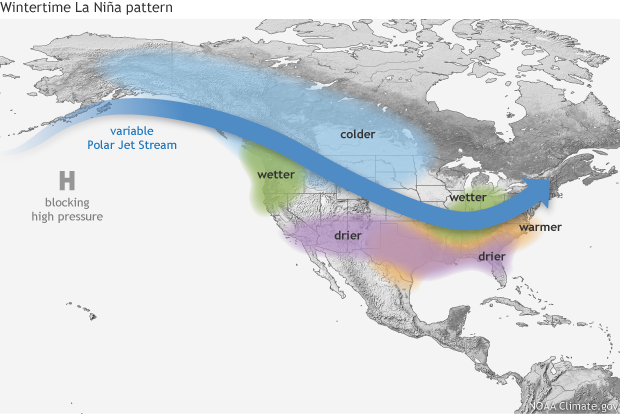
There was a significant cooling of Pacific Ocean temperatures from the peak of the 2015-16 El Nino to December 2017, such that La Nina conditions have developed in recent months. This distinct pattern shift has brought distinctly drier conditions from southern California and Arizona to Florida and South Carolina, as shown below:

Figure 9. Winter La Nina conditions result when strong trade winds and accompanying upwelling of cold waters at the coasts of North and South America cause drier than average conditions from southern California and Arizona to Florida and South Carolina.
This pattern shift is part of the evolution of temperature and precipitation change areas characteristic of the ENSO sequence of events, and clearly is not the human-caused CO2-fueled global warming effects, which Governor Brown has charged.
DECEMBER BRINGS ANOTHER ROUND OF CATASTROPHIC FIRES TO CALIFORNIA
This brings us to the devastating Thomas Fire which began on the evening of 4 December 2017, and still was not completely contained on 31 December. Behavior of this fire was controlled by a large-in-extent and long-in-duration Santa Ana Wind event, and like the previous Wine Country Fire, was dominated by high pressure over Nevada and persistent hot, dry, and strong downslope winds which occur during such meteorological conditions.
A week after the onset of the Thomas Fire, these graphics exemplify these Santa Ana weather conditions. First, the surface map

Figure 10. Surface Chart from http://weather.unisys.com/surface/sfc_map.gif for the morning of 11 December showing cold, high pressure over Nevada and Idaho.
The next chart is an upper air chart at 500 millibars for the lower 48 states which shows the weather situation a week into the Thomas Fire and at which time that fire was only 20% contained.

Figure 11. Upper Air map near 18,000 ft. on the morning of Monday 11 December at the height where the pressure has dropped to only half of what it is at sea level, and portrays measured height of the 500 millibar pressure surface above sea level. The H shows the high pressure aloft over the Nevada-Utah border, which pushed winds from the east over wide areas of California. The weak low pressure area off Baja California, the L on the map below, accentuated this offshore flow as indicated by strong winds from the east at San Diego the wind shaft and barbs immediately north of the L. This is the situation which brought downslope flow and accompanying hot, dry winds which fanned the Thomas Fire to such intensity over such a wide area.
SOME CONCLUSIONS:
So, it is the meteorological conditions which create the environment for the spread of such fires. This year’s changeover from wet El Nino to dry La Nina conditions played a significant part in the atmospheric set-up for the 2017 fires. In Australia, they have adopted a policy of fuel reduction actions as an accepted practice in fire management, not so in the USA where there is considerable conflict on this.
Environmental regulations associated with the ill-fated attempts to help the Spotted Owl have eliminated logging and clearing in the Mountain West with catastrophic results, and special legislation has been drafted to begin to address this problem; it is uncertain whether timber harvesting and or fuel reduction strategies can address the fuel excesses which exacerbate these conditions.
Robert W. Endlich served as Weather Officer in the USAF for 21 Years. From 1984-1993 he provided toxic corridor and laser propagation support to the High Energy Laser Systems Test Facility at White Sands Missile Range. He has published in the technical literature and worked as software test engineer at New Mexico State University.
He was elected to Chi Epsilon Pi, the national Meteorology Honor Society, while an Air Force Basic Meteorology student at Texas A&M University. He has a bachelor’s degree in Geology from Rutgers University and a master’s in Meteorology from the Pennsylvania State University.