
Robert W. Endlich
Five Impossible-to-believe topics fed to us by the alarmists: A 2019 report: Climate is in Crisis, 100% renewable electricity is possible, Hurricane Dorian was made stronger by our use of fossil fuels, Hurricane Michael was Category 5 at landfall, and human-caused CO2-fueled global warming is a coming catastrophe. This post summarizes my November 2019 presentation to the Cruces Atmospheric Sciences Forum, CASF.
[This is a corrected version of this post edited by the author on 4 December 2022. Ed.]
THE CLIMATE CRISIS TOWN HALL
On 4 Sep 2019 CNN presented a televised town hall meeting where 2020 Democrat presidential candidates discussed a purported human-caused,  CO2-fueled climate crisis; Inside Climate News reported on the event. I focus on three elements of that report, encapsulated in these quotes:
“There was none of the debate over science that has dominated U.S. political discussions and strangled action in recent years.”
“Most of the sparring was over what would they do to hold the fossil fuel industry accountable, how far they would go to change American lifestyles, and how would they marshal the money and political support.”
…and
“Instead, candidates focused on how they would navigate a transition to what all agreed should be 100 percent clean energy by mid-century.”
First is the false notion that there has been a “debate over science” that has “dominated U.S. political discussion in recent years.”
If ever there was a statement or alleged fact from a clueless reporter or media organization, it’s this one: that there’s been a debate. There has been no debate. Here are some specific examples of where climate alarmists have REFUSED to debate:
The Heartland Institute sponsors International Climate Change Conferences; I’ve attended many since 2011. The Conference presentations are on-line, here or by internet search using the terms <Heartland climate conference video>.
Heartland reached out to five prominent climate alarmists to hold a climate debate, moderated by TV’s John Stossel, in New York City on 23 Sep 2019, the day of the “Climate Summit” at the United Nations. Not even one accepted the offer.
Stossel had a 28 Mar 2013 show on Fox Business Channel when Dr. Roy Spencer, University of Alabama, Huntsville, and expert on satellite measurements of atmospheric temperatures, was being interviewed. NASA’s Dr. Gavin Schmidt, climate alarmist and alleged climate expert was on set, but Schmidt refused to be at the interview table with Spencer, and actually ran away from debating Spencer.
On 27 Aug 2018 Stossel invited the Union of Concerned Scientists to come on broadcast for a TV debate, but they refused.
Locally, New Mexico State Climatologist Dr David Dubois and then-NMSU professor Connie Falk challenged climate skeptics including myself to a debate; I engaged them, but they soon backed out of that challenge. I presented on my interactions with them to our nascent CASF on 17 Nov 2012.
The above seem emblematic of the Climate Alarmist position: “the science is settled” and, “we need to be taking action, not debating.” Their position is so weak that they refuse to engage. They present propaganda, they demand money from your wallet to fund their friends’ subsidized projects, and they know neither the actual science, nor the scientific method. They only hide in the crowd of the so-called “consensus.”
Here’s the next Inside Climate News comment deserving scrutiny because of the plain stupidity of the premise:
“Most of the sparring was over what would they do to hold the fossil fuel industry accountable, how far they would go to change American lifestyles, and how would they marshal the money and political support.”
The kindest words I have to say are that the writer and editor must have been in other countries when Superstorm Sandy hit the Tri-state areas of New York, New Jersey and Connecticut in 2012. A less kind comment would be to say that these individuals were either hiding under a rock or had not developed a modicum of critical thinking skills prior to joining Inside Climate News.
DON’T THEY REMEMBER WHAT HAPPENS TO SOCIETY WHEN BUYING GASOLINE BECOMES A PROBLEM IN PEOPLES’ LIVES?
I vividly recall the gasoline supply shock of 1973-1974, when OPEC embargoed oil sales to much of the Western world. It happened again with the gasoline supply shock of 1979, after the Iranian Revolution, with the interruption of Iranian oil. In both cases, the interruptions in supply had a profound and adverse effect on tens of millions of US citizens.
The 1973 OPEC oil embargo was a direct result of the 1973 Yom Kippur War between Israel and the Arab States; it quadrupled the wholesale price of oil and gasoline sales at the pump. My presentation to the Cruces Atmospheric Sciences Forum shows many examples of consumers waiting hours in long lines of cars for gasoline, among the most graphic is Figure 1 below, from 1973-74, characteristic of the situation.

A similar situation also happened in 1979, this time caused by the Iranian Revolution; after the long lines at the pump dissipated, the after-effects resulted in an “economic recession in the United States.”
Much closer to the present, the widespread power outages in the wake of Superstorm Sandy, for instance, in New Jersey, again resulted in consumers being forced to stand in long lines to purchase gasoline.
The notion that the Democrat candidates could or can “hold the fossil fuel industry accountable” for the demand of the public for motor fuels, and other consumer goods made possible by our use of inexpensive and readily available fuels, including for leisure and vacation travel, is an example of wishful thinking that politicians can change the laws of supply and demand. That humans find it economically, professionally, and personally advantageous to use motor vehicles as an aid to pursue employment, living standards, low costs of food, clothing and shelter is, or should be, self-obvious.
The notion that there is political will to readily change the ability of US citizens to live in areas of choice and pursue employment, travel, and leisure activities of choice, activities dependent on the use of inexpensive fossil fuels, is laughable.
In states like New Mexico where so much economic activity is dependent on the hospitality industry, a policy to restrict or constrict fuel supplies would also restrict vacation and leisure travel. This would cause disruption and hardship to many small business owners and their employees.
These lifestyle choices are now readily available to citizens of much of the Western World, and now, much of East Asia, Australia, New Zealand, and Latin America (less Venezuela, at the moment).
Indeed, a recent post notes that in both the developing world and the developed nations the use of fossil fuels has increased in the last decade, by over 18%.
The third notion espoused by Inside Climate News was,
“Instead, candidates focused on how they would navigate a transition to what all agreed should be 100 percent clean energy by mid-century.”
THE IMPOSSIBILITY OF 100 PER CENT RENEWABLE ENERGY
This false notion, replacing fossil fuels with renewables, was investigated by Google from 2007-2011 in project “RE<C,” short for “Renewable Energy to cost Less than Coal.” The two Google engineers, Ross Konigstein and Richard Fork presented the results of their endeavor, to provide reliable renewable energy for Google’s server farms, in the IEEE Spectrum in 2014.
They concluded the cost of manufacturing components of the renewable power facilities exceeded the cost of the total recoverable energy – renewable facilities could never produce enough energy to balance the budget of what was consumed in their construction. In other words, negative return on investment.
I paraphrase,
“Even if we electrified all transport, industry, heating, etc., so much renewable generation and balancing/storage equipment would be needed to power it, that astronomical new requirements for steel, concrete, copper, glass, carbon fiber, neodymium, shipping, haulage, etc. would appear. All these consume mammoth amounts of energy: far from achieving massive energy savings, which most plans for a renewables future rely on implicitly, we’d wind up needing far more energy — even more vast renewables farms – and even more materials and energy to make and maintain them.”
They even considered innovative technologies: self-assembling wind turbine towers, drilling systems for geothermal energy, and solar thermal power systems, which capture the sun’s energy as heat.
But by 2011, the company decided that RE<C was not on track to meet its target and shut down the project.
In another initiative down this same road, Georgetown, Texas changed its electric utility composition to become “powered by 100% renewable energy.” An important component of this was, “(to buy) more electricity than they could use almost any day of the year.” The city’s policymakers had to buy far more wind and solar energy because those sources are so unreliable.
Here is how Forbes described the inevitable intermittency problem of calm days, and of nights, when the sun does not shine:
“…on days with high electric demand with little wind generation, the city may fall short of power, but, because it’s hooked up to the larger Texas grid, reliable power produced by natural gas, coal or even nuclear plants fill the gap and keep the lights on.”
An analysis:
Charles McConnell, executive director of the Energy and Environment Initiative at Rice University, told the Austin American-Statesman in 2017,
“It’s not kind of misleading, it’s very misleading, and it is for political gain.”
Here in Las Cruces, none of this makes any difference to the City Council. In 2018, Council decided to help save the earth by conversion to renewable energy of the City Government according to this schedule: 25% by 2022, 50% by 2030, and 100% by 2050.
Outside specialized circumstances, perhaps wind farms on remote tropical islands in the trade winds, it is clearly impossible to support industrial scale electrical consumer demand using wind and solar production facilities.
HISTORY INTERRUPTS CLIMATE ALARMISTS’ CLAIMS
The Guardian’s US edition carried this piece, by climate alarmists Michael Mann and Andrew Dessler, claiming we’re in “Climate Crisis” and that CO2-driven warming caused warmer ocean temperatures that allowed 2019’s Hurricane Dorian to achieve “strongest sustained peak winds east of Florida.”
Not so fast, fellows. It is a fact that water’s absorption of sunlight, not more supposed infrared energy from increases in CO2 emissions, is the process which heats sea water, so you’re immediately wrong on the facts.
And this inconvenient truth: we have records of the Great Hurricane of 1780 and an analysis of Cuban Meteorologist Jose’ Carlos Millas that surface winds over 200 mph devastated Barbados, leaving no trees there during that hurricane. Winds carried heavy cannons aloft 100 ft, according to an on-scene report by British Admiral George Brydges Rodney. This happened in 1780, when, according to the Carbon Dioxide Information and Analysis Center (CDIAC), CO2 concentrations were 279 parts per million, compared with about 412 PPM today.
NOTE: Historic <CO2> used to be easy to find when those data were archived at CDIAC, when it was part of Oak Ridge National Lab. I downloaded the data into an Excel spread sheet in 2018, these data are from that spread sheet.
Reorganizations have taken place and internet search now returns https://cdiac.ess-dive.lbl.gov/ which is now managed by Lawrence Berkeley National Lab. Search results there now center on emissions data rather than historic concentrations. The best I could find in 30 minutes of search for a current reference is from a course at Penn State .
Alarmists Mann and Dessler attempt to buttress their arguments by citing 2018’s Hurricane Michael as a Category 5 hurricane at landfall, so let’s look at the story there.
NOAA CLAIMS THAT 2018’s HURRICANE MICHAEL WAS CATEGORY FIVE
The Saffir-Simpson scale of hurricane intensity evolved out of work done by civil engineer Herbert Saffir in the early 1970s, relating hurricane intensity to the damage done by hurricanes on man-made structures: wind effects on buildings. Definition: “The Saffir–Simpson hurricane wind scale is based on the highest average wind over a one-minute time span,” and necessarily refers to surface winds.

As Hurricane Michael approached Florida, I watched the satellite, radar, and some of the surface observations, and as the storm passed, I read Tony Heller’s skepticism of the early claims of very strong winds, approaching Category Five, when surface observations, TV, and video coverage showed measured winds at the time were nowhere near that intensity.
On 17 May 2019, NOAA released their report that upgraded Hurricane Michael to Category Five, analyzed here to determine how they were able to claim that Hurricane Michael reached Category Five strength. The mainstream media expressed not the slightest curiosity when NOAA’s determination was published; this report from NPR is probably as representative as any.
My early skepticism has been borne out.
Spoiler alert!
They tortured the data to achieve this result.
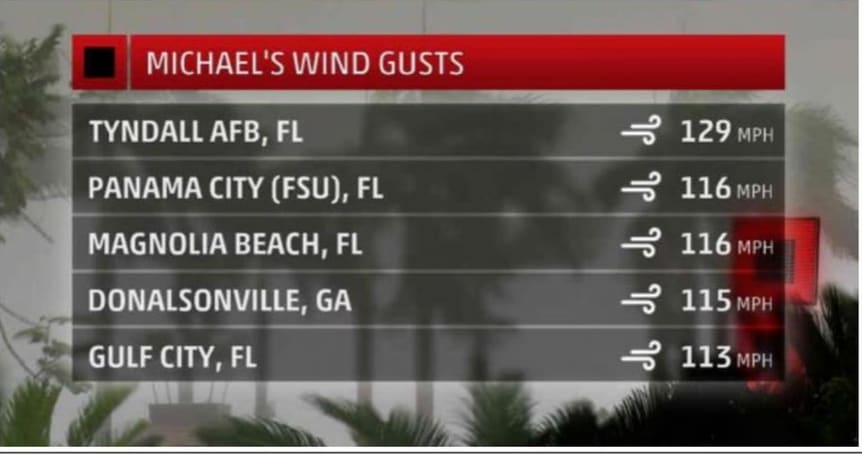
Much of NOAA’s report consists of data tables detailing observations of different types as Michael passed different locations; data elements included location, time, surface pressure, surface wind speeds, sustained and peak gusts, storm total rainfall, and others.
The most representative observations for determining peak surface winds at landfall come from Tyndall AFB, Florida, on 10 October 2018. According to NOAA’s report, the sustained surface winds measured 10 meters above ground, standard height, near the runway at 1712 Greenwich Mean Time were 75 knots gust to 121 knots.
The Saffir-Simpson scale for Category One is 64-82 knots, so the highest measured average winds were in the middle of the Category One.
Figure 4 below is extracted from page 4 of NOAA’s report on Hurricane Michael, the winds and pressure section. My highlights, in red and yellow, describe and point to the mathematical gymnastics NOAA used to justify the adjustment of the measured Category One speeds at Tyndall AFB to the Category Five which appears in the report.
Please examine the NOAA text.
NOAA blithely takes aircraft-measured winds at 700 millibars, about 8,000 ft MSL in the hurricane, and adjusts them down to the surface…
But wait! They found other winds in the eyewall a little stronger…and used them in the “standard NHC flight level to surface adjustments.”
One of the instruments carried by the NOAA P-3 and the US Air Force Reserve WC-130J hurricane reconnaissance aircraft is the Stepped Frequency Microwave Radiometer (SFMR), which passively measures the microwave radiation emitted from the water surface, and, through measurement of the diffusion of this radiation, diffusion caused by the strong hurricane winds over the water, they estimate surface wind speed from the aircraft.
Unfortunately, neither the winds measured in the aircraft at flight level nor the SFMR directly measure one-minute sustained surface winds. Further the NOAA report indicates the SFMR has a 10-second time base not the one-minute average needed for Saffir-Simpson characterizations.

The basis for NOAA’s claim that Hurricane Michael was a Category Five storm at landfall is the “adjustment” upward of the 10-meter surface wind at Tyndall AFB, from 75 knots to at least 137 knots, a 62-knot increase by bringing 8,000 ft winds down to the surface, almost completely ignoring the frictional effects of the surface itself.
These “adjustments” are difficult for me to accept for these two reasons:
One: frictional effects of the surface are so important that hurricanes immediately lose peak intensities when they go over land, with more surface friction than over the sea, and
Two: the 10-second time base of the SFMR is closer to the duration of wind gusts than one-minute average winds, the basis for the categorizations in the Saffir-Simpson scale.
Adjustments such as these bring new meaning to the phrase, “political science.”
The presentation graphics contain an examination of the metadata for Tyndall AFB’s two anemometers, the 10-meter-high runway anemometer, and Florida Coastal Management Program’s (FCMP) 15-meter high T3 anemometer. In addition, there is another 15-meter high FCMP tower, T2, at Beacon Hill, which is closer to Mexico Beach, FL.
I entered the location metadata from these anemometers into Google Maps to find the on-the-ground location associated with these measurements.
The location of the Beacon Hill FCMP T3 anemometer plots some 1000 ft offshore in the Gulf of Mexico, which is about a mile and a half from the location of Beacon Hill, FL, 32456, onshore near US Highway 98, the main highway along the Florida Panhandle Gulf of Mexico coast.
The location of the Tyndall AFB FCMP T2 anemometer plots 4 ½ miles southeast of Tyndall AFB’S Louisiana Boulevard crossing of US Highway 98, along US 98, and then 700 ft in the direction of the Gulf of Mexico.
The obvious metadata location errors of the anemometers having the highest surface winds during the landfall of Hurricane Michael does not provide much assurance as to the quality of other data in the report.
HURRICANE HISTORY SHOWS NO CO2 EFFECT
Judith Curry is among those scientists skeptical of the “more CO2 means more and stronger hurricanes,” theme of alarmists of the ilk of Mann and Dessler in the Guardian opinion piece.
One figure of merit which sheds light on this is the frequency of hurricanes and major hurricanes, as analyzed by Ryan Maue, and given in Figure 5 below:

The slow rise in major hurricane frequency over this time domain might be explained by the study of Chris Landsea, below.
Given the improvements in satellite, radar, and weather reconnaissance over the past 70 or so years, National Hurricane Center forecaster and scientist Chris Landsea studied the chances that Category Five hurricanes at mid-20th-century would have been counted as Category Five given the technologies of the time.
He concluded,
“It is found that likely only 2 of these 10—both Category 5 land-falling hurricanes—would have been recorded as Category 5 hurricanes if they had occurred during the late-1940s period.”
“…results suggest that intensity estimates for extreme tropical cyclones prior to the satellite era are unreliable for trend and variability analysis.”
So, given the improvements in satellite, radar (when huricanes are within radar range) and aerial reconnaissance, the probability of detecting major storms, including Category Five storms, has increased over time.
Another figure of merit, Accumulated Cyclone Energy (ACE), also published by Ryan Maue, is presented in Figure 6 below. ACE is defined as the square of the maximum wind, summed over each tropical storm or hurricane extant over the globe, with the process repeated every six hours over the time domain of the time series. ACE is derived from the definition of kinetic energy, mV2 .
Data for the trailing 24 months are plotted monthly.
The data show no trend. There are multidecadal and interdecadal fluctuations. There clearly is no relation to the monotonic increases in <CO2> over the time domain of the data.

HOW CAN WE THINK THAT CO2 IS CAUSING WARMING, WHEN NOT LONG AGO IT WAS WARMER WITH A LOT LESS CO2 IN THE AIR?
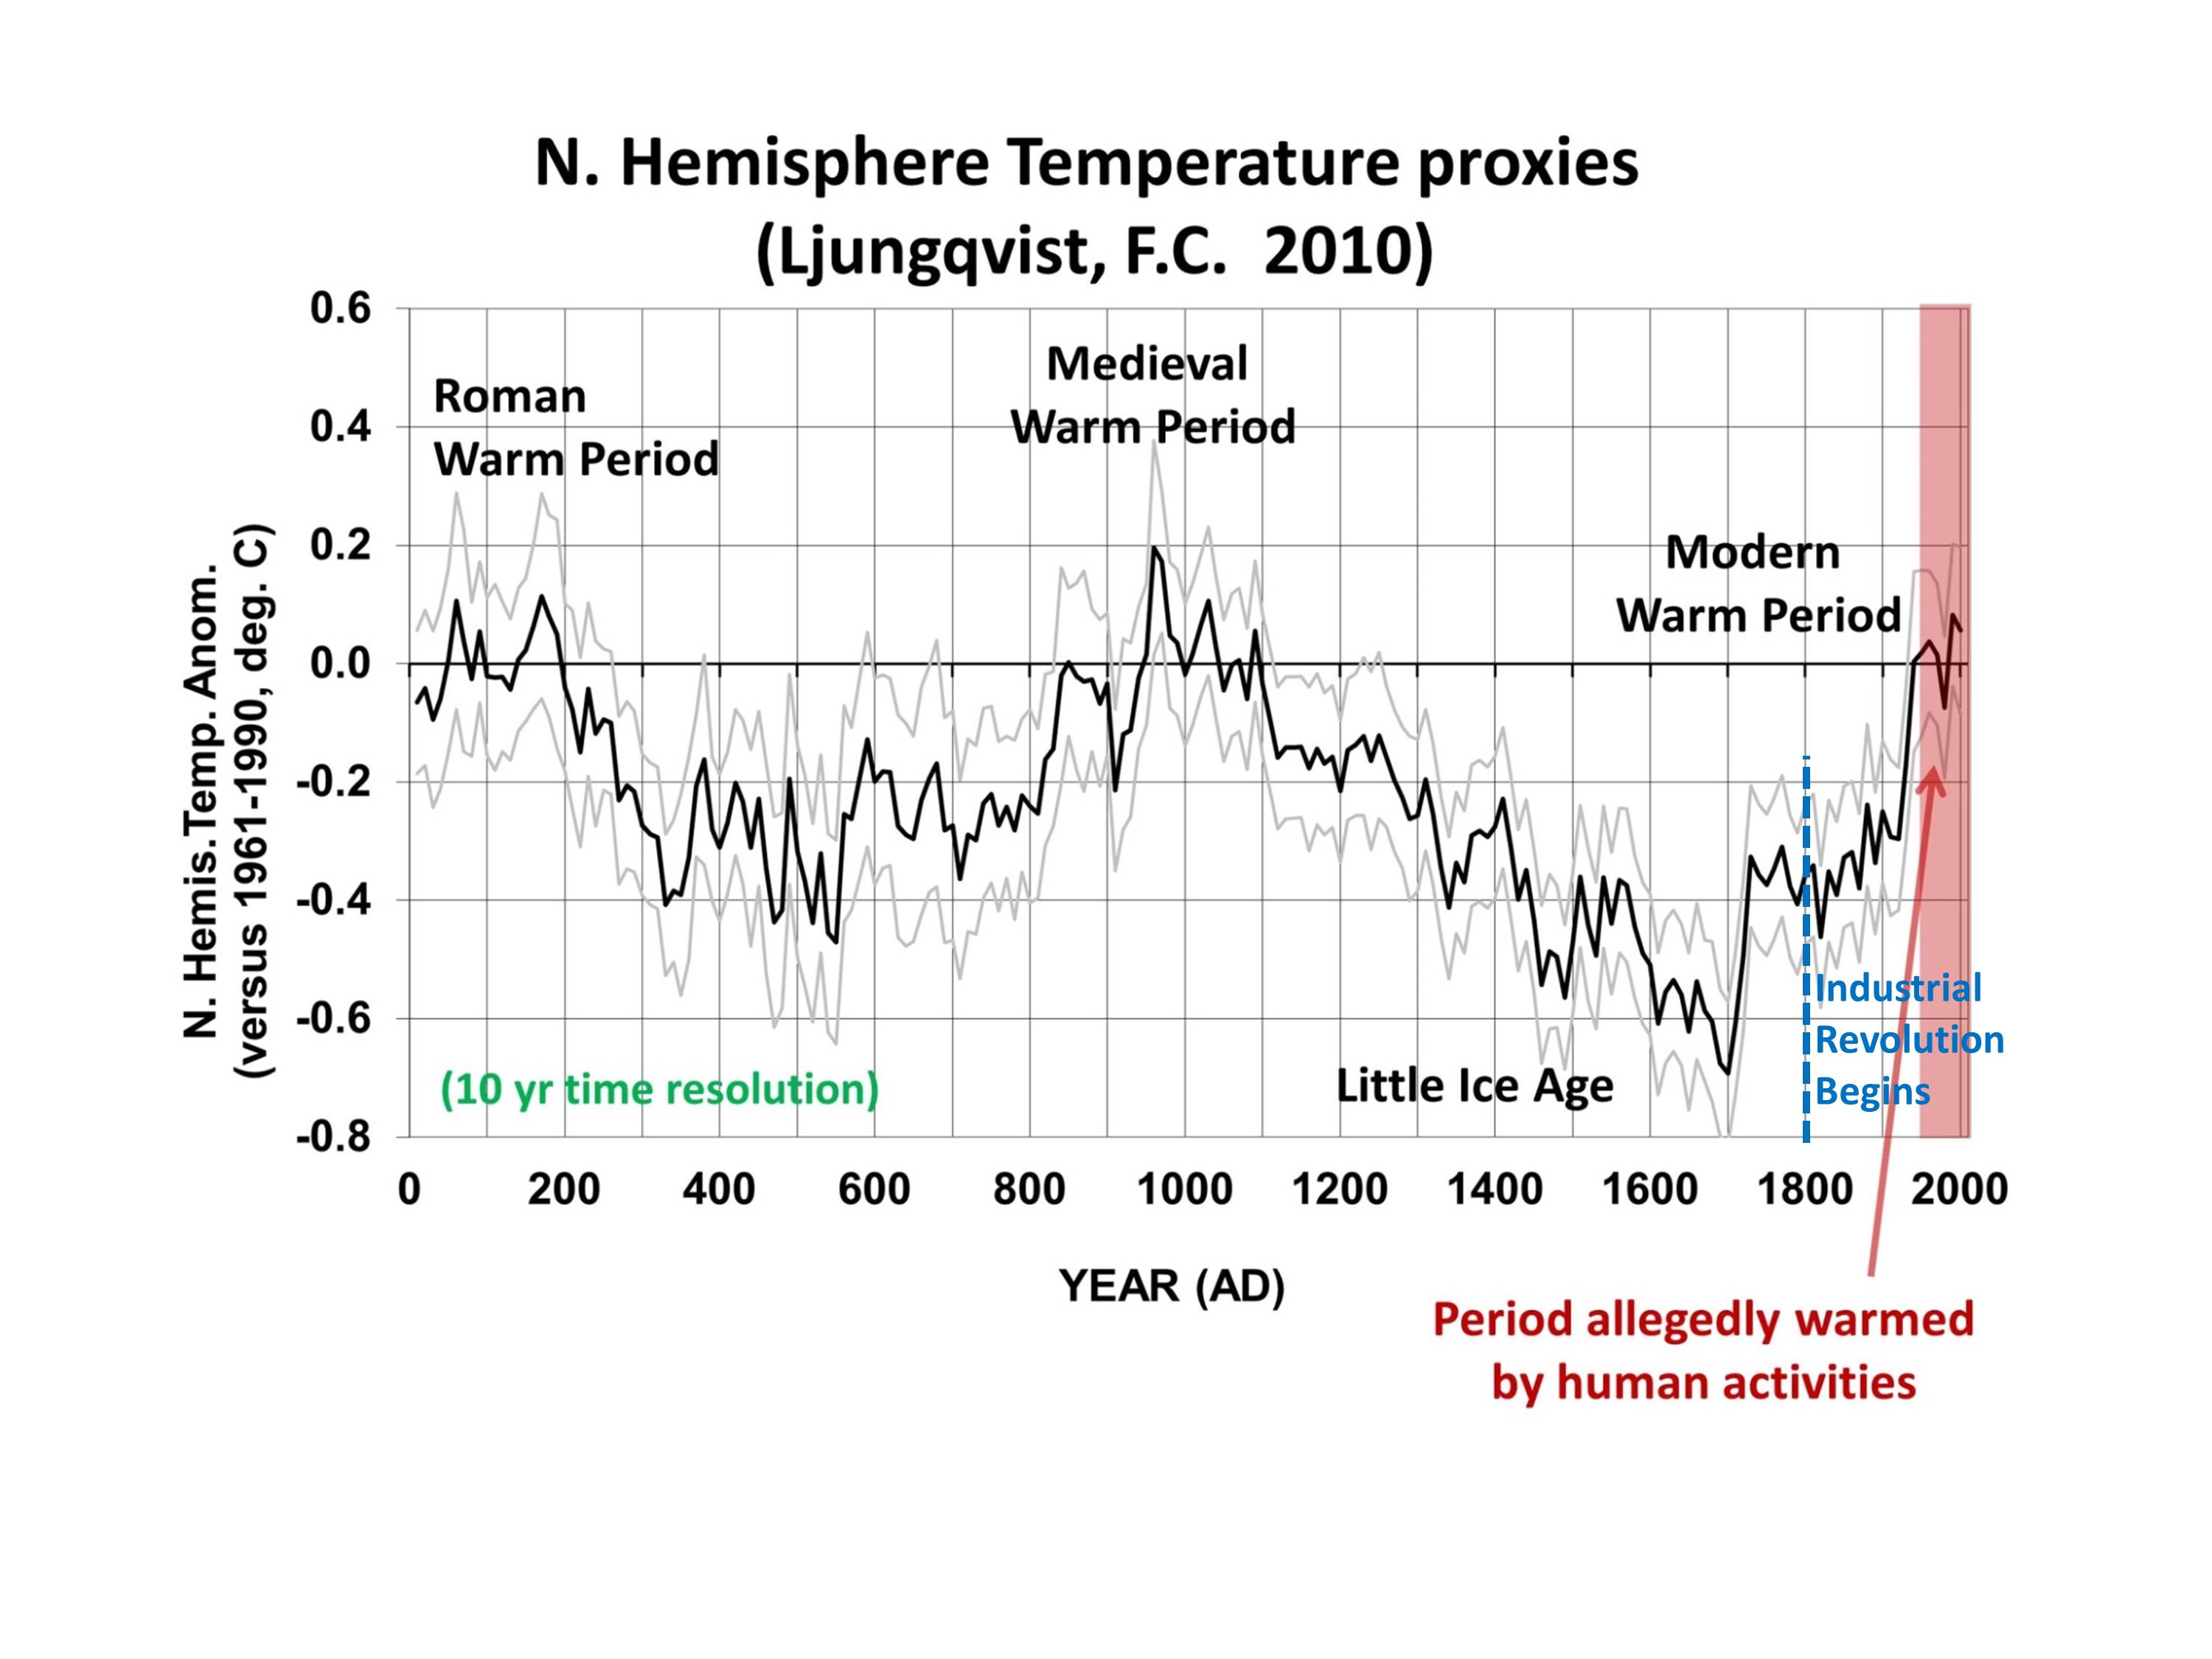
One way I use to discredit the “scientific consensus” drivel peddled by the Intergovernmental Panel on Climate Change (IPCC), the notion that use of fossil fuels and the subsequent increase of <CO2> is causing climate catastrophe, is to use proxy data which shows climate in recent history was warmer, and in many cases much warmer than the present temperature, with a lot less CO2 in the air than at present.
Further, the alarmists never mention the thousand-year or so cycles of temperature which have been documented in the literature, which we call Bond Cycles.
During the presentation, I showed many examples of these, so will post only one here, Figure 7 below, from Roy Spencer’s blog, but which uses a northern hemisphere temperature multiproxy reconstruction from Ljungqvist:

THE CLIMATE PROBLEM IS COLD, NOT HEAT.
In November, 2018, the UK Daily Mail published a feature story, “Why 536 AD was the Worst Year to be Alive.” Based on research from a Harvard University professor, from the article,
“Scientists say a mysterious fog that blocked out the sun causing crop failures and widespread famine was the worst global disaster in history.”
This occurred during the so-called Dark Ages, and from reports at the time, it was apparent that the source was volcanic activity.
Among the adverse effects described were,
“snowfall in China, continental-scale crop failure and extreme drought and famine throughout most of the northern hemisphere.”
In August, 2019, National Geographic published a story that the source of the 536 AD volcanic activity had been found; it was the Ilopango volcanic complex in El Salvador. The now-placid Lake Ilopango was the source of the water in the ground, and when magma rose in the volcano, the water energetically expanded into steam, causing a series of great explosions, the source of the volcanic clouds which spread over wide swaths of the Northern Hemisphere.
Repeated eruptions in 539 and 540 continued the climate catastrophe, so the decade 536-545 AD was the coldest of the previous 2000 years and the source of many deaths incurred during the Dark Ages.

National Geographic, one of my favorites as a youngster, has joined the alarmist Mainstream Media in the great CO2 climate delusion. National Geographic has published on the excavation of Ostia Antica, the port of Rome, the very excavation of the then-extant mud and muck proves sea levels were significantly higher during the time of the Roman Empire. Yet National Geographic claims today’s sea level rise is caused by our use of fossil fuels.
If you look at the data, you will find that sea level is a dynamic property of Earth, and much of the alleged rise of sea level is caused by ground subsidence, a result of ground water pumping.
In my opinion, this article on the Ilopango Volcano is another example of National Geographic stepping on its own shoelaces. In this article they inadvertently show that the climate threat is cold and it’s plant-killing famines, not CO2-caused warming.
CONCLUSIONS
Critical examination of the alleged climate crisis, or looming climate catastrophe, finds no truth in the allegations. It was a lot warmer in the historic past with a lot less CO2 in the air than is present today.
The notion that political people can impose restrictions on readily available and inexpensive fuels without disruption of societies is belied by recent events. In recent decades, life expectancies have risen as the use of fossil fuels have made human lives less susceptible to weather-induced hardships.
History shows that it is cold-induced drought and famine that caused death and misery of the Dark Ages.
Those without critical thought capabilities seemingly endanger the fossil-fueled prosperous societies we live in today.