
The Fifth National Climate Assessment, NCA5: It is Full of Bogus Claims
Robert W. Endlich
INTRODUCTION:
On 14 November 2023 the office of President Biden released a video of him praising the publication of the Fifth National Climate Assessment, a report required every four years by the Global Change Research Act of 1990. Some of the graphics in Biden’s video proclaim, “Historic Climate Action,” a daft, in my opinion, notion that humans, led by the population of the United States, through supposedly legal (Congressional), Administrative, Executive and Judicial actions, can control the temperature of the earth, the level of the sea, and the worst effects of adverse weather.
Yeah, sure…
Perhaps I have more direct operational experience in human ability and inability in this subject area than almost anyone else writing on this topic since I directly was involved both in operational cloud seeding over Laos during the Vietnam War, and in analyzing the rainfall enhancement, by producing and improving rainfall analyses for the Joint Chiefs of Staff on a daily basis, using operational hourly weather radar reports.
In any event, the lead graphic on the Fifth National Climate Assessment, from now on, ‘NCA5,’ states it (the report) should be trusted by readers at least in part because of
“external peer review by a panel of experts established by the National Academies of Sciences, Engineering, and Medicine.”
DON’T TRUST THESE ALLEGED EXPERTS
The National Academies clearly ARE NOT to be trusted in this subject area!
Why? Let me explain why…
On 16 Aug 2019, I stumbled upon the National Academies’ web site on Climate, studied it, copied, and saved pertinent information extant on that date, information which went into my 15 Dec 2023 presentation and graphics, slides 12-17.
I contend that the National Academies are totally ignorant of climate history, ignorance which shows their incompetence in this subject area.
A most compelling display of their ignorance is shown, at least to me, in Figure 1, below.
The National Academies stated then,
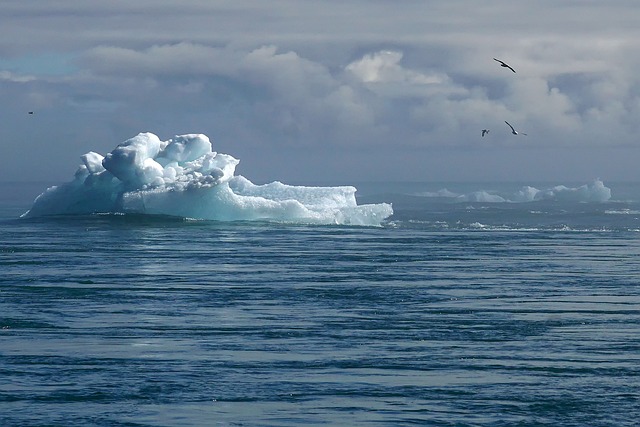
“The evidence is clear and compelling. Earth’s atmosphere and oceans are warming, the magnitude and frequency of extreme climate events are increasing, and sea level is rising along our coasts.” (Bold in the original and presuming to say that warming of the earth’s atmosphere and oceans is either a rare event or never happened before humans started burning fossil fuels in modern economies.)
Here is a brief, but important, aside:
Recently warming land and ocean temperatures are fed by decreases in cloud cover, according to a study by Petrovsky who used global cloud cover data from the ISCCP, the International Satellite Cloud Climatology Project . Visible Solar Radiation, sunlight, heats ocean waters, but infrared radiation from, for instance, more CO2 in the atmosphere, does not penetrate the water and cannot warm the oceans.
Changes in daytime high temperature track changes in the amount of the sun’s energy received by the earth, not increases in CO2.
So, for NCA5 to proclaim that National Academies of Sciences, Engineering, and Medicine are a reliable source of climate information is preposterous. Let me cite three more reasons why:
ONE: SCIENCE published, “A Pervasive Millennial-Scale Cycle in North Atlantic Holocene and Glacial Climates,” Gerard Bond, et al, SCIENCE; 14 Nov 1997; p 278. There is a copy of it accessible without fee at the Florida Gulf Coast University academic library web site.
The late Gerard Bond of Columbia University and his co-authors found and published the discovery of a “millennial scale cycle” of climate found in North Atlantic deep-sea mud and sediment cores. We call them “Bond Cycles.” So, for the National Academies to proclaim in 2023, “Climate Change is Happening Today,” is so trivial, that it exposes the National Academies as truly ignorant of the continuous real-world fluctuations of temperature. Scientists call it “non-stationarity.” Specifically, ~millennial temperature cycles, (1470 +/- 500 years) over wide areas of the North Atlantic were found by Bond, et al. That sequence found by Bond, et al, had peaks in ice-rafted debris in ocean sediments at 1400, 2800, 4200, 5900, 8100, 9400, 10,300 and 11,100 years ago.
TWO: F.C. Ljungqvist published a reconstruction of temperature variability in the “extra-tropical” (outside the tropics) Northern Hemisphere. He also found those ~thousand-year temperature cycles, the Bond Cycles.
THREE: In 2000, Richard Alley, a climate alarmist from Penn State, published “The Younger Dryas Cold interval as viewed from central Greenland.” In it, he used Greenland’s GISP2 ice core data, which also revealed the non-stationarity of temperatures as revealed from water’s O16/O18 ratios in ice. The ice originated as water vapor over the Gulf Stream, which condensed over Greenland and became snow crystals, then precipitated over Greenland as snow, and eventually became ice when buried by deeper and deeper snow accumulations.
These data were also analyzed by Don Easterbrook, emeritus Geology prof from Western Washington University. Easterbrook showed the non-stationarity of temperatures, the ~millennial warm periods, and significantly showed the temperature changes of the 20th century, were and continue to be TINY in comparison with past centuries’ temperature fluctuations…which had almost no human CO2 emissions.
DON EASTERBROOK LOOKS AT THE DATA
Let’s look in more detail at Alley’s GISP2 data as analyzed by Easterbrook, who uses as a figure of merit, the amount of temperature change per century, as revealed from the GISP2 ice cores.
The next section includes Easterbrook’s words, from his post, in quotes and changed typeface, since Easterbrook captures almost perfectly the important points which demolish the idea of competence, by both the Administration’s authors of NCA5 and their reviewers over at the National Academies.
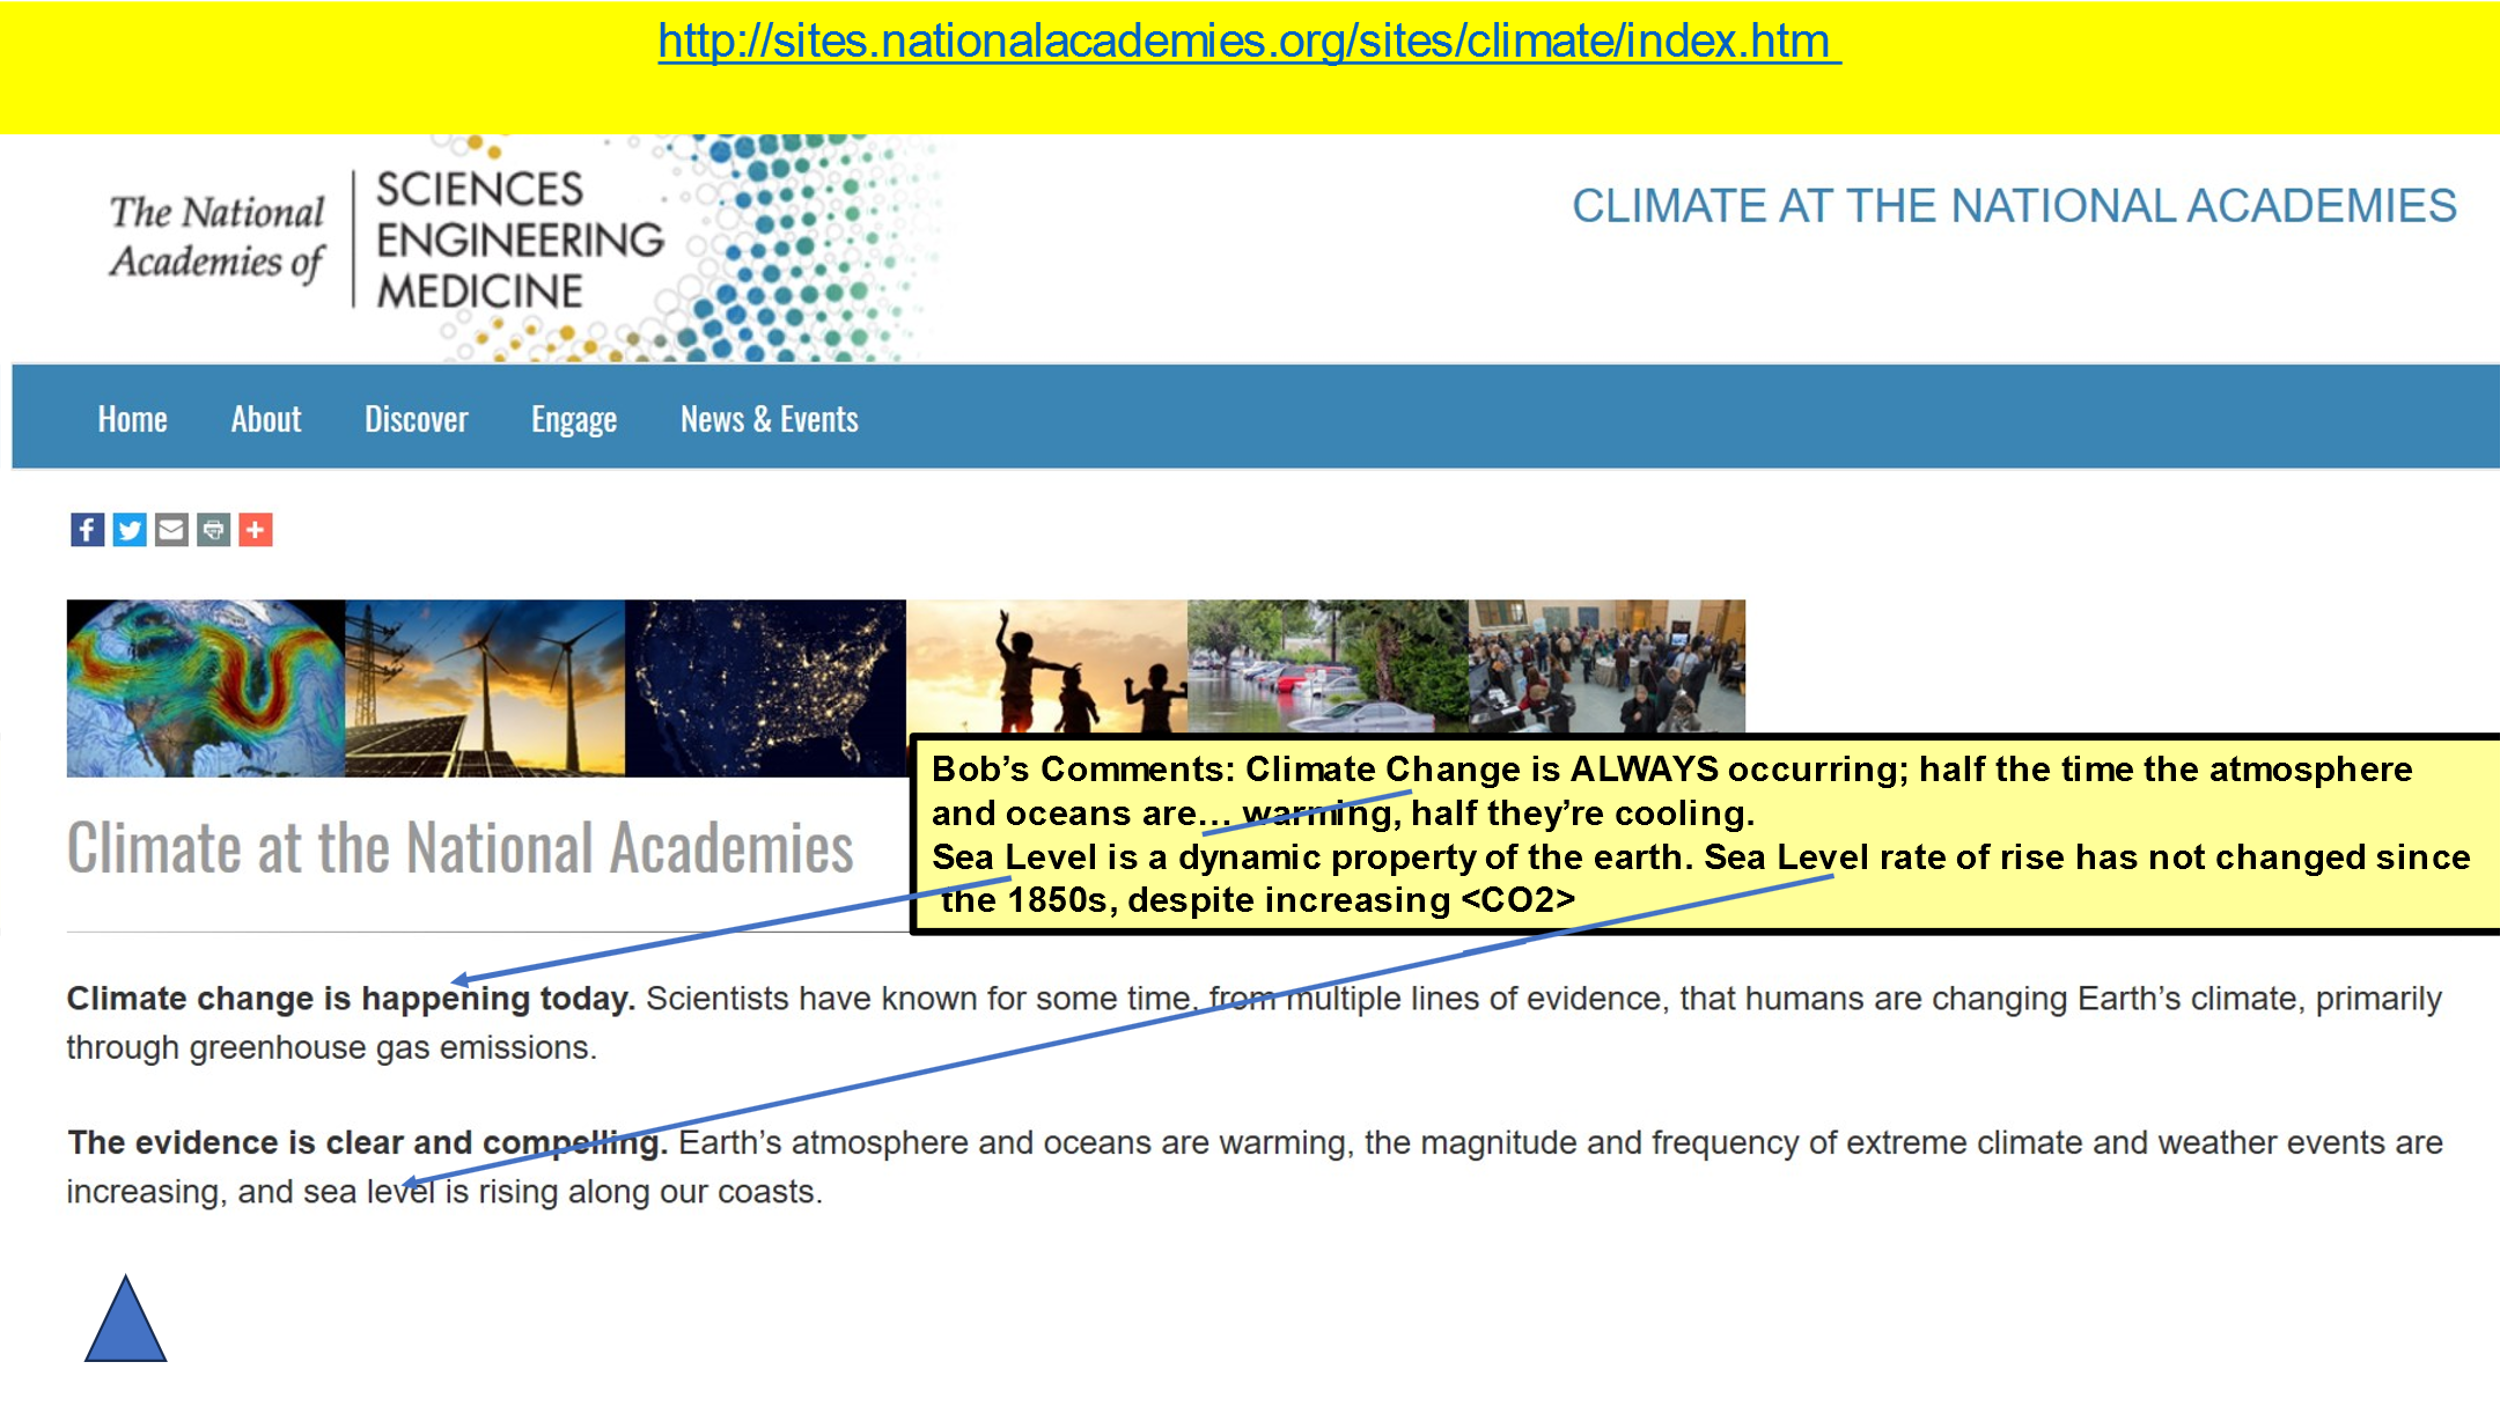
“Temperature changes recorded in the GISP2 ice core from the Greenland Ice Sheet (Figure 1) (Cuffy and Clow, 1997) show that the global warming experienced during the past century pales into insignificance when compared to the magnitude of profound climate reversals over the past 25,000 years. In addition, small temperature changes of up to a degree or so, similar to those observed in the 20th century record, occur persistently throughout the ancient climate record.”
The labels 1-17, the white numbers from the blue area in Figure 2 above, are index numbers for times in the next plot highlighting the temperature changes per 100 years.
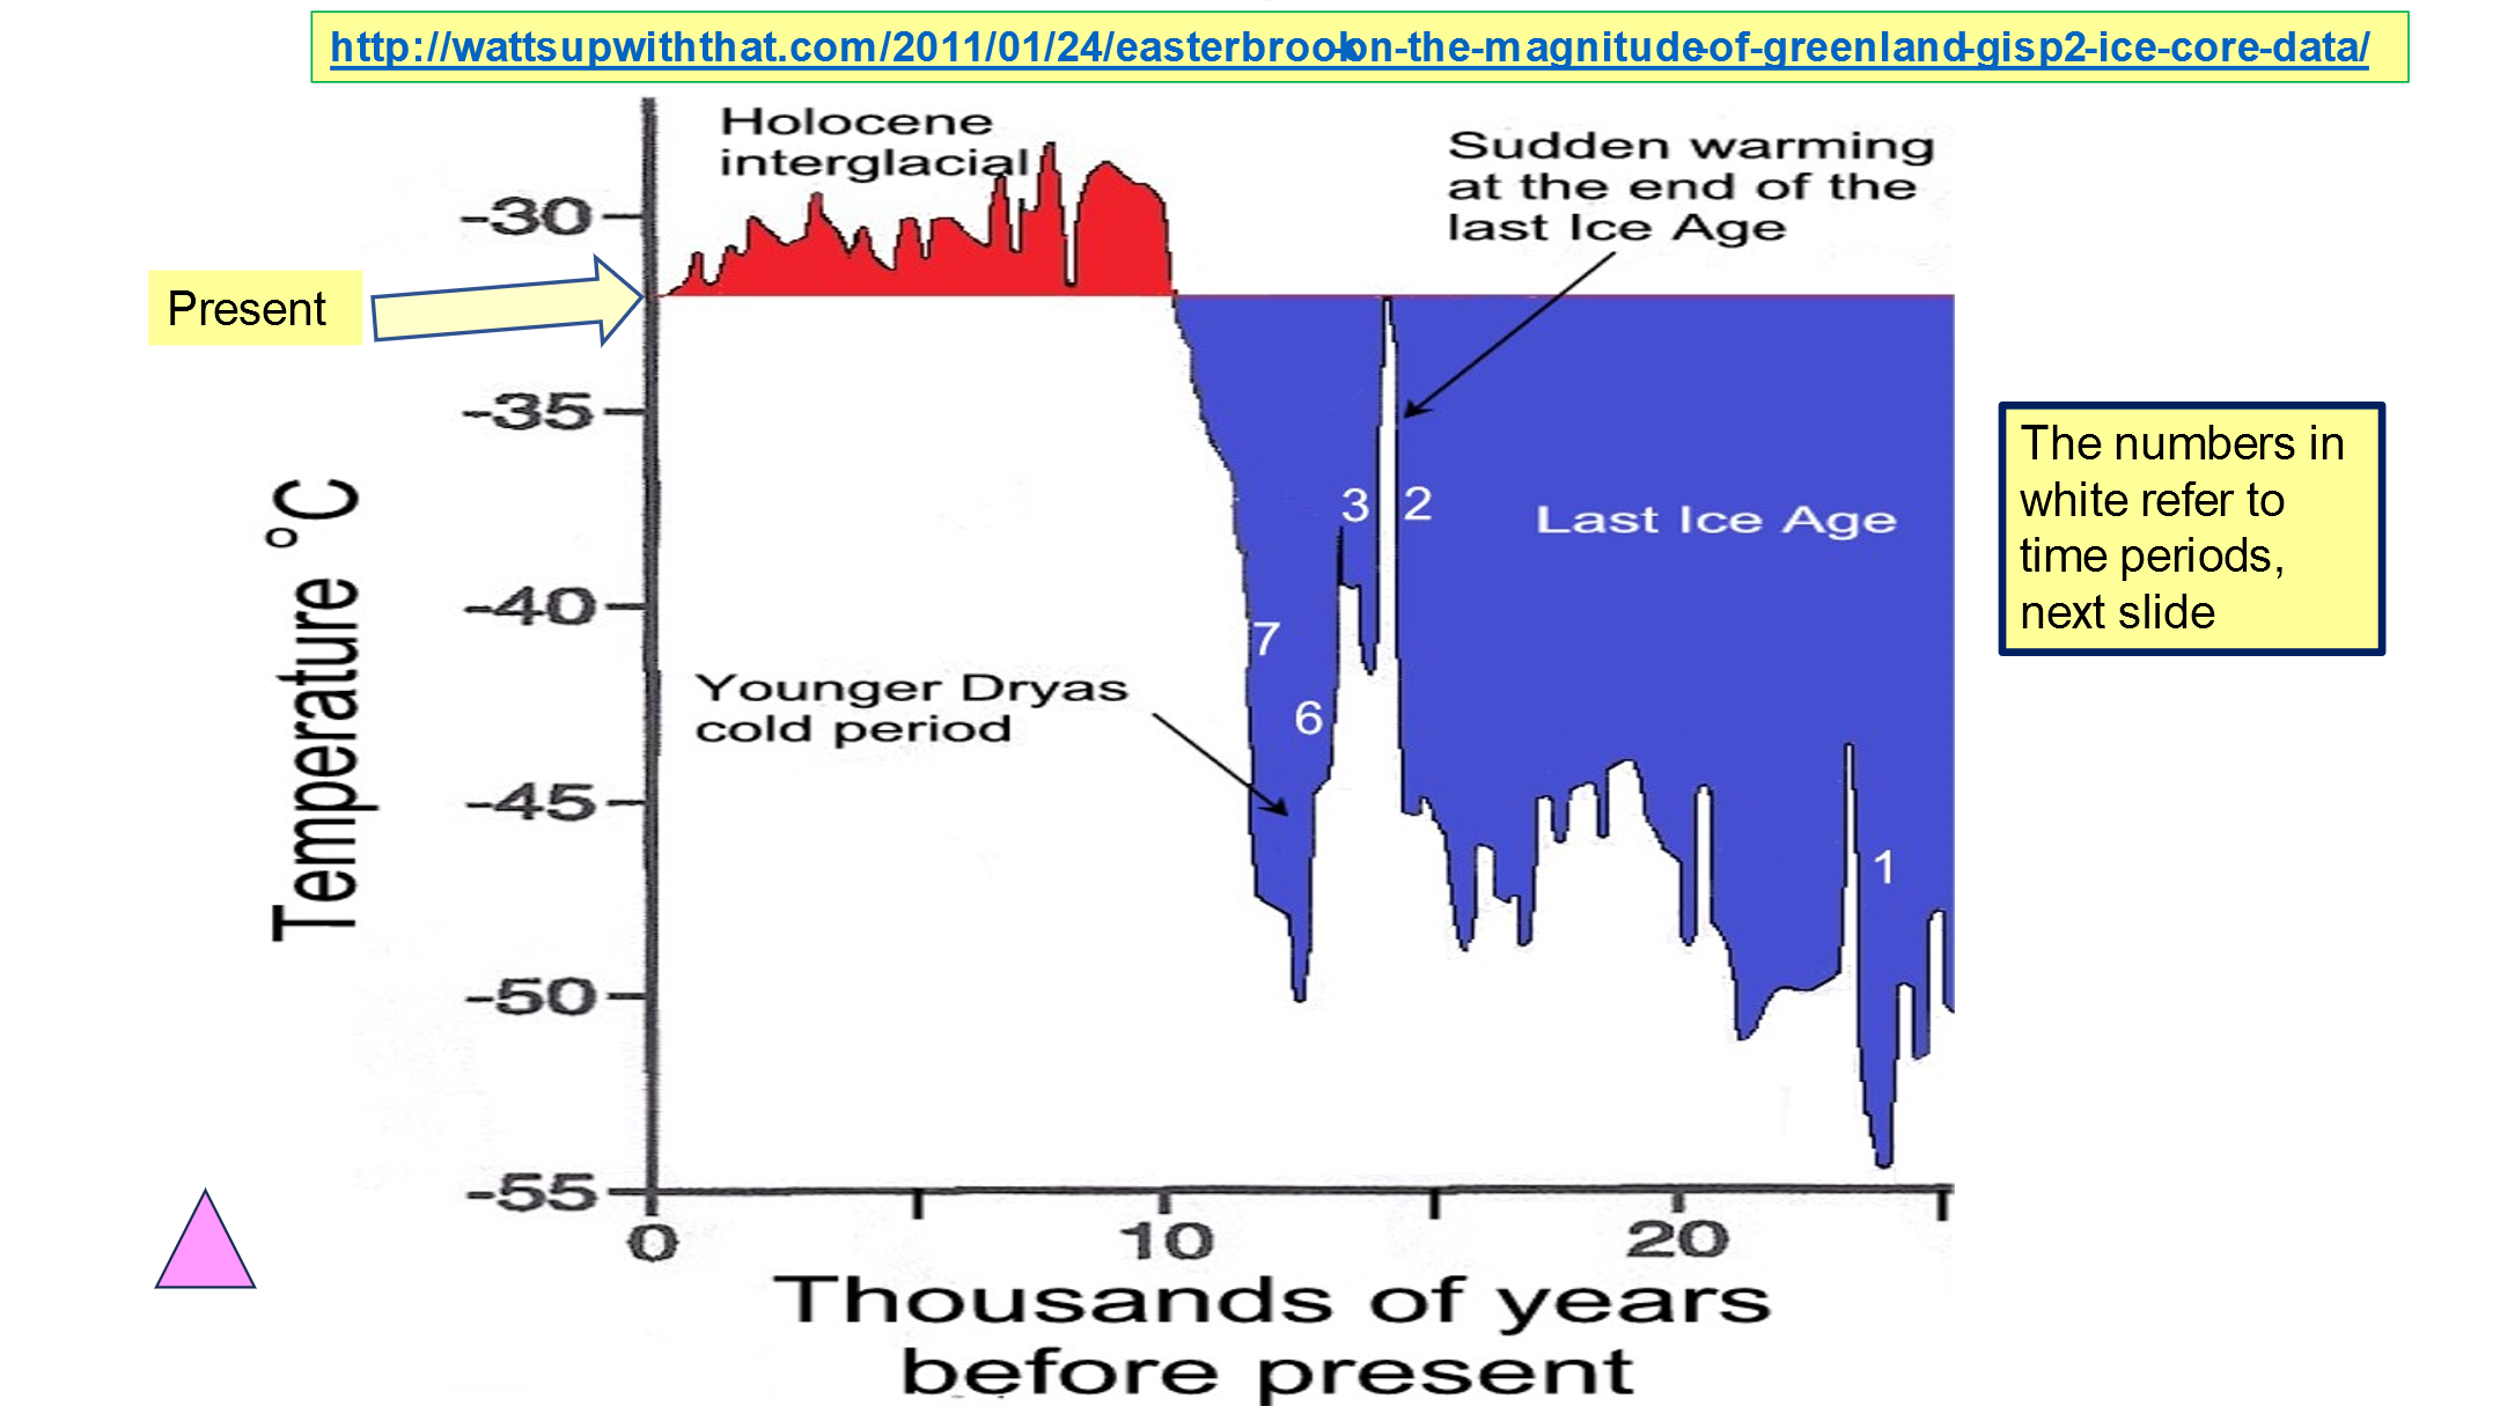
Below, in Figure 3, the abscissa plots the index number from Figure 2, while the magnitude of temperature change per 100 years is plotted as the ordinate, colored red for warming, and blue for cooling.
Figure 3 shows comparisons of the largest magnitudes of warming/cooling events per century over the past 25,000 years. At least three warming events were 20 to 24 times the magnitude of warming over the past century and four were 6 to 9 times the magnitude of warming over the past century. The magnitude of the only modern warming which might possibly have been caused by CO2 (1978-1998) is insignificant compared to the earlier periods of warming.
THE “EXPERTS” IN WASHINGTON DC HAVE NO CLUE ABOUT THE LESSONS OF THE ICE CORES
To hammer the point home, that the authors of NCA5 are ignorant and their reviewers are incompetent, authors of NCA5 say that they have used the National Academies as their “panel of experts” to review their findings. It is fair to say that both the NCA5 authors and the National Academies are truly ignorant of climate history as revealed by the ice core data and other proxy data for temperatures over the past thousands of years. While the National Academies are self-assured that today’s modest temperature increases are driven by human CO2 emissions, they have no awareness that (again, Easterbrook’s words),
“…over the past 25,000 years. At least three warming events were 20 to 24 times the magnitude of warming over the past century and four were 6 to 9 times the magnitude of warming over the past century.”
“Ignorance” by the NCA authors and their reviewers at the National Academies of the real world of climate history does not begin to tell the triple stories of their collective: 1.) inability to conduct a literature search on the subjects at hand, 2.) poor scholarship, and 3.) lack of critical thinking.
NOT ONLY ARE THEY IGNORANT, BUT THEY ALSO USE SLIGHT OF HAND TO DECEIVE
What follows is, apparent to me, slight of hand at work in the NCA5 basic report.
In the body of the report is the NCA5 claim,
“Global temperature has increased faster in the past 50 years than any time in at least the past 2000 years.”
NCA5’s Figure 1.5 shows a time series of temperatures and this quote in bold:
“The US has warmed rapidly since the 1970s.”
Why this specific choice of dates and time period?
I contend that it is because there is a prominent and well-known, in climate studies, natural 60-year cycle of temperature, prominent in North American temperature data, the Atlantic Multi-Decadal Oscillation, also called the AMO. The last minimum in AMO temperatures was about 1970.
So, the choice of about 1970, the previous minimum in the AMO, to start calculating alleged
“Human-Caused CO2-Fueled Global Warming,”
is the deliberately deceptive choice often used by climate alarmists, and was the choice of the New Mexico State Climatologist in a “Climate Education” presentation hosted by NMSU in 2018.
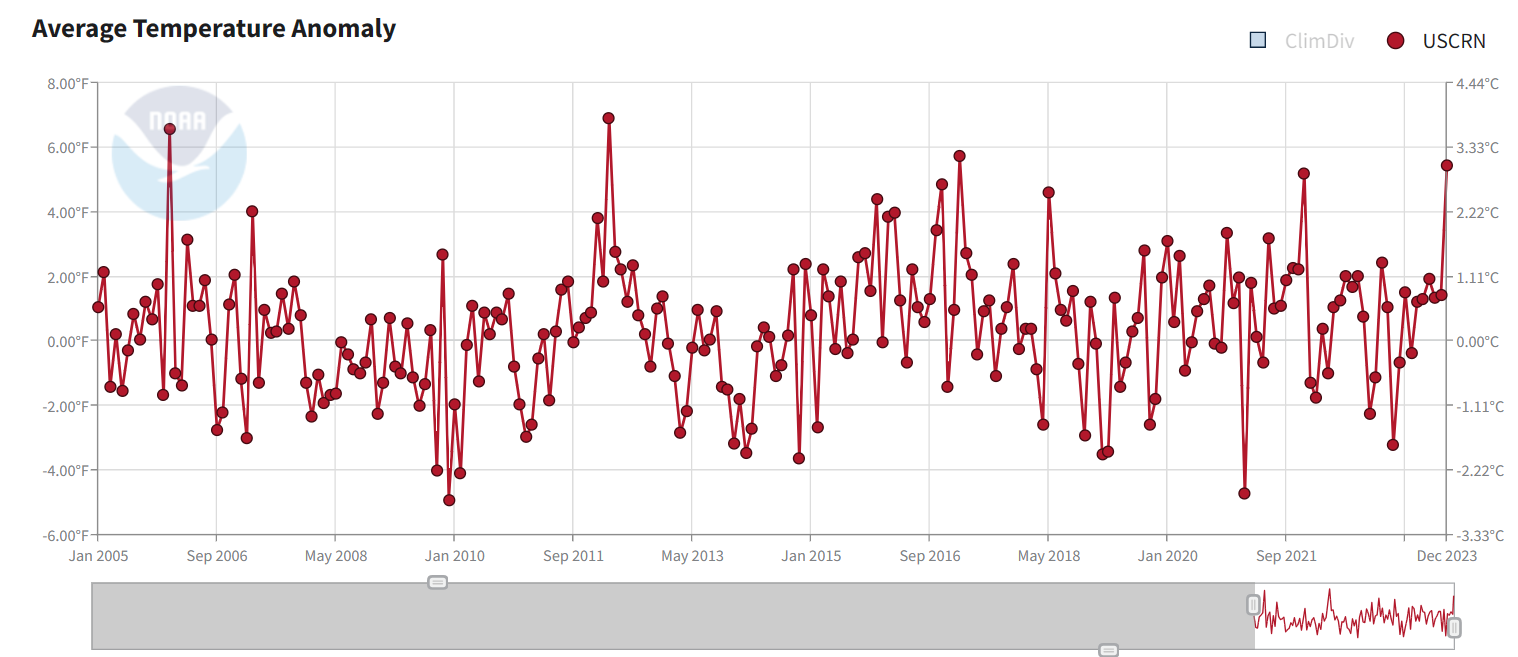
I use a surface temperature data set for a continent-sized area to test the NCA5 statement,
“Global temperature has increased faster in the past 50 years than any time in at least the past 2000 years.”
Such a data set needs to have accurate field measurements uncontaminated by Urban Heat Island effects and be readily available. This data set is from the US Climate Reference Network, USCRN, whose data set starts in January 2005, and ends in December 2023. The data are plotted in Figure 4 below.
The claim in NCA5 is not sustained by the data.
https://www.ncei.noaa.gov/access/monitoring/national-temperature-index/time-series/anom-tavg/1/0
OTHER NCA5 CLAIMS DEBUNKED
The National Academies’ lead graphic says,
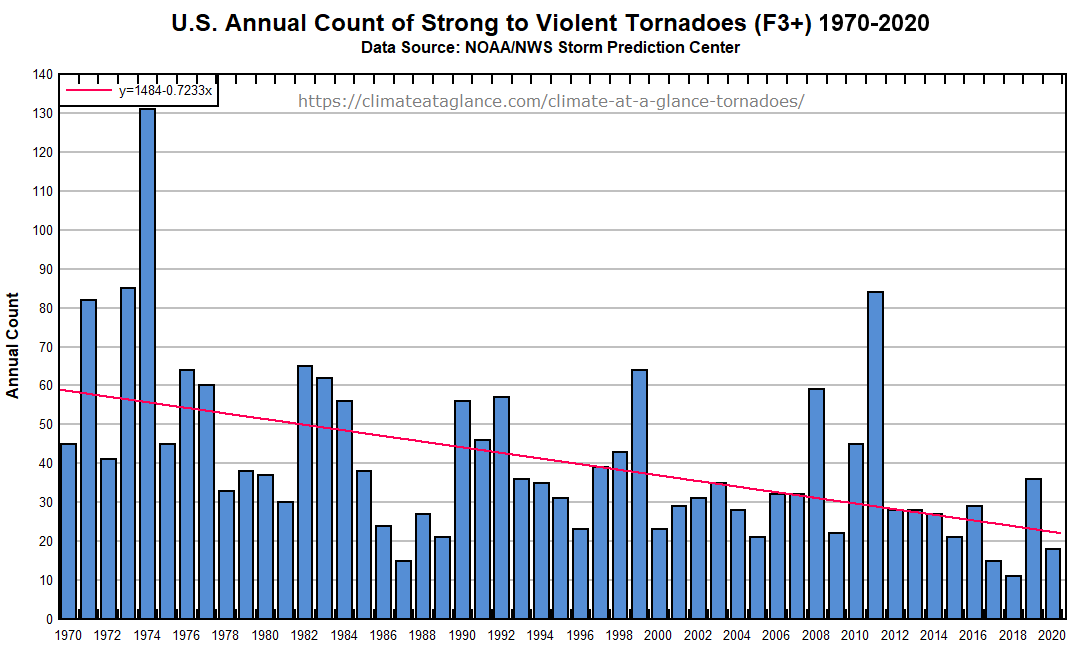
“the magnitude and frequency of extreme climate events are increasing, and sea level is rising along our coasts.”
Here in Figure 5 are the strong to violent tornado count data from NOAA courtesy of the Heartland Institute, whose caption I used.
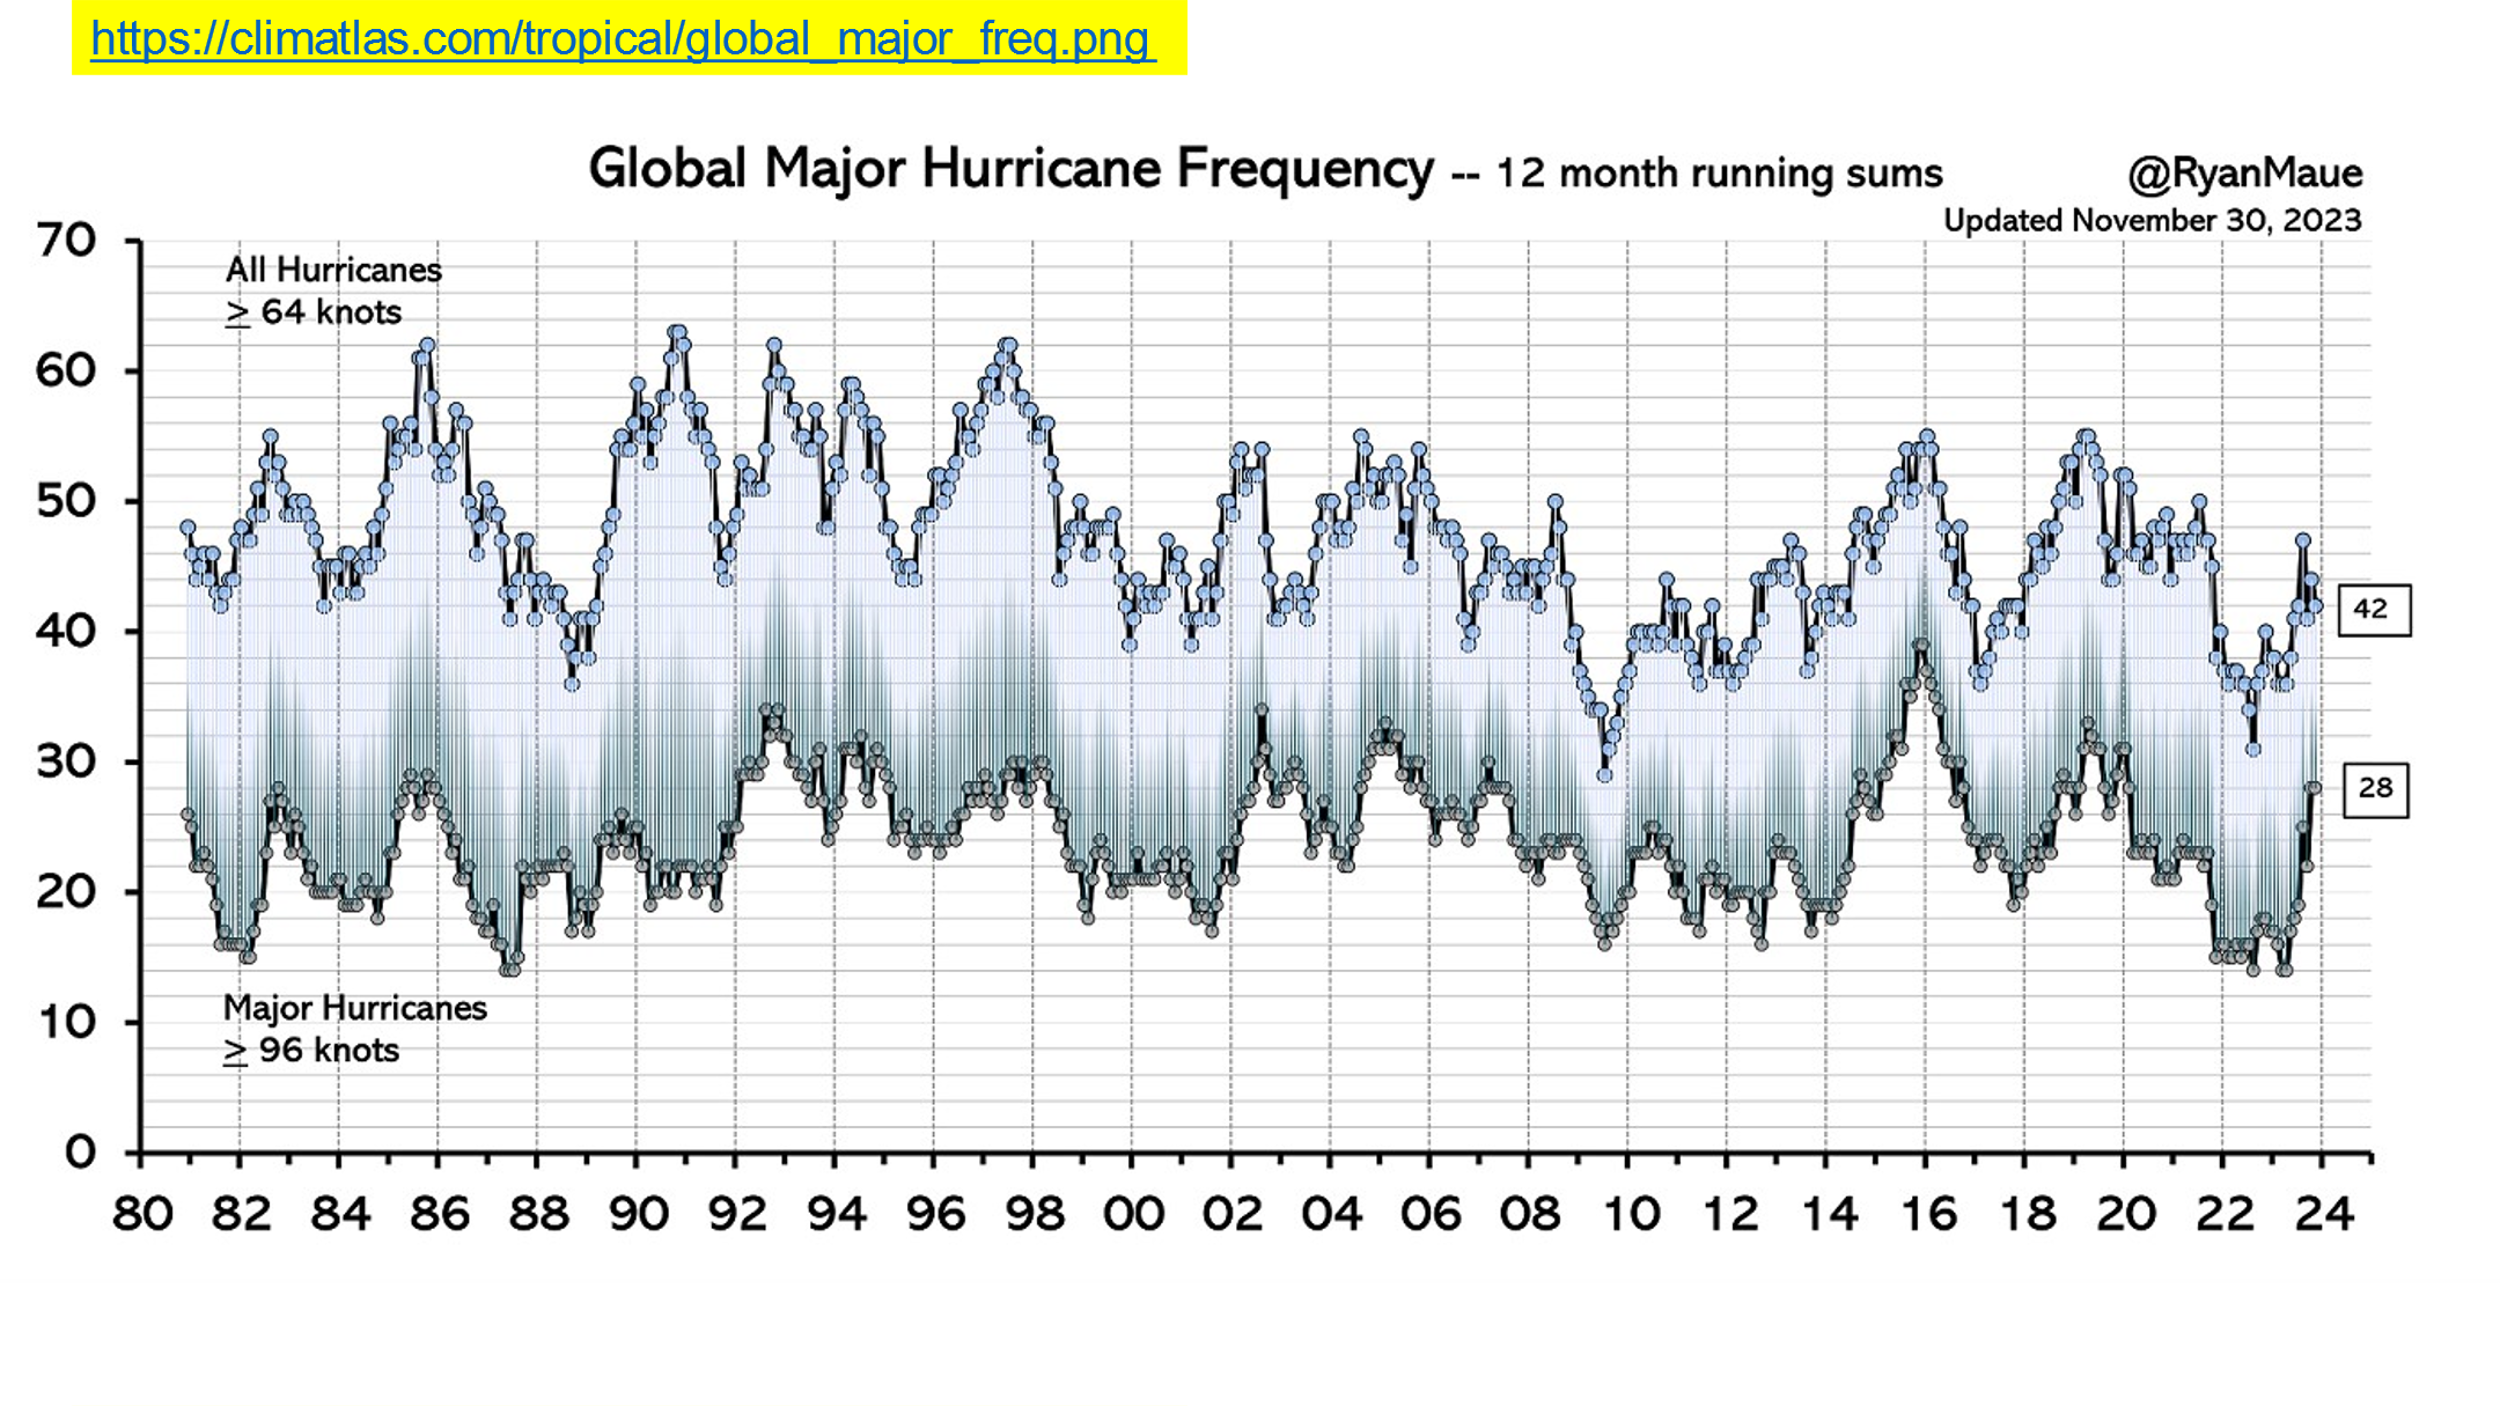
In Figure 6 below there is a plot of Global Hurricane and Global Major Hurricane occurrences from Ryan Maue.
SEA LEVEL.
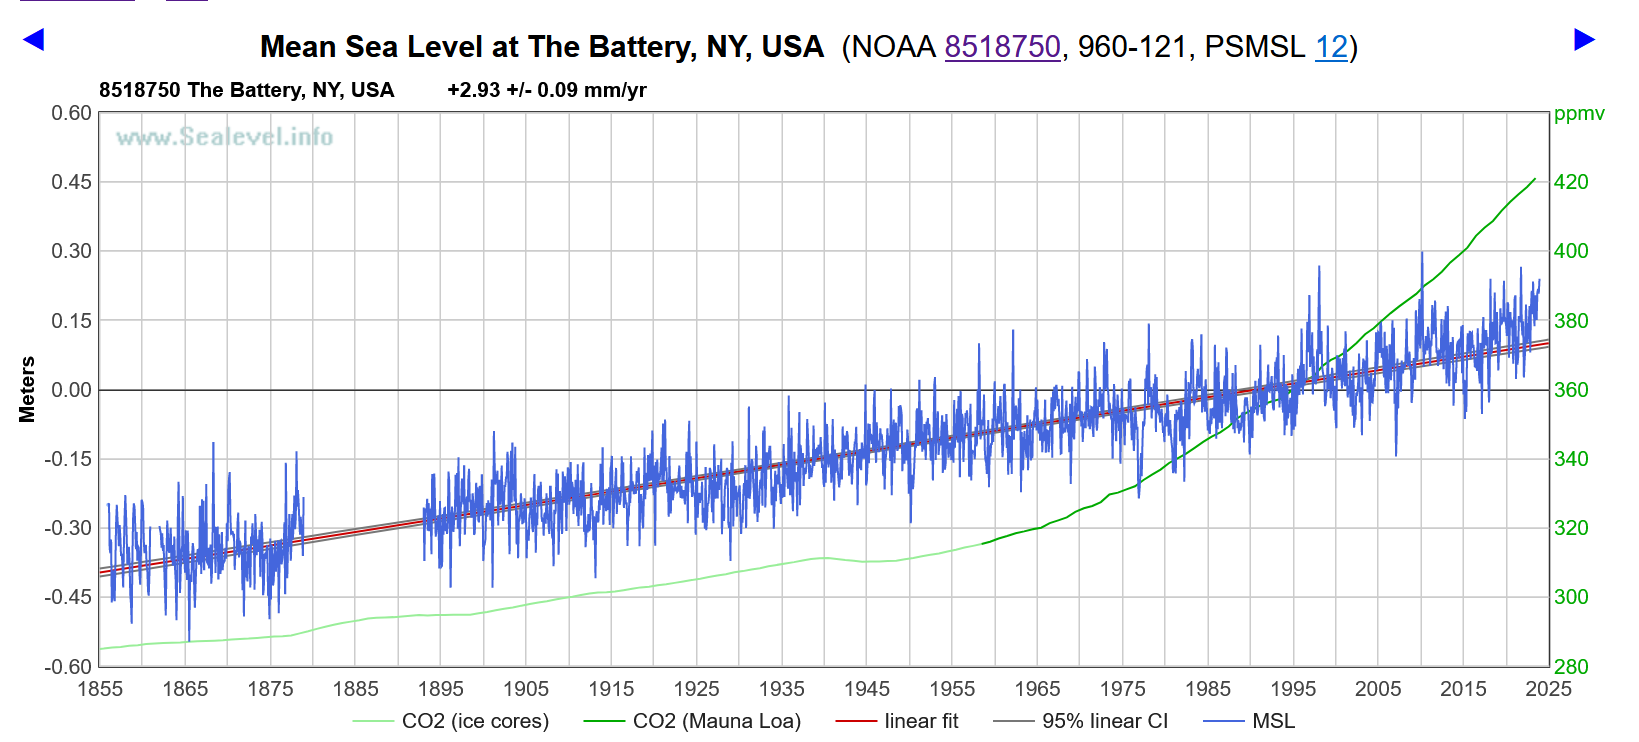
Sea level is a dynamic property of the earth unrelated to human emissions of CO2, as I discussed in https://casf.me/history-falsifies-climate-alarmist-sea-level-claims/. This point is made also by the time series of sea level from all over the world; my favorite is https://www.sealevel.info/
Figure 7 below is a plot of the longest sea level time series in the USA, from The Battery at the foot of Manhattan Island, New York City. The earliest data point is March 1856, when Franklin Pierce was President of the USA. The source, https://www.sealevel.info/data.php is the web site run by my friend from the Heartland International Climate Change Conferences, Dave Burton.
https://www.sealevel.info/MSL_graph.php?id=Battery
SUMMARY:
NCA5 opines that the National Academies of Science, Engineering and Medicine is a reliable source of information on climate change, increasing intensity of storms, and accelerated rates of sea level rise.
Looking at published data, much from the US Government itself, shows none of this is true.
The only conclusion from this is that the Biden Administration is either ignorant of the facts of climate history and the physical basis of recent increases in temperature described in the “aside” paragraph in the “DON’T TRUST THESE ALLEGED EXPERTS” section, or corrupt. They are looking for power over ‘we the people’ by imposing changes to consumer demand. Their power is largely derived from giving handouts in the form of the green energy subsidies to the “wind and solar” crowd.
The subtitle of this post,
“Fifth National Climate Assessment, NCA5: It is Full of Bogus Claims”
is a concise, one line summary of this critique.