
Natural Rainfall, Excessive Runoff, and Lousy Drainage, Not Human-Caused CO2-fueled Global Warming
By Robert W. Endlich
FLOODING IN NEW YORK CITY
As the remnants of what, days before, had been Hurricane Ida passed by the New York City Metro area the evening of 1 Sep 2021, the skies opened up and in spots it poured, as an anticipated heavy rain event crossed the region near sunset. Thunderstorms, fed by water vapor evaporating from
historically the warmest waters of the year offshore, in New York Bay and the nearby Atlantic Ocean, even brought some tornadoes as the unstable air was made even more unstable by convergence of the air at the surface. Overwater winds came onshore to terrain filled with high-rise apartments and skyscrapers built to enable the highest numbers of humans to live and work in the New York City Metropolitan Area, home to over 8 million souls, according to the best estimates. The Urban Heat Island, caused by, and left by, human activities had warmed the surface many degrees hotter than the surrounding natural terrain.
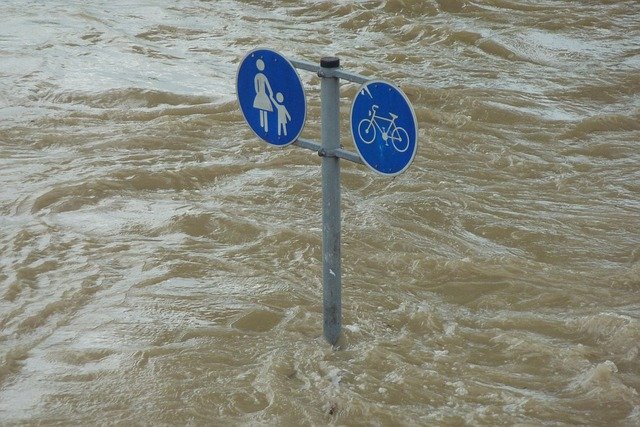
The result was widely forecast in the days prior to the event. Well-advertised heavy downpours occurred, and the land, jam-packed with building roofs, sidewalks, roads, parking lots, industrial plants, Interstate highways and even swimming pools surrounded with walkways, did what it always does during heavy rain events. The rain was shed into rain gutters, on to sidewalks and paved driveways, down street gutters, into drainage grates, and, sadly, into a century-plus old stormwater system wholly inadequate to the task. Water backed up; urban flooding occurred. Subways, railways, roadways, parkways, expressways and even the terminal in Newark Airport flooded; sadly 45 people died in the flooding. A significant number died when illegal basement apartments suddenly flooded when the hydraulic pressure of waterlogged soil collapsed basement apartment walls, flooding living areas with ceiling-deep water within seconds.
ABOUT THE STORM
There’s an excellent review of the storm and its weather components at Cliff Mass Weather Blog, a dozen graphics of which I used as introductory material for my 18 Sep 2021 presentation to the Cruces Atmospheric Sciences Forum.
Predictably, there were cries that human-caused CO2-fueled global warming caused the heavy rain and the ensuing deaths. There were more cries, “We were not warned.”
I write this to set the record straight using information and data available to anyone with a little Earth Science knowledge and ability to use internet search tools. National Weather Service forecasts were good, even excellent. The rainfall rates and totals which were observed during this storm fall way short of record-setting rates and totals, if you look at US records kept by the National Weather Service and NOAA. Looking further, there’s not the slightest indication that new records of rainfall rate, storm totals, or annual rainfall amounts are increasing or have increased even the slightest amount because of the increased amount of the trace gas Carbon Dioxide in the atmosphere over the centuries. We have the data.
First, let’s look at the measured 1 Sep 2021 total amounts of rain which occurred across the NYC Metro area, based on NOAA’s reports for the date.
Station Amount (Inches); R suffix means new Record for the Date
Newark, NJ, Airport 8.41R
Central Park 7.13R
Islip, NY, Airport 1.53R
LaGuardia, NY, Airport 0.14
J F Kennedy, NY, Airport 0.15
Bridgeport, CT, Airport 0.10
Cliff Mass cites Newark Airport as having received 3.24 inches in one hour during the storm, and at Central Park, 3.15 inches in an hour. Later we will use the maximum amounts which fell in an hour, and in a day, from the point records for the Continental USA (CONUS), as figures of merit to assess the claims of “climate change-driven” extreme rainfall.
THE LOCALS TELL THEIR STORIES
I found this story in The Gothamist written shortly after the storm, quoting NYC Mayor Bill de Blasio blaming weather forecasts for being inaccurate, but I also found this Twitter forecast issued with more than 12 hours lead time which clearly showed a magenta band of a “High” and “Excessive Rainfall” forecast covering the NYC Metro area, shown below:
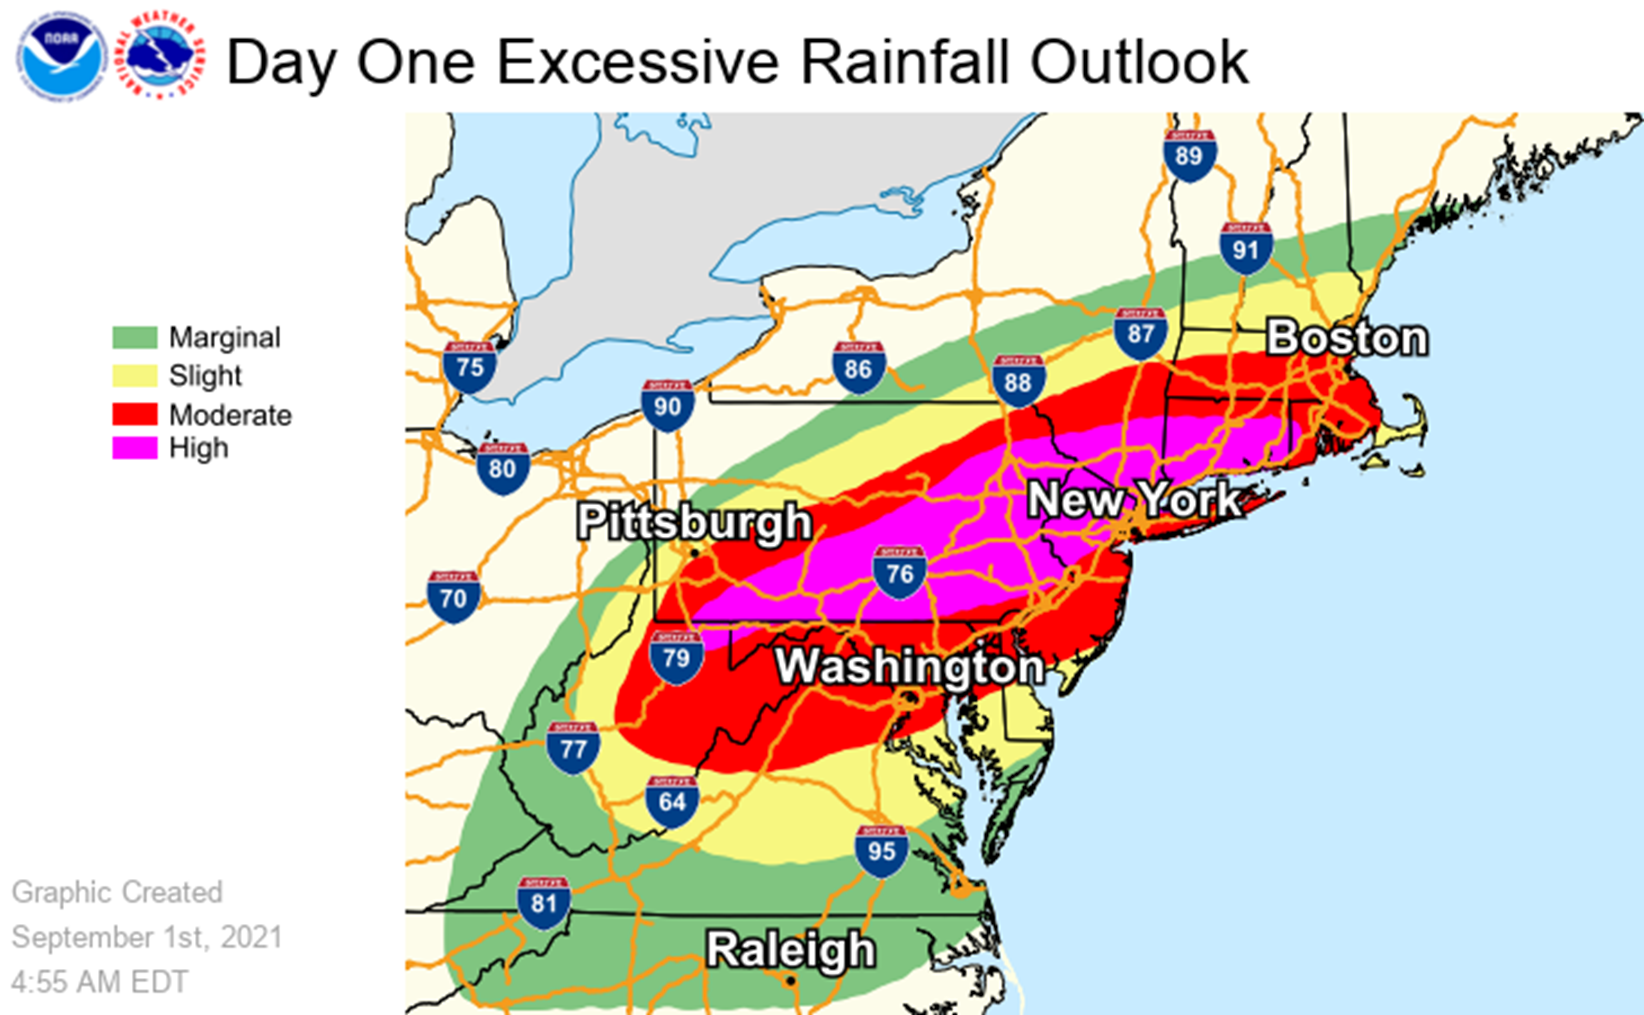
If Mayor de Blasio does not have his helpers monitor upcoming weather events and forecast effects, then shame on him for such studied ignorance. It takes a special kind of arrogance and chutzpah for a politician to be either this ignorant and/or to attempt to lie his way out of this. The story in The Gothamist describes the weather outlook issued two days prior, for 10-14 inches of rain as Ida’s remains passed NYC. That would be a forecast of about two months’ rainfall in a single day, issued two days prior, according to The Gothamist and the climate of New York City.
Mayor de Blasio’s ignorance, as we will soon see, was fully on display with this quote from another local publication, The City, with this whopper, “This kind of radical change in weather is beyond the understanding, beyond the reach of our typical measuring tools…” my bold for emphasis.
THE RECORD OF HEAVY RAINFALL MEASUREMENTS IN THE USA…AND IN THE UK
NOAA’s National Weather Service’s Hydrometerological Services Design Center’s map showing locations of the greatest observed point precipitation values for the USA is in Figure 2 below. This map contains information useful in determining rainfall runoff possibilities, information that can be used in identifying civil engineering design specifications for water runoff needed for each project and neighborhood. Such information might prove useful should New York City be seriously interested in improving the runoff capacity of their antiquated storm drainage system.
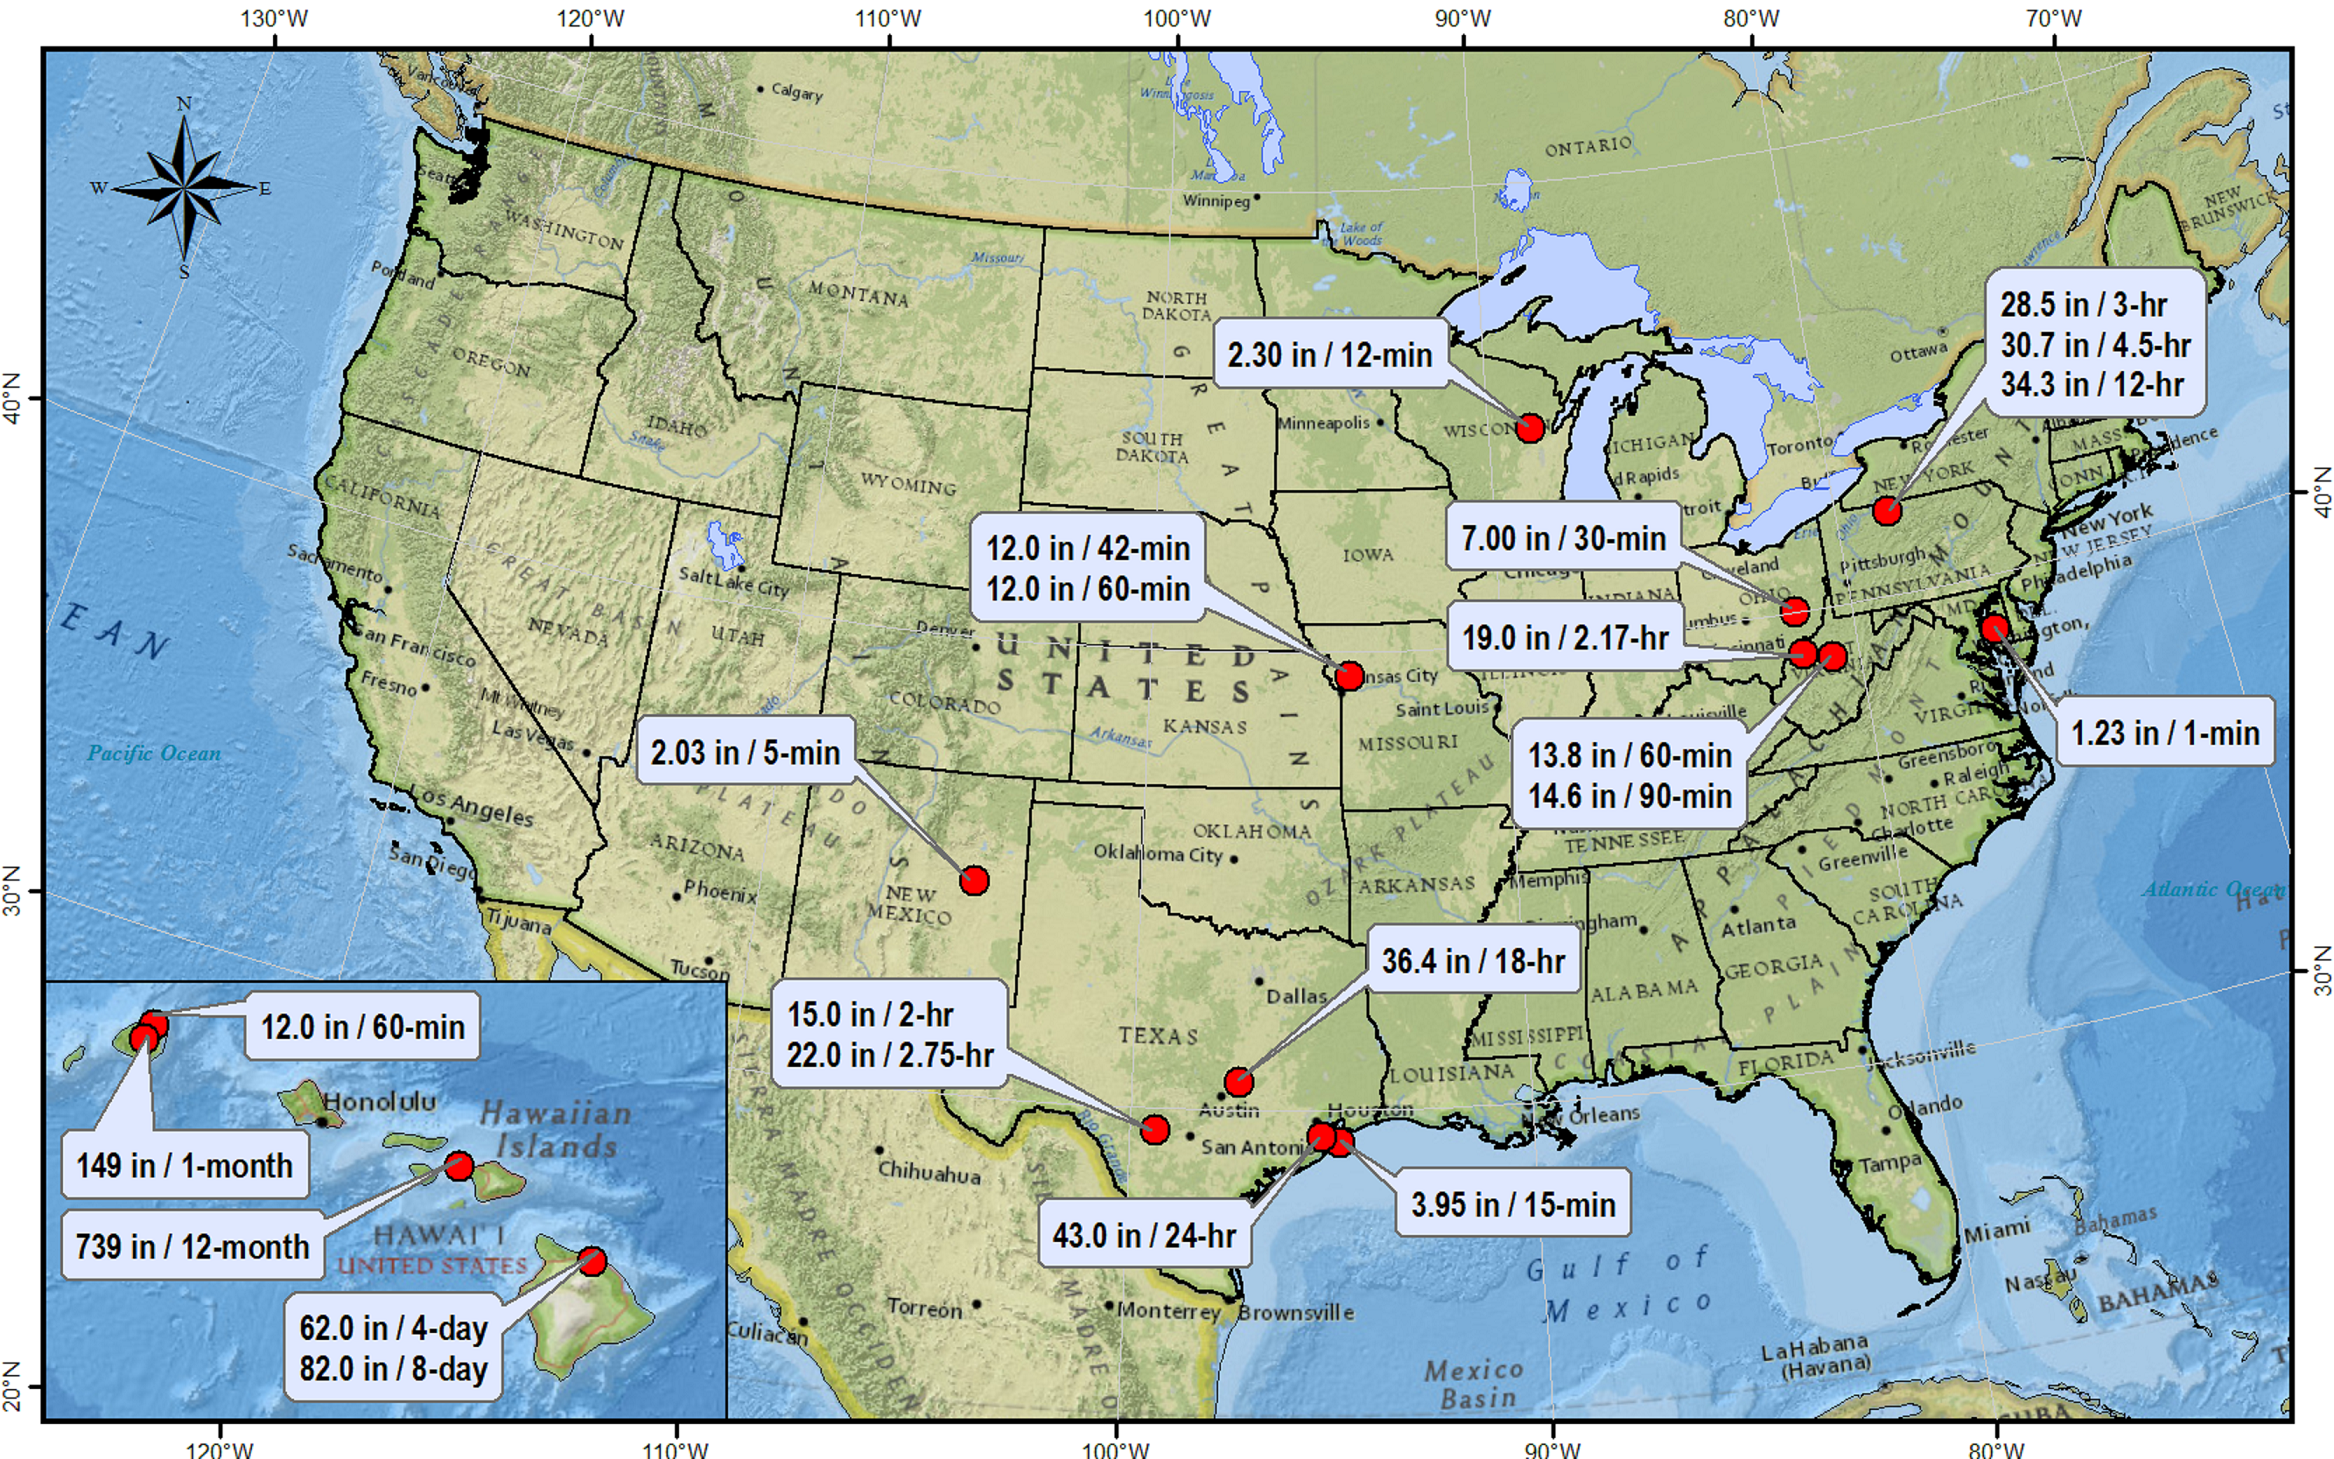
There are two rainfall amounts we use here, maximum rainfall in one hour and maximum rainfall in a single day, 24 hours.
The maximum rainfall during post-Hurricane Ida at Newark, NJ was 3.24 inches in one hour during the storm, and at Central Park, 3.15 inches in one hour. The maximum rainfall from the map is 13.8 inches in sixty minutes. The text from the Hydrometeorological Design Center says this record was set near Burnsville, West Virginia on 4 August 1943. So, the one-hour rainfall amounts near Burnsville, WV, in 1943, were over FOUR TIMES the amount in the same amount of time in the NYC Metro area.
Anyone can see that Mayor de Blasio’s claim that the 1 Sep 2021 rainfall in the NYC Metro area was, a “radical change in weather” and “beyond…understanding,” are statements of de Blasio’s clear ignorance of known weather events that are available to him or his helpers with the curiosity to look this information up.
The entire day’s accumulations as storm totals, 8.41 inches for Newark and 7.13 inches for Central Park, are much less than the historical maximum observed in the CONUS; i.e., 43 inches received at Alvin, Texas on 25 Jul 1979. That 24-hour rainfall record at Alvin, Texas, between Houston and Galveston, is over FIVE TIMES that received at Newark on 1 Sep 21.
Again, de Blasio’s “radical change in weather” and “beyond…understanding,” are statements showing extreme ignorance of fact, made in the hope that no one in the Main Stream Media would look up rainfall records.
Speaking of published rainfall records, I looked up the list of New York Hurricanes and found twenty listings for tropical systems whose rainfall exceeded three inches in or close to New York City. With a location on the US Eastern Seaboard, significant hurricane impacts on the NYC Metro area are frequent events, and a significant subset of these involve three inches of rain or more. In fact, since Hurricane Connie’s 13.24 inches in 1955, there have been two more occurrences of more than a foot of rain in the NYC Metro area as tropical systems passed by.
Let’s consider the claim that increasing Carbon Dioxide in the atmosphere causes increasing heavy and very heavy rainfall events are in the USA.
Below is a graphic from Christopher Burt’s, Extreme Weather: A Guide & Record Book, the table summarizing extreme rainfall data from the NWS’ Hydrometeorological Services Design Center:
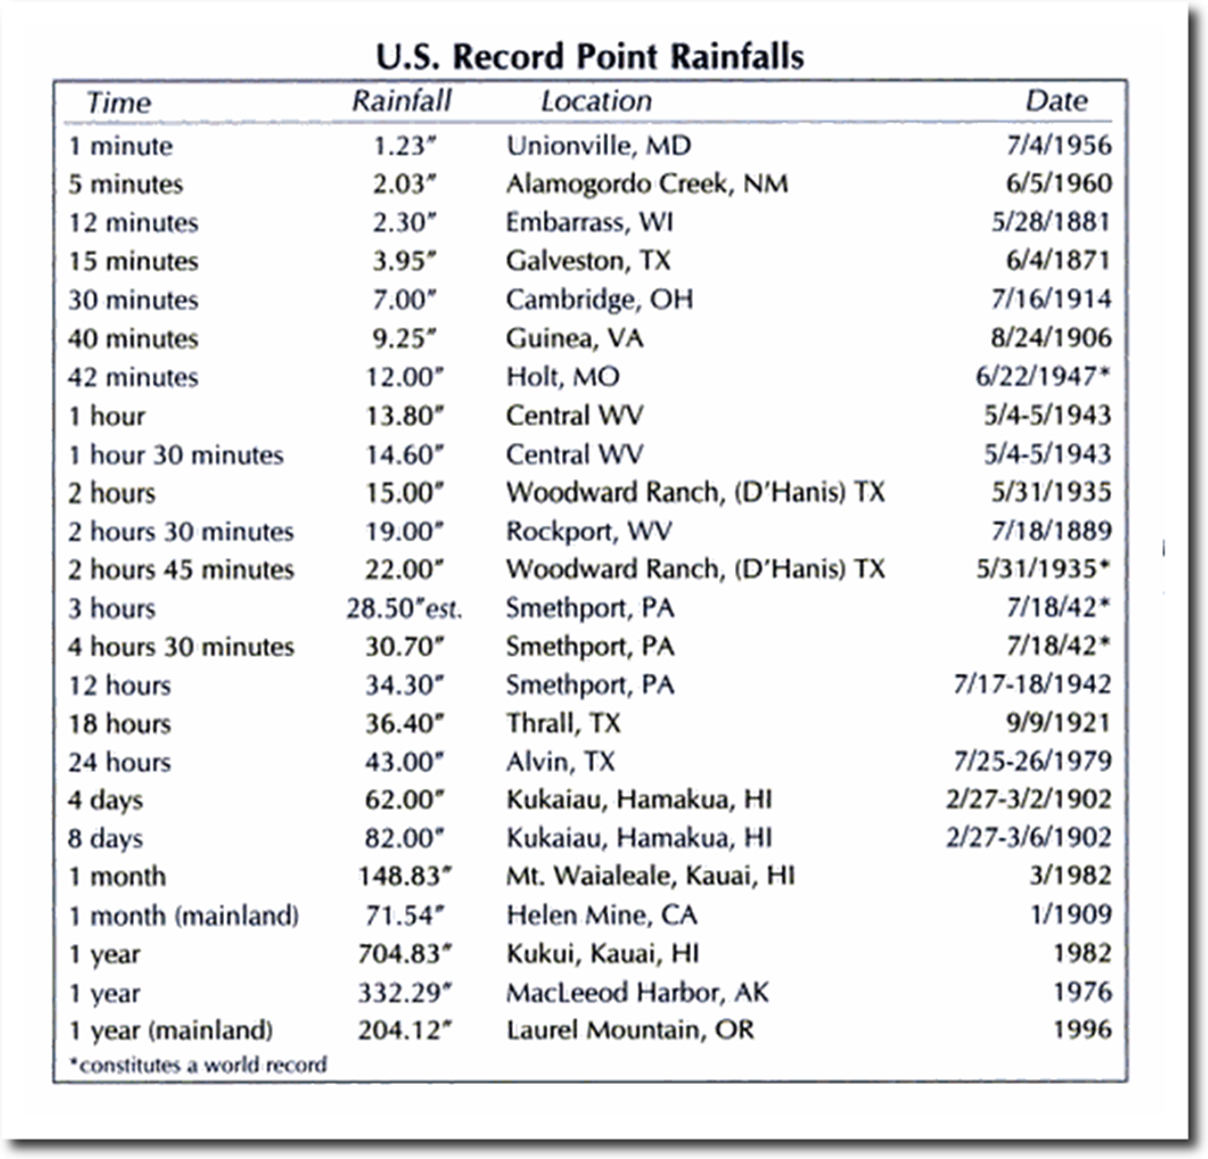
The dates of occurrence of the rainfall records in the USA show no modern maximum frequency of record-setting rain events. These data confirm that the modern increases in the trace gas Carbon Dioxide have had not the slightest effect in causing more record setting rainfall events as CO2 increases.
Paul Homewood frequently publishes in his blog, Not A Lot of People Know That, graphic data from the UK Met Office’s England and Wales (EWP) series, in which data began in 1766. That time series of monthly precipitation is the longest instrumental series of this kind in the world. A telling example is shown in Figure 4 below:
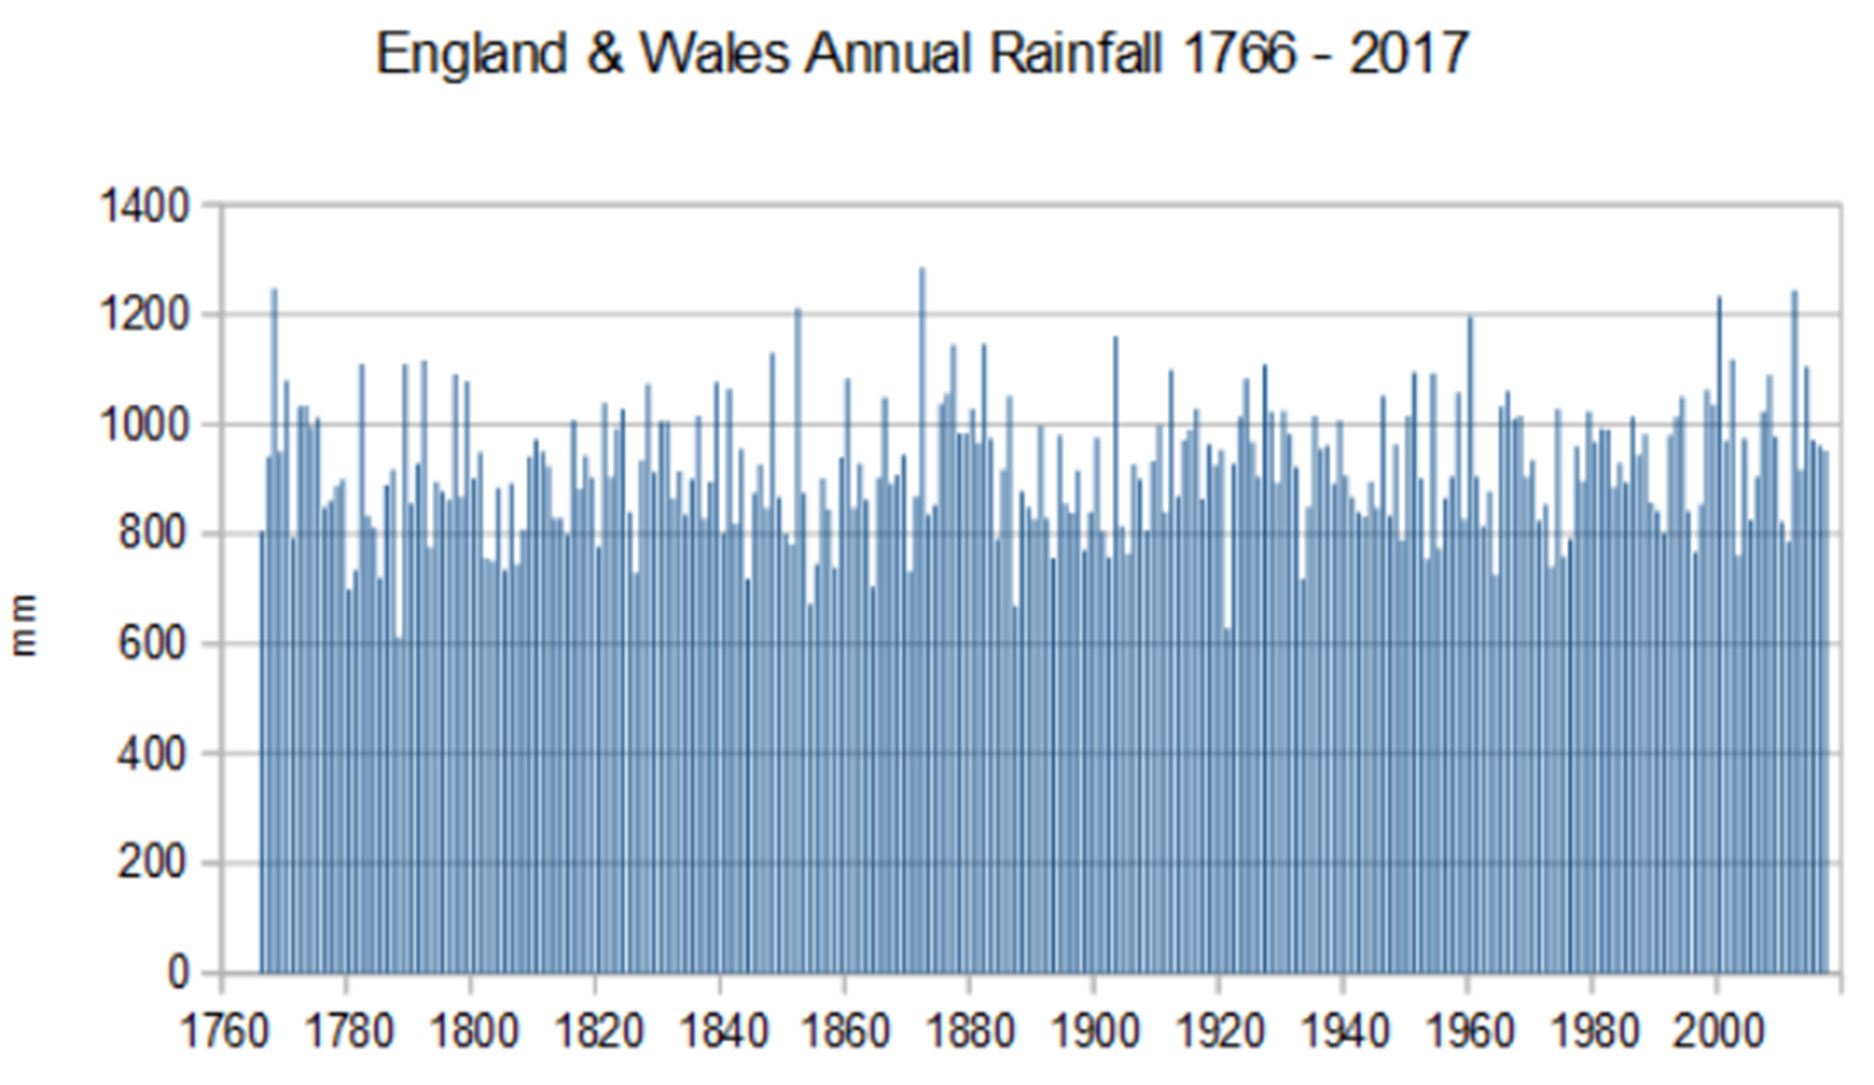
The time series of the England and Wales annual rainfall, Figure 4 above, shows annual rainfall there beginning in 1766, based on monthly data compiled by the UK Met Office. The chart shows the year-to-year variations in rainfall and multidecadal fluctuations in rainfall, but there’s no long-term increase in rainfall associated with more heavy rainfall caused by increases in the trace gas Carbon Dioxide evident in the data.
There ARE anthropogenic effects in the NYC Metro heavy rain and subsequent flooding event of 1 Sep 2021, but they have nothing to do with the increases in atmospheric CO2.
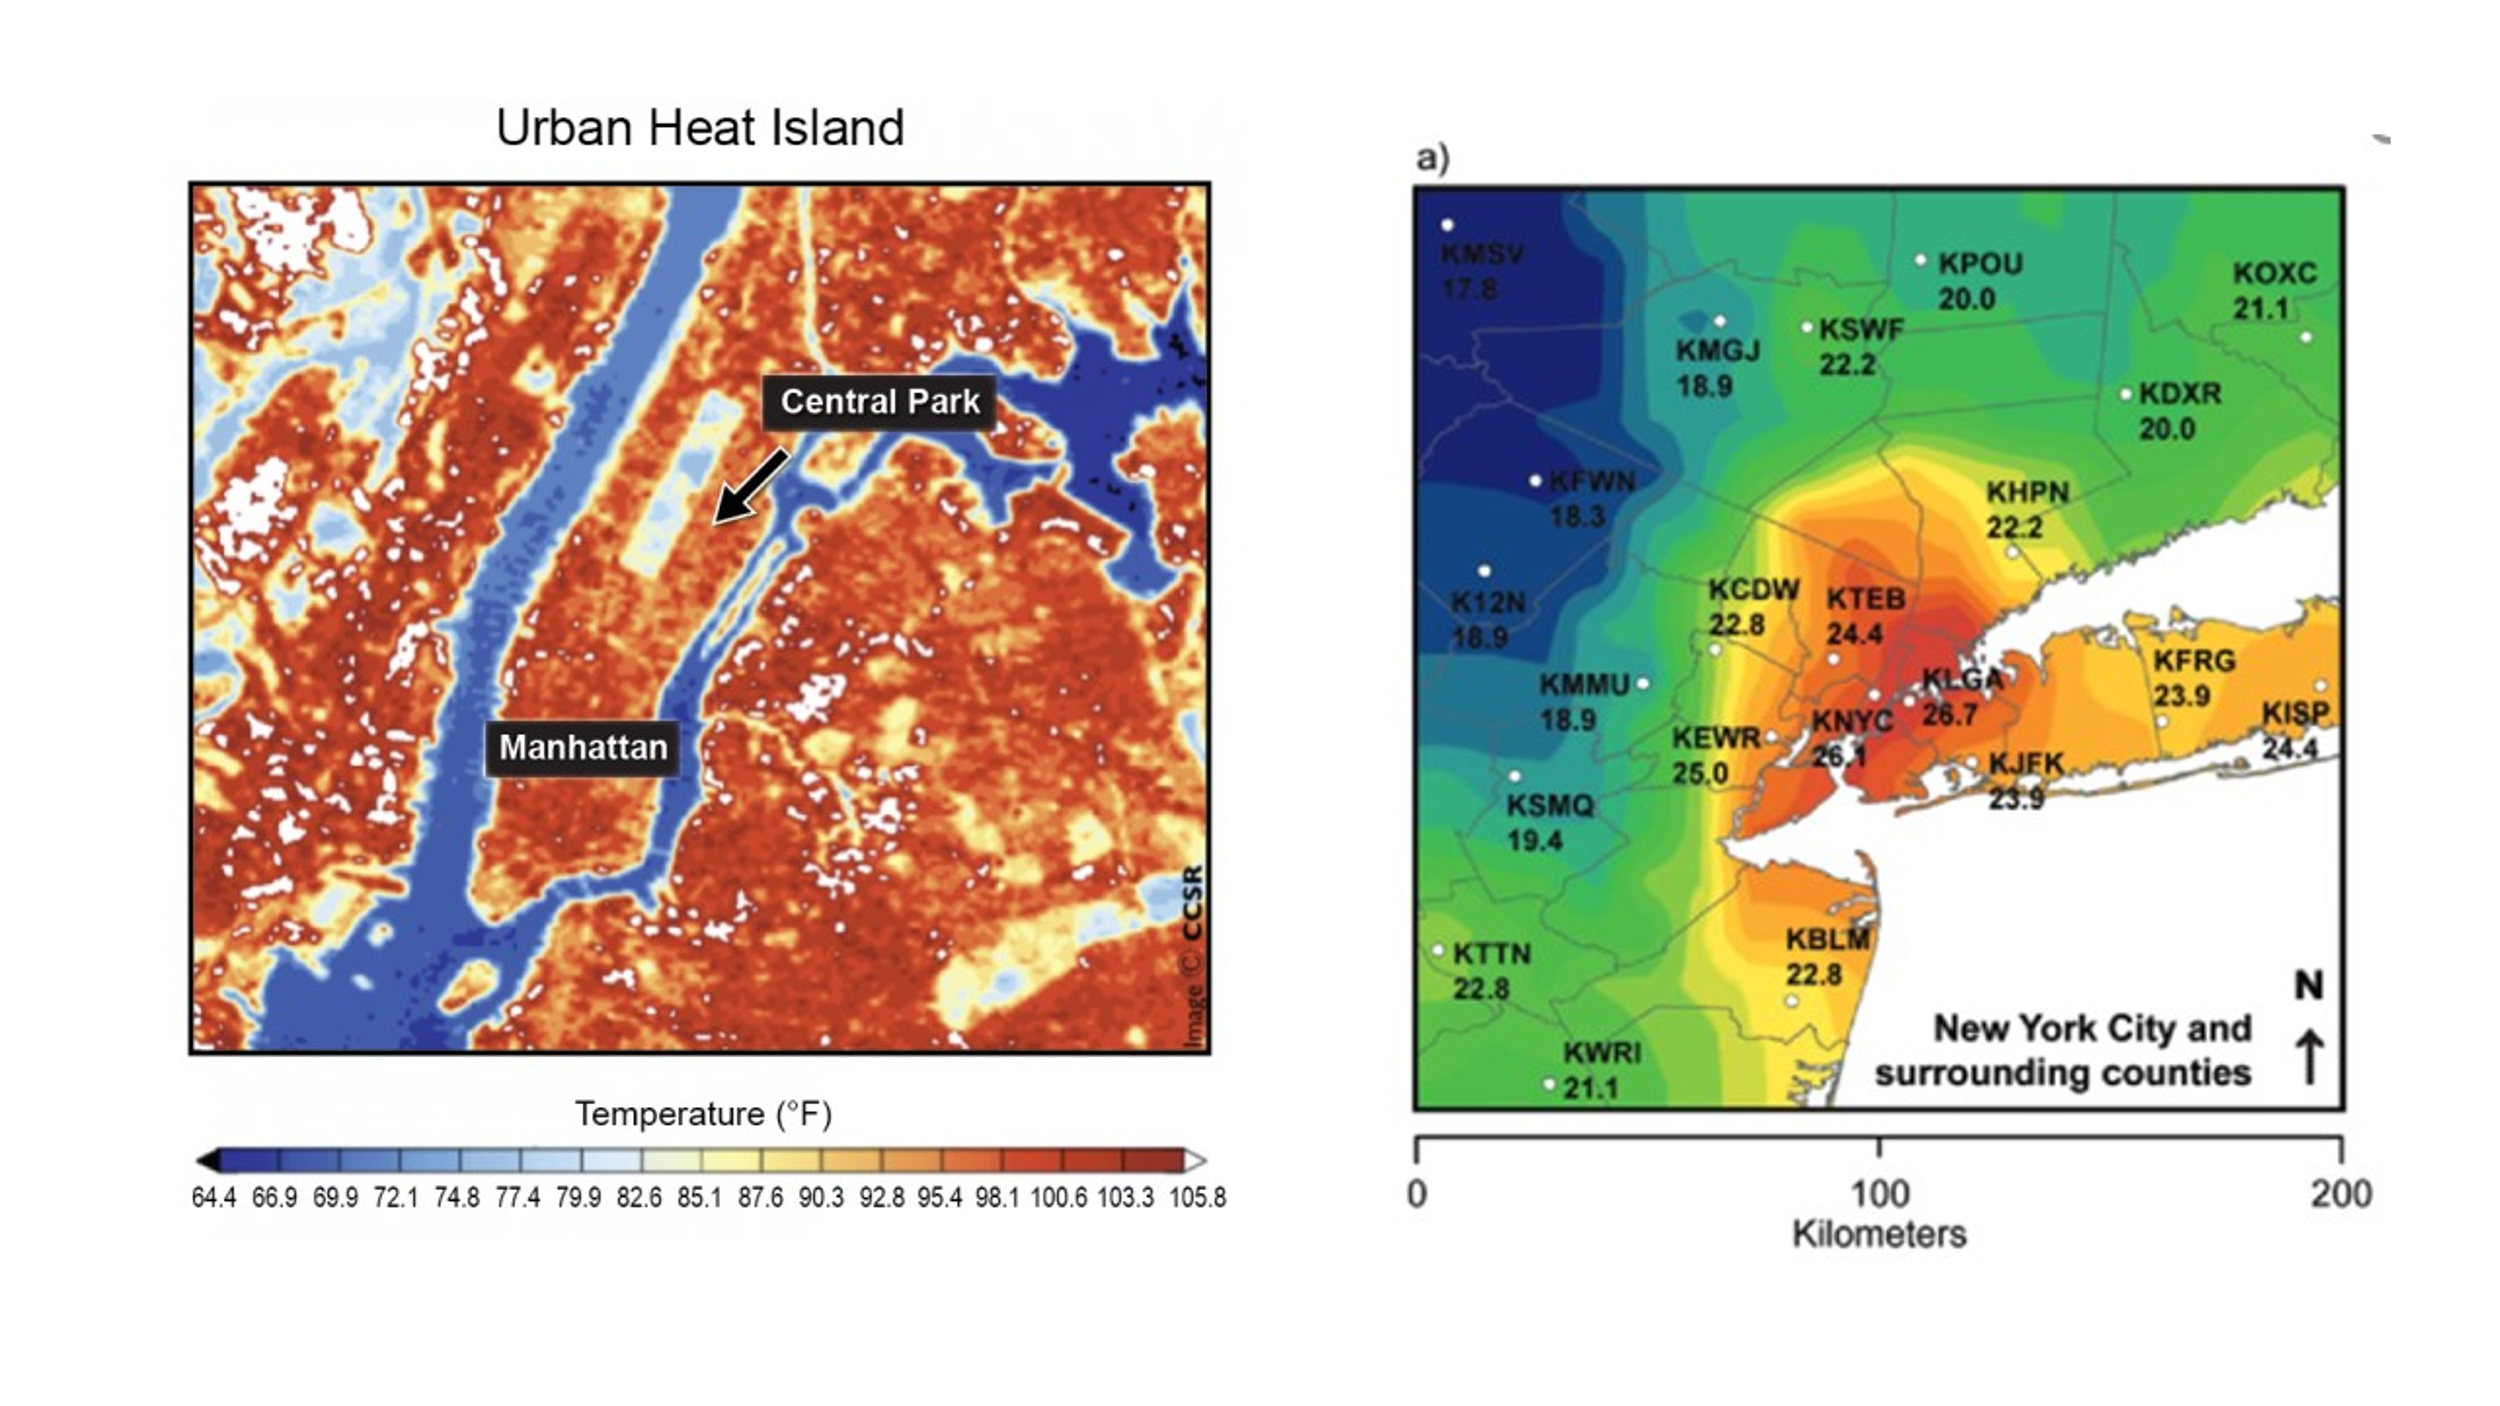
URBAN HEAT ISLAND
The heaviest 1 Sep 2021 rainfall occurred at the Newark, NJ Airport and at Central Park in Manhattan. This seems to line up with some of the hottest areas from Urban Heat Island studies published by the Federal Government and the American Meteorological Society, and shown in Figure 5 below.
IMPERVIOUS URBAN TERRAIN
A study done for the New York City Council shows this Urban Heat Island map, with which I did an eyeball comparison with the google maps of New York City (in this link), both street map and satellite map versions.
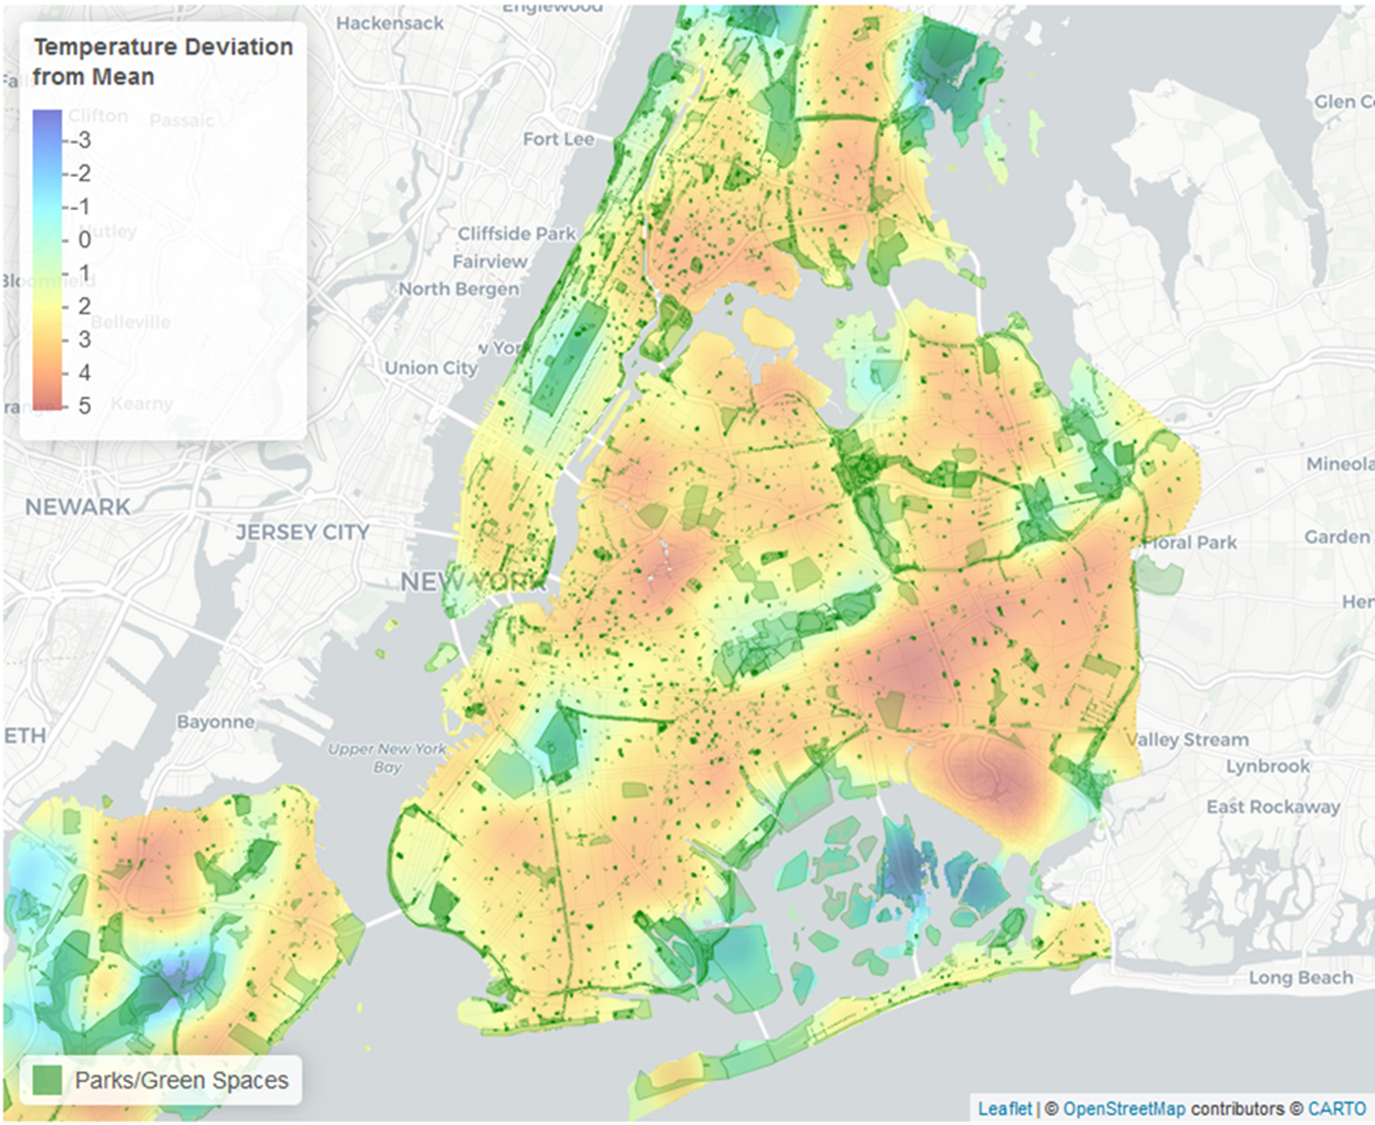
The deep orange-red shading is the area having the highest percentage of urban roofing/sidewalk/streets. The greens match up with cemeteries, creeks, flood plains and parks, from the huge Central Park in Manhattan to smaller city-block sized parks. But the main point is that there are huge city neighborhoods and districts having little green space shown in the deep orange-red tones, and this is where there is very little bare soil available to absorb heavy rainfall, so the vast majority of it runs off.
A local blog, The City, carried “Ida-Deluged NYC Drainage System All But Forgotten in Climate Battle,” which analyzed many of the anthropogenic problems causing the flooding.
“Recent deluges highlight how heavy rains have been largely left out of the equation, experts told THE CITY. Flooding from Ida occurred because an overloaded, century-old drainage system was not built to accommodate that much water, city officials acknowledge…Ida’s downpour — more than 7 inches in all in many parts of the city — overwhelmed a sewer system already hard-pressed to handle run-of-the-mill heavy rain.”
THE ALARMISTS CONTINUE THEIR NARRATIVE: THREE STORIES
ONE
On 14 July 2021 the New York Times ran, “New Data Shows an ‘Extraordinary’ Rise in U.S. Coastal Flooding,” the main theme of which was “Climate change and carbon emissions are a factor at play when we look at how tides are rising.”
This story described rising numbers of sunny-day or high tide flooding in Galveston, TX, Charleston, SC, and Annapolis, MD. I looked at the rate of sea level rise at each of these sites, using the web site https://www.sealevel.info/ , run by my friend from the Climate Change Conferences, Dave Burton.
SeaLevel.info uses tide gage data from NOAA (US, Hawaii, Alaska, and overseas island sites), Permanent Service for Mean Sea Level (headquartered in the UK but analyzing global tide gage data), and CO2 concentrations from the Ice Cores and Mauna Loa.
Charleston has the longest tide gage record of the three sites. I show Charleston’s plot below as an example of how the New York Times makes statements, in quotes above, which clearly depart from the truth.
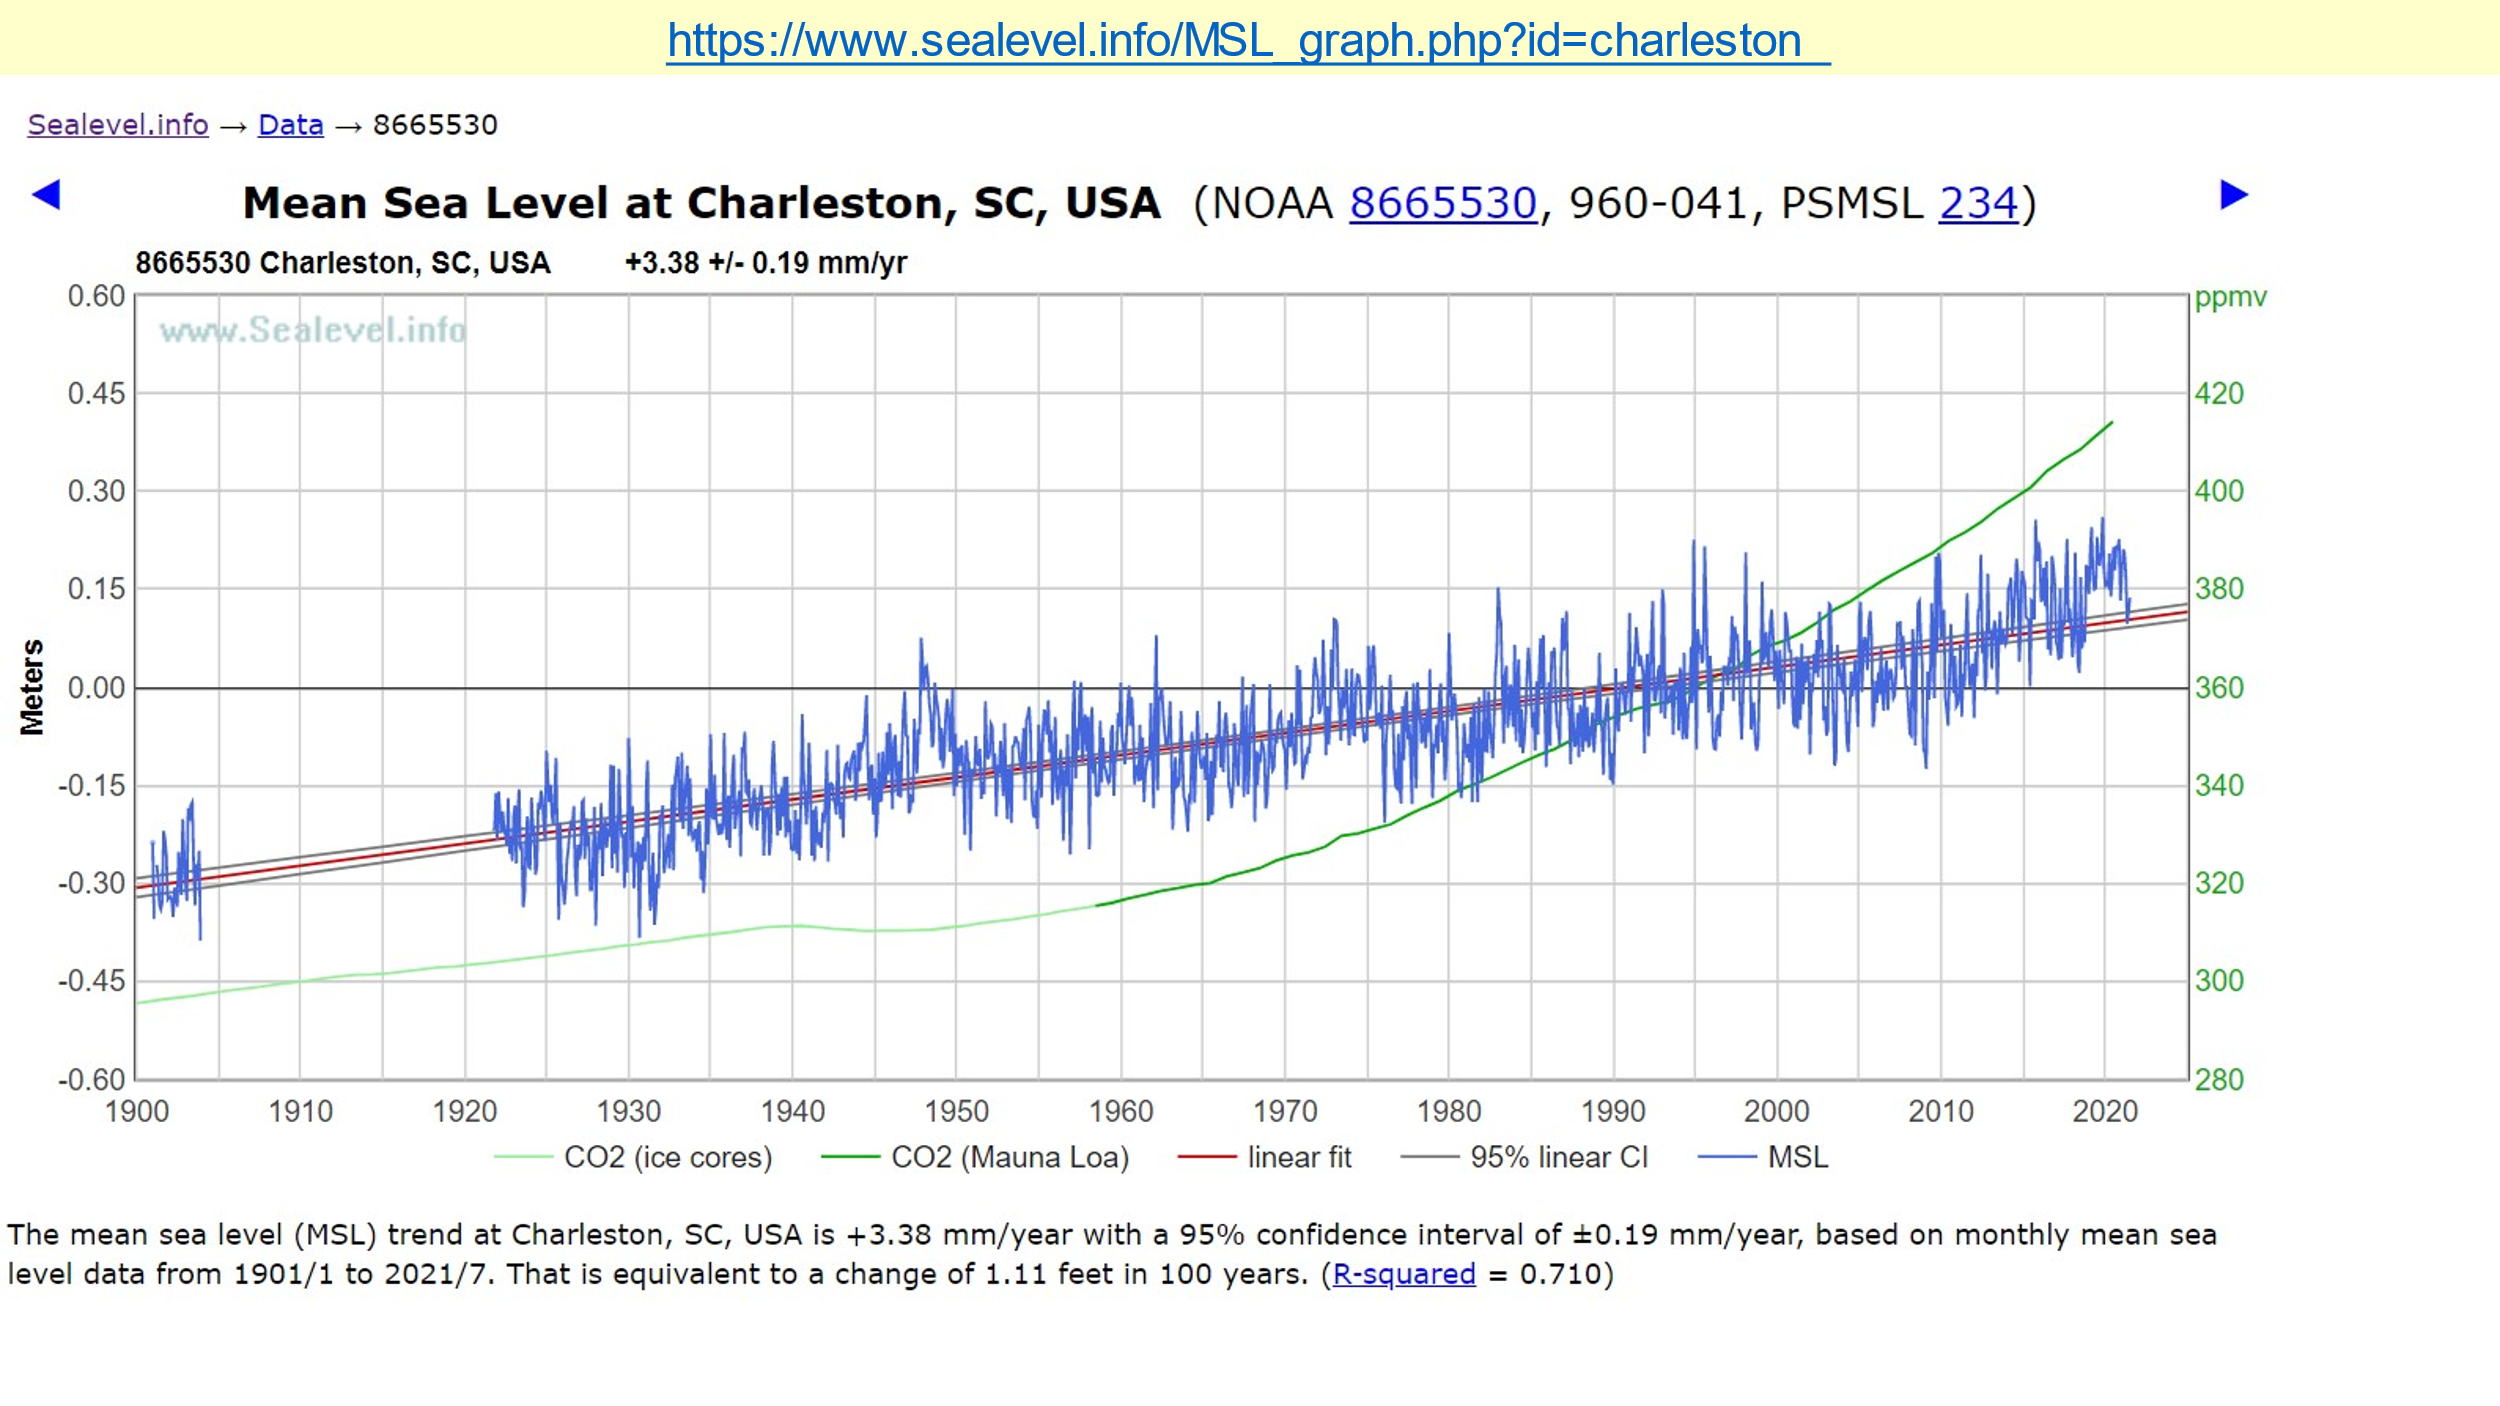
SeaLevel.Info plots each month for which the height of the sea is reported from tide gages, and on the same chart, plots the concentration of CO2 over the same time domain, as determined from the Ice Cores and as determined by the UCSD Laboratory on Mauna Loa on Hawaii.
The rate of sea level rise has not changed at any of the three sites mentioned by the New York Times, or any other location on Earth. The plots of sea level rise over time from SeaLevel.Info for the three sites mentioned by the New York Times show that the rate of change of sea level over time has remained constant over the time domain of the tide gages.
Sea Level is a dynamic property of Earth and has varied widely over the time history of humans on earth, and before. Sea Level was 400 ft. lower than today at the depths of the Wisconsin Ice Age, during which many humans migrated from Asia to North (and later South) America across the Bering Land Bridge. But, sea level was a lot higher than today at the time of the Roman Empire, according to the maps left by the Romans at Ostia Antica, a port of Rome, described in my post, “History falsifies climate alarmist sea level claims,”
So, the New York Times story blaming current sea level rise on “human-caused CO2-fueled climate change” and “carbon emissions,” is manifestly untrue, a falsehood meant to carry on the false narrative blaming natural changes in climate on our use of fossil fuels.
TWO
Another false climate alarm story in the New York Times was run the day after the catastrophic floods of 1 Sep 2021, “Climate Change Is Bankrupting America’s Small Towns.” , which ran on 2 Sep 2021. There were three small towns, all of them on the outer coastal plain of North Carolina, the geography of which is very flat, almost featureless, and which has a very shallow height gradient of the terrain sloping to the Atlantic Ocean. Any North Carolina or nearby landfalling tropical storm or hurricane has the potential to drop copious amounts of rain there. The flat terrain means that any rainfall runoff is sluggish. Towns, especially small towns with little flood infrastructure, are susceptible to and do experience flooding when such tropical storms strike nearby.
Here is a quote from the New York Times story,
“Many <small towns> were already struggling from the decline of the tobacco and textile industries, and the area’s flat terrain makes it especially vulnerable to flooding from powerful hurricanes that are coming more often.”
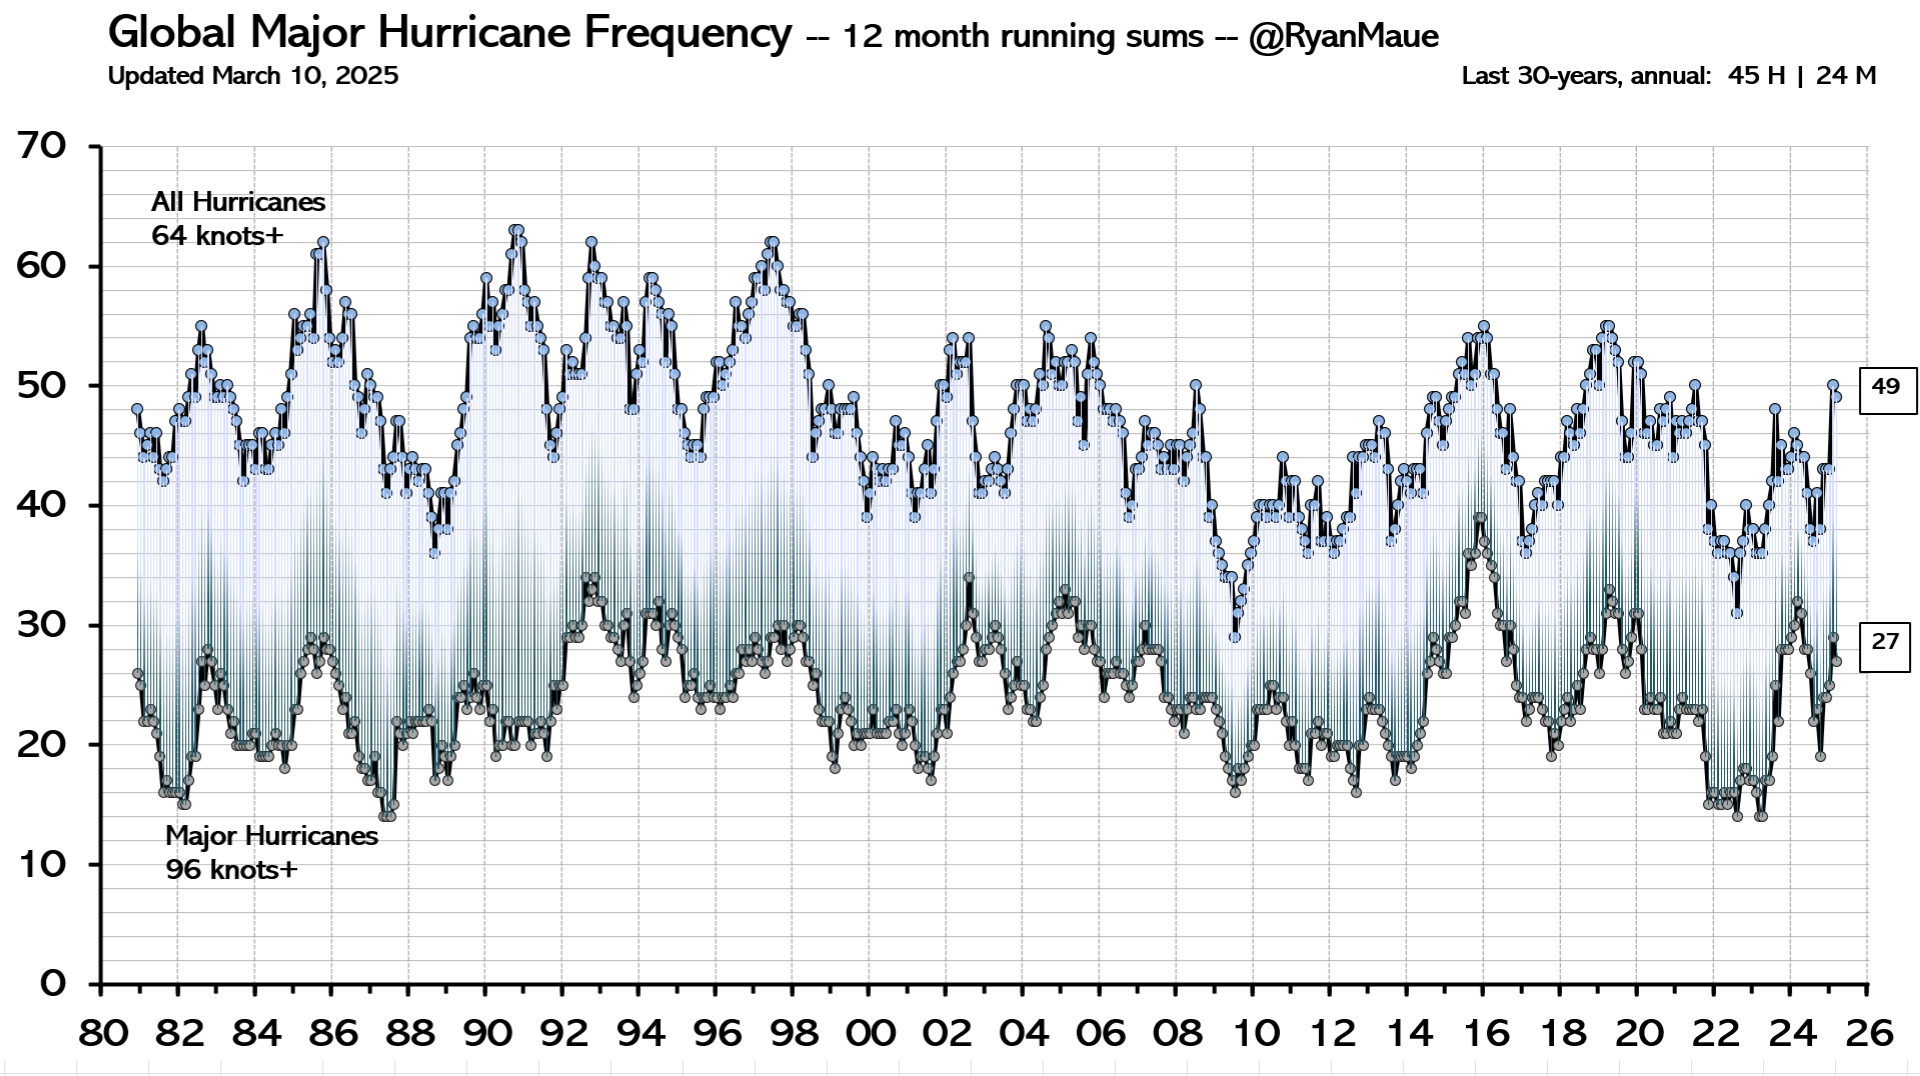
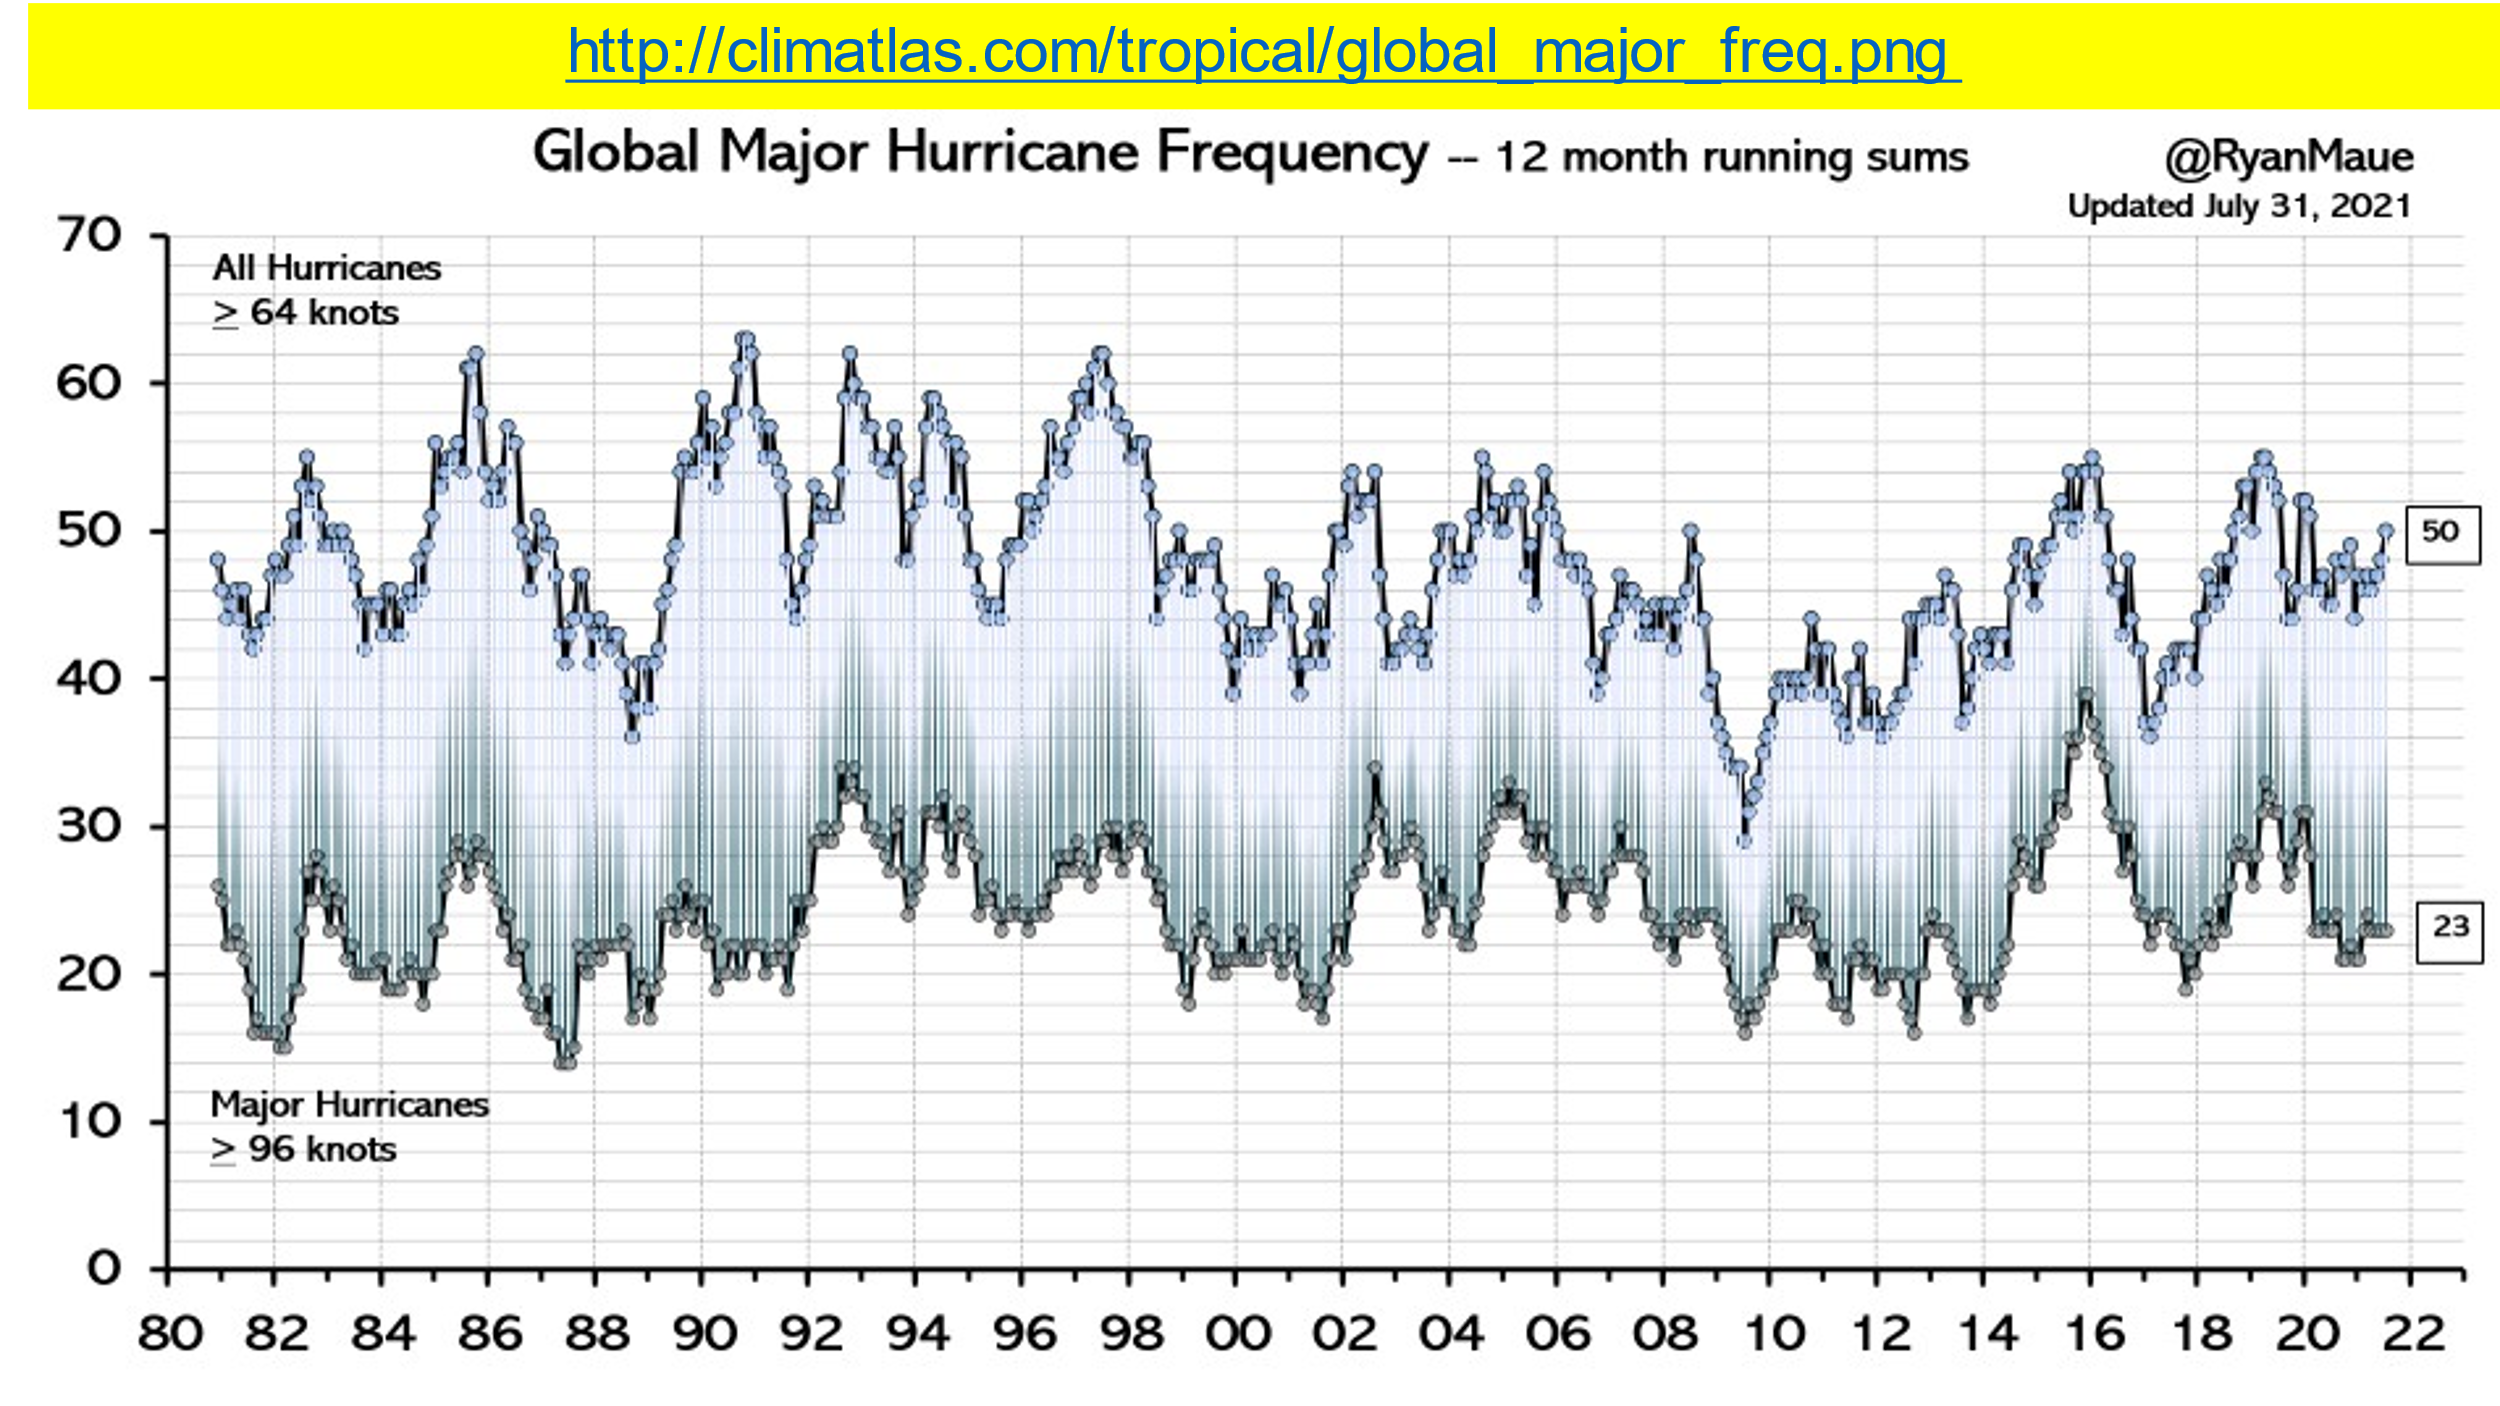
Below, I examine the veracity of that phrase in bold, “…powerful hurricanes that are coming more often,” using Global Major Hurricane Frequency and the plot generated by Meteorologist Ryan Maue.
The New York Times is not alone in this deception. A web site of The Cultural Landscape Foundation featuring Princeville, NC, one of the Times’ “Climate Bankrupting Small Towns” locations, contains this:
“Every year, from June to November, the threat of flood is imminent, and evidence suggests the threat will grow as hurricanes become more frequent and intense.”
However, visitors to that web site will find an image of a flooded main street of Princeville, in 1919, deep enough that several residents are floating in a rowboat, and another image of a house on piers near the Tar River, evidence that flooding has been a long-term problem for Princeville, a large part of which was constructed on the flood plain of the Tar River.
Earth Science students learn, or should learn, that the flood plain of a river is part of the river itself, and not amenable to permanent structures, but rather parks, trails, golf courses, and other recreational areas which can readily survive the inevitable flooding sure to occur.
So, The Cultural Landscape Foundation, TCLF, has fallen into the trap set by the New York Times and other MSM outlets and is unaware that hurricanes are NOT becoming “more frequent and intense.” TCLF’s writers do not look up the facts, a commentary, which, sadly, brings much of what else they have to say into question.
THREE
The third story where Climate Alarmists are “Feeding ‘The Narrative’” is “Summer 2021 Was Hottest on Record in the Contiguous U.S., NOAA Says”. I have my serious doubts about many of the NOAA claims, especially after seeing the problems with most of the surface observations of temperature being contaminated by Urban Heat Island and thermometer exposures not in accordance with the WMO exposure standards, as I describe in my class lesson https://casf.me/wp-content/uploads/2019/10/Three-Lessons-in-Surface-Temperatures____9_Oct_2019.pdf. So, not only is “our own” (in Las Cruces, NM) NMSU on-campus thermometer not in accordance with the WMO standards, most thermometers used in the US for record purposes do not meet NOAA’S standards, which are the same as the WMO standards. This situation is very well described by Anthony Watts in, “Is the US Surface Temperature Record Reliable?” .
To correct the endemic difficulties with so many thermometers, the US constructed the US Climate Reference Network, USCRN, in their own words, an “unimpeachable” system of sensors designed specifically to avoid the UHI and sensor exposure difficulties. The trouble is, while the data are available if you know exactly how to find the precise internet location, it seems as if NOAA goes to great effort to avoid having the data findable through ordinary internet search.
I do have the data; it’s plotted in Figure 9 below. Plot it yourself with this link.
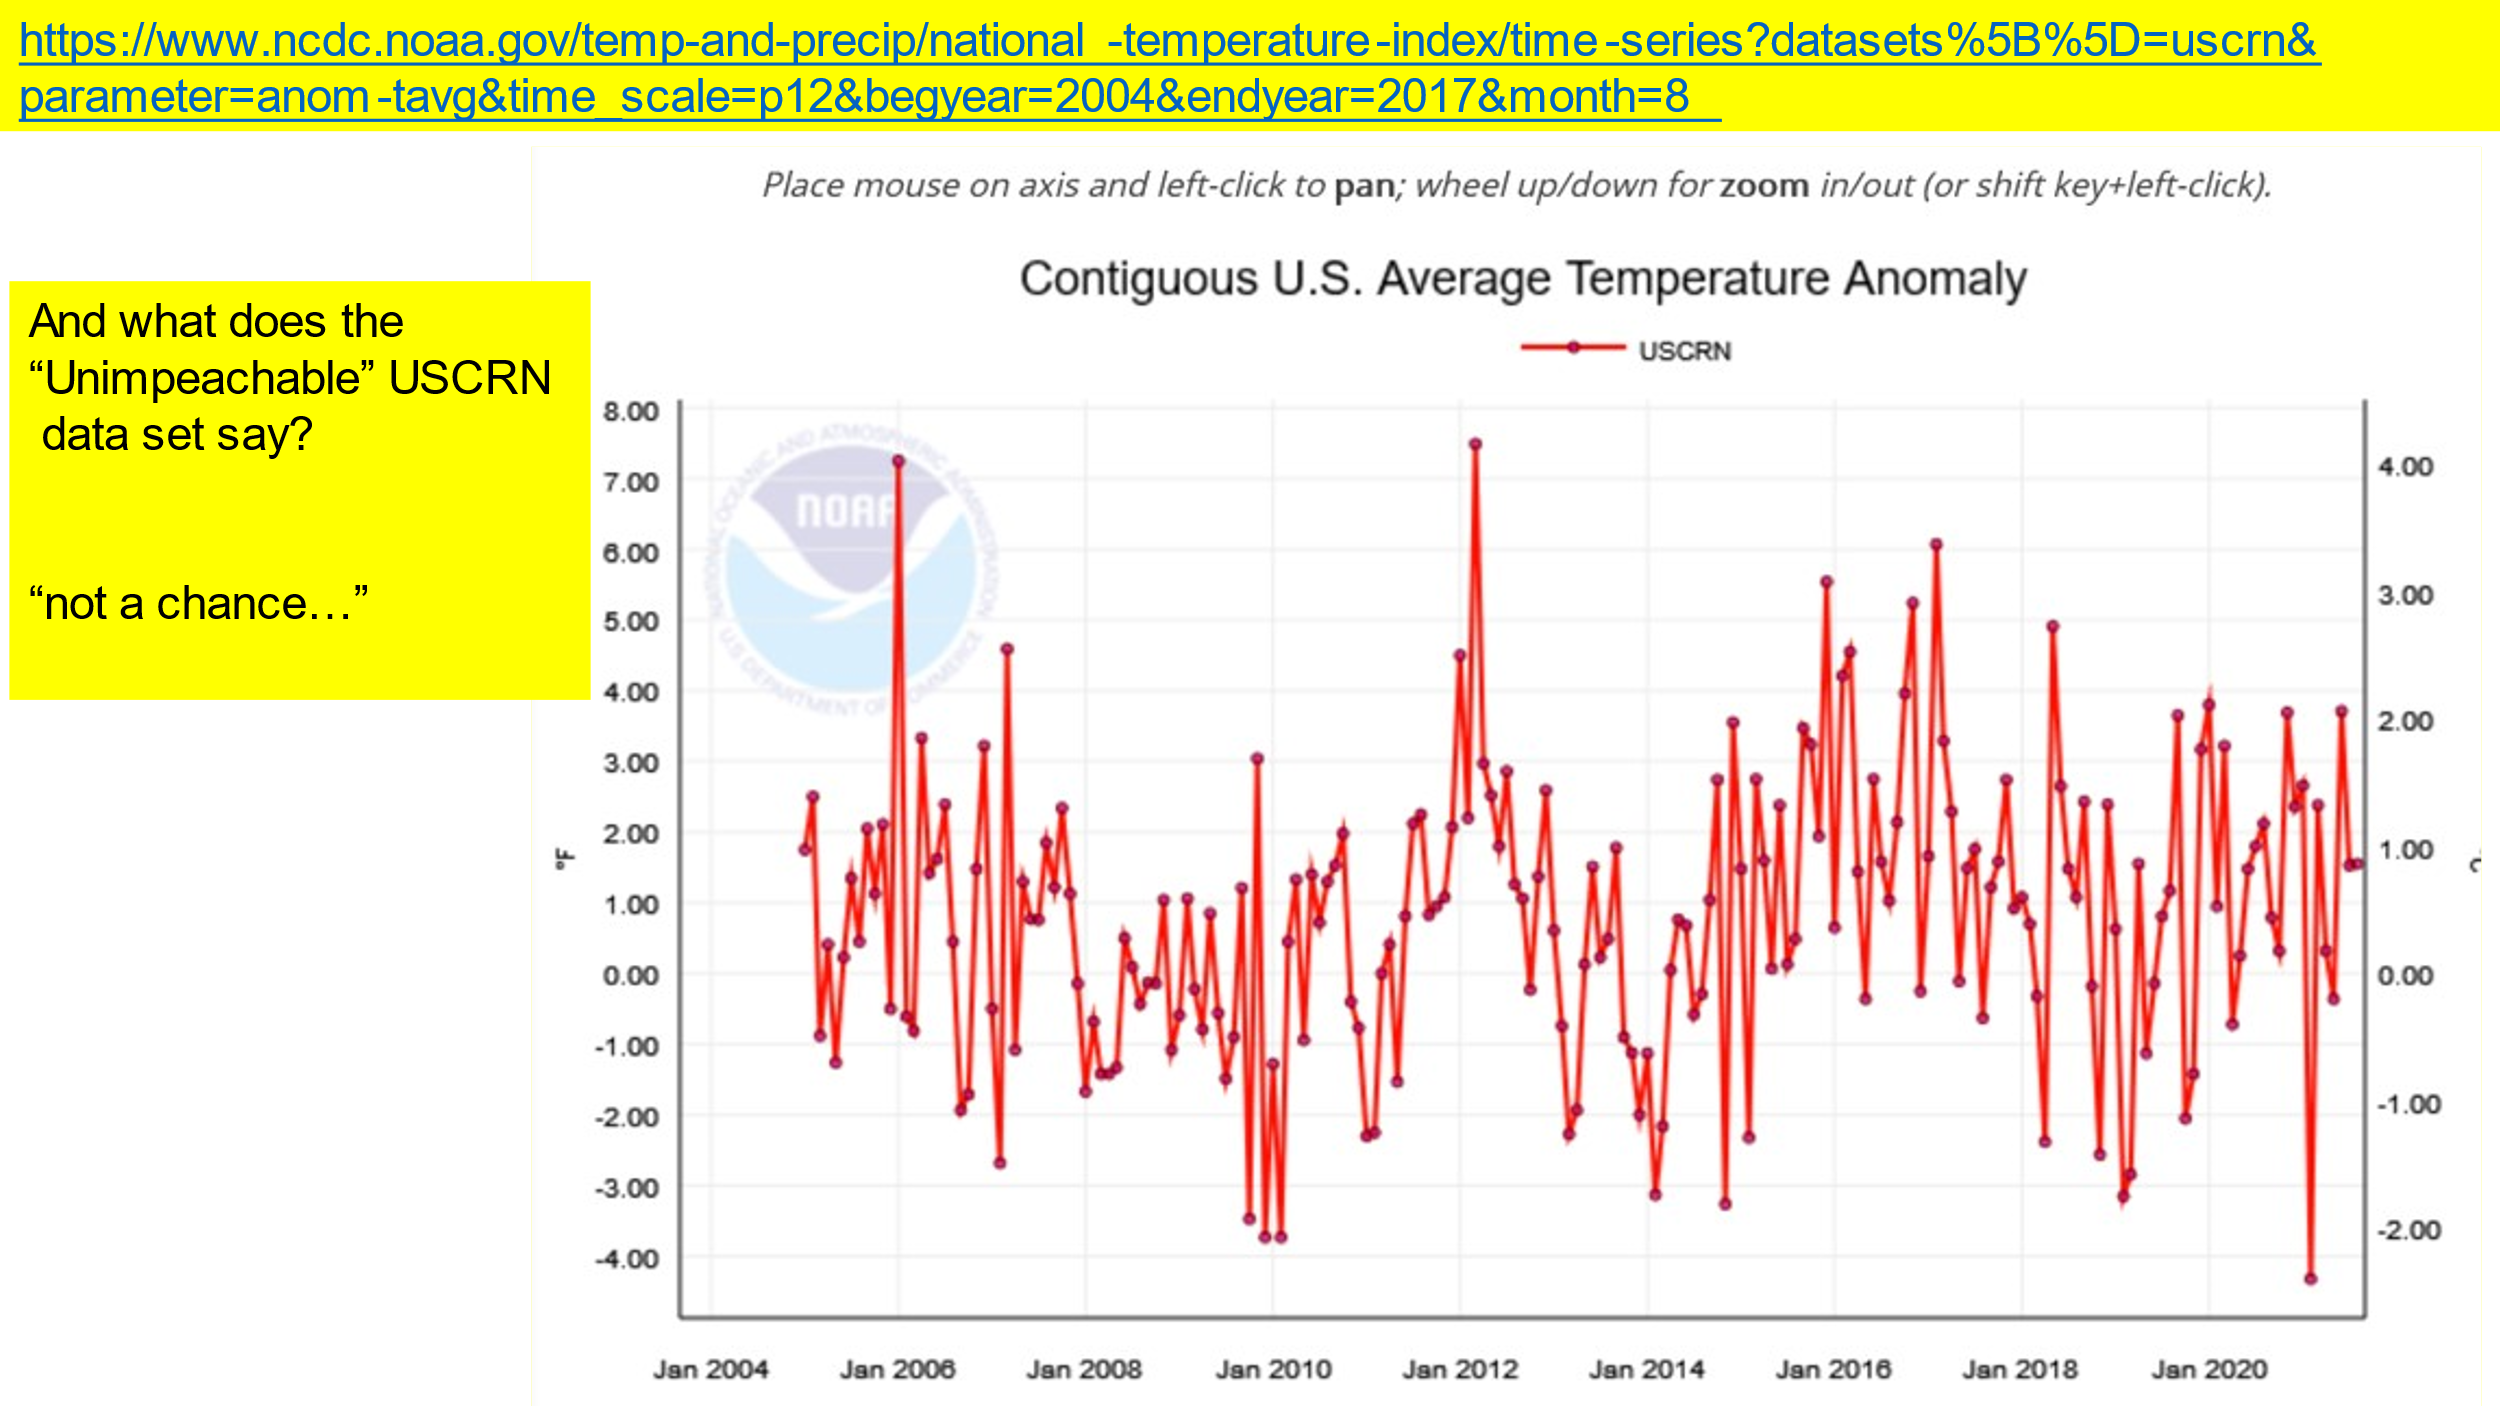
While the USCRN time series does not go back the entire 126 years that the NOAA story cites, going back only to 2005, the USCRN time series, plotted in Figure 9 above, shows that the summer of 2021 is nowhere near the warmest since 2005, let alone since 1895 (126 years ago) and by eyeball estimate, is close to the average since 2005.
SUMMARY: Post-Hurricane Ida’s Effects on New York City
To sum up Metro New York’s urban flooding the evening of 1 Sep 2021: Natural phenomena brought extremely heavy rain, and excessive runoff to NYC on 1 Sep 2021. Just offshore, water temperatures, warmest of the year, brought warm water vapor to fuel the thunderstorms which had been forecast well in advance. A warm front lifted the air as it reached NYC which enhanced the strong upward vertical motion as remnants of Ida became an “extratropical” (cool/cold season) storm.
The center of low pressure which had been Hurricane Ida and the warm front reached NYC late afternoon, the usual time of maximum temperature for the day. The Urban Heat Island added more heat to the storm, which could have added an estimated 10 to 15C at the surface, according to an EPA study.
As advertised by forecasters, thunderstorms brought extreme upward vertical motion, heavy rainfall, even tornadoes. In parts of the NYC Metro Area, rainfall exceeded 8 inches, and most of it ran off into “an overloaded century-old drainage system <which> was not built to accommodate that much water.”
THIS is the story of the NYC Metro area flooding the evening of 1 Sep 2021, NOT human-caused CO2-fueled global warming.
The first New York Times story says that Carbon Dioxide and the resultant Human-Caused CO2-fueled Global Warming is driving clear-sky high tide flooding of Galveston TX, Annapolis, MD, and Charleston, SC. We have tide gage records since January 1856, when Franklin Pearce was President of the US, and well before the US Civil War. Sea levels have been rising since before 1856, when the tide gage, at The Battery, Manhattan, New York, began recording tides and sea levels. The rate of change of sea level rise has not changed in the ensuing years, neither at the Battery, nor anywhere in the world, despite Carbon Dioxide’s concentrations having risen from about 282 Parts Per Million, PPM, in 1856 to about 414 PPM today in 2021. So, the clear-sky flooding is a consequence of long-term sea level rise, likely ongoing for hundreds of years, but our use of fossil fuels and the increase in CO2 concentrations has not affected the rate of sea level rise.
The second New York Times story says that “Climate Change Is Bankrupting America’s Small Towns,” because, “…powerful hurricanes…are coming more often.” Meteorologist Ryan Maue has collected much data with respect to US and global tropical storm and hurricane numbers, winds and kinetic energy of the storm winds, and other statistics since 1970, when weather satellite data became more systematic and reliable. My Figure 8 plot, derived from Maue’s data sets, shows clearly that hurricanes and major hurricanes numbers peaked in the 1990s, and that the Times’ claim that “powerful hurricanes are coming more often” is demonstrably false.
NOAA’s claim that the Summer of 2021 was the hottest in the CONUS is laughable. NOAA does not admit that most of its temperatures are flawed by urban heat island effects and poor exposure, demonstrated at http://surfacestations.org/ where it shows that only 11% of stations meet the WMO criteria for temperatures. Eleven percent of stations have exposures which exceed 5C by NOAA’s own standards, and most stations have greater than 2C error.
The system of sensors designed by NOAA to be “unimpeachable,” their word describing the USCRN, has a temperature time series for the continental USA since 2005. Those data, plotted in Figure 9, show that Summer 2021’s temperatures, the last three months plotted in Figure 9, is nowhere near the warmest since 2005, let alone since 1895 when systematic temperatures started to be recorded in the Continental USA. To repeat, the NOAA claim, Summer 2021 was hottest on record in the CONUS, is laughable.
I learned the standards of academic research beginning in my Junior Year of High School with my first term paper in Spring 1957, repeated many times at Rutgers, where I graduated in 1962 with a Bachelors in Geology, and again with a Masters, in Meteorology in 1969, at The Pennsylvania State University. Those standards include looking up published references and including the results of that research in your writing. Those standards seem to have been forgotten by many in The Academy, the Mainstream Media, and Government, or were never learned. Editors used to be guardians of quality control in print media, but that seems so long ago. Clearly the requisite practice of looking things up to ensure factual correctness, curiosity about the world we live in, and critical thinking seemingly have disappeared from much published today. I hope this post provides a refreshing departure from that current practice.