
Robert W. Endlich
In late June 2021 a well-publicized heat wave occurred in the Pacific Northwest states of the USA. I write this review a year later with a full year having passed for retrospection to examine what happened, in hopes that we might learn some lessons.
One NPR story captured a headline and narrative that puts many elements of Global Warming Alarmism up for critical examination. The headline,
“Climate Change Is Driving Deadly Weather Disasters From Arizona To Mumbai,”
dated 29 Jul 2021 introduces a storyline put forth by NPR’s Climate Team members Lauren Sommer and Rebecca Hersher. Critical examination of that storyline, which first asks,
“What does this mean for wildfires?”
and NPR’s subsequent exposition do not stand up to thoughtful and critical scrutiny.
Specifically, NPR does not come close to explaining the two important drivers of western wildfires, the present climate we have, especially in the mountain West and the Spotted Owl Decision of the 1990s.
THE PRESENT CLIMATE WE HAVE
Repeating that NPR question,
“ ’What does this mean for wildfires?’ About 95% of the West is in drought right now, and there’s a clear cycle where heat dries out land and vegetation.”
This NPR Claim is just wrong. There are four deserts in the US West: Chihuahuan, Sonoran, Great Basin, and Mojave. All lie downwind of the coast mountain ranges of California, Oregon, and Washington, and storms in the westerly wind band (winds from the west) dry out, with copious rainfall on the windward side and a wind shadow on the lee side or the eastern side, so dry periods are typical for this region. So, it is not heat which dries out the land and vegetation, it is a 60-year-long weather event called the Pacific Decadal Oscillation (PDO for short) containing over 20-30 years of rainy periods and 20-30 years of more droughts. This natural cycle is driven by water temperature patterns in the Pacific Ocean; there’s a good explanation of it on our web site.
In New Mexico, we can see this pattern in the water levels in the state’s largest water body, Elephant Butte Reservoir. The 1950s and 1960s droughts left Elephant Butte with water amounts less than 1% for long periods of time, with the extreme low set on 6 August 1954 when the lake was down to 0.1% of capacity. The data are here. Contrast that with the copious rainfall of the 1980s and 1990s when Elephant Butte was full or nearly full for twenty years.
So, it is not “heat drying out the land and vegetation.” It is the change from PDO-Warm, which is wet for the mountain West, to PDO-Cold, which is dry for the mountain West.
NPR is completely ignorant of this natural climate cycle. The return of the droughts of 2000-2022 is merely a return to the same dry phase which brought the 1950s droughts to the mountain West.
THE SPOTTED OWL DECISION
The Spotted Owl Decision of the early 1990s was an important driver of these later events. In 1990 the Spotted Owl was declared “Threatened” under the Endangered Species Act. In 1991, a Court Order halted logging on national forests in Northern California, Oregon, and Washington on grounds those forests were prime spotted owl habitats. (The Spotted Owl Listing also has halted logging here in New Mexico.) As a result, logging all but stopped in the west.
Up until 1999, the cycle was “PDO-warm” which brought copious snowfall and rainfall to the mountain West. In New Mexico, it was also quite wet and the state’s largest lake, Elephant Butte Reservoir, was full or almost full during the PDO-warm of the 1980s and 1990s.
In 1999 the cycle switched to “PDO-cold”, which brought more La Nina events and widespread droughts to the mountain West. With little logging, forest fuel loads went up dramatically, and continued this upward spiral. And, since fire is part of the natural environment, forest fires often became difficult-to-impossible to contain because of the huge fuel loads.
SIDEBAR ON THE SPOTTED OWL DECISION
Here is a side note on the notion of “settled science,” a term often used by the Mainstream Media when it comes to climate and climate-related subjects.
An examination of the literature finds this report dated 23 May 2021, from the USGS,
“Range-wide declines of northern spotted owl populations in the Pacific Northwest: A meta-analysis.”
This report describes how the Barred Owl is out-competing the Northern Spotted Owl in the study area which covers the forested areas from north of San Francisco, CA, to Seattle, WA. This sentence from the lead says it all,
“Analysis of spotted and barred owl detections … (with) barred owl presence increasing territorial extinction and decreasing territorial colonization of spotted owls.”
All that effort and economic damage from a faulty Court Order based on poor understanding of the natural world, all those sawmills closed, and all the sawmill-dependent businesses, towns, and family groups devastated, all those lands subsequently damaged by high fuel load-fed forest fires, and the Spotted Owl Listing and subsequent Court Order and this decision caused even more population losses for the northern Spotted Owl.
STORY ERRORS FROM NPR
This quote is from a companion article from NPR:
“The country is experiencing yet another heat wave this week. Is it just us or is this summer unusual? It’s not just our memories — this past June was the hottest June recorded in the U.S. in more than a century, about four degrees hotter on average.” (bold added)
If we think critically about the bolded phrase above, literally it says that more than a century ago it was hotter with a lot less CO2 in the air.
Several thoughts from just this segment come to mind:
1. The notion that CO2 controls temperature is false.
2. The notion that controlling emissions of CO2 can control weather events such as heat waves also seems false.
3. NPR hopes that its readers do not think critically.
MORE ERRORS FROM NPR
“What does a hotter Earth have to do with flash flooding?”
“It’s been a wild few weeks for flash flood disasters, from Central China to western Europe to Mumbai to Arizona….Even though these floods happened around their world, their root cause was the same: extreme rain. And it’s getting more common as the Earth gets warmer.”
Here is that question, again:
“What does a hotter Earth have to do with flash flooding?”
The answer is, Nothing, if you look at the data.
The following two graphics show how false NPR’s claims are:
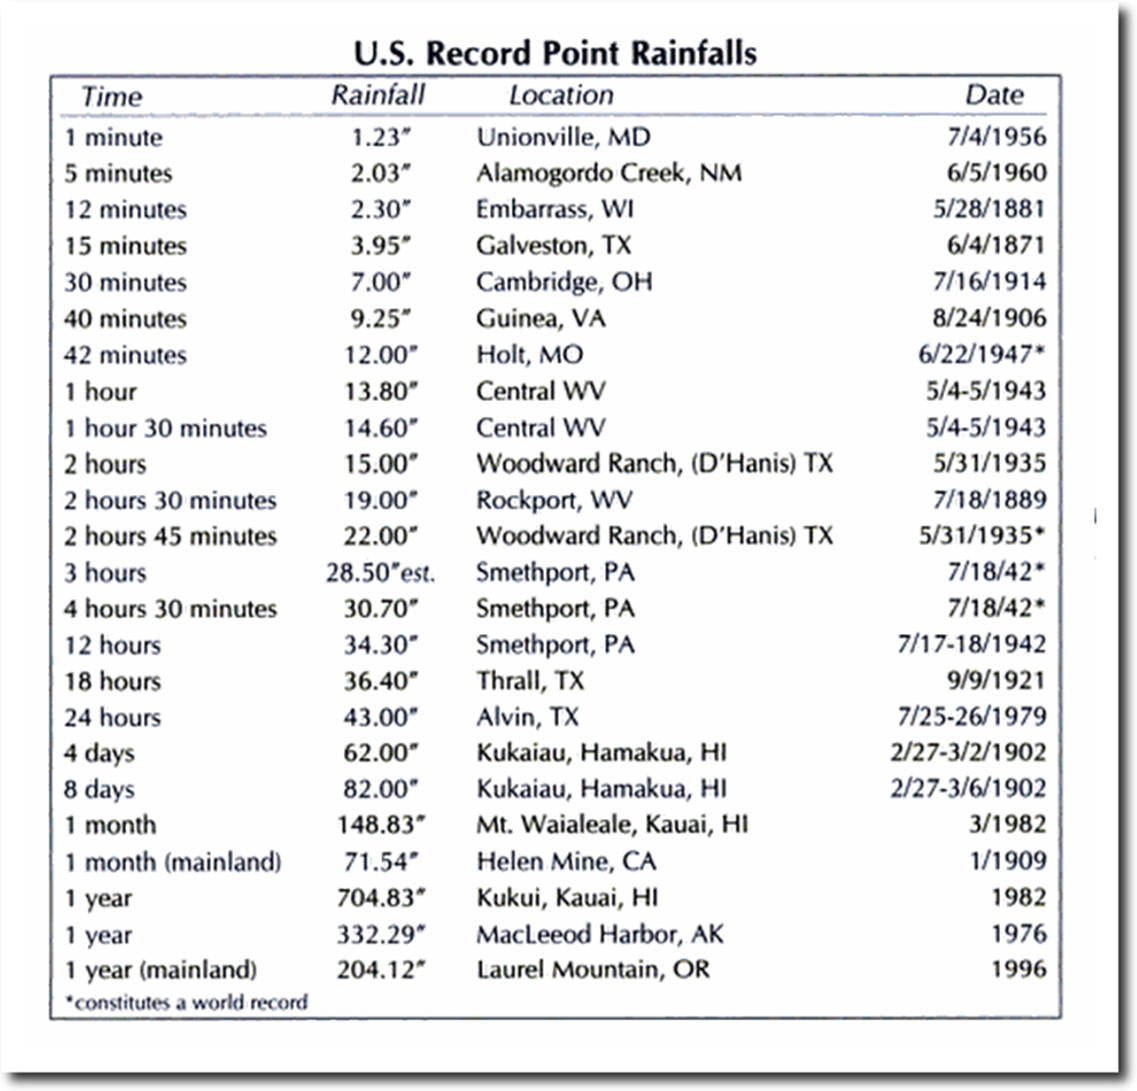
Notice that the records for the Continental United States starts at one minute and go to 24 hours, then one month and a year. There are no modern records anywhere in the USA. The last time a record was set was the twenty-four-hour record, in July 1979, at Alvin, TX, 43 years ago.
Another source for the possibility of modern increases in extreme rainfall in the UK might come from long time series rainfall reports in the UK from the frequent posts on rainfall data from the UK’s Met Office, in Paul Homewood’s blog, Not A Lot of People Know That. But, when you look at long time series, in the UK they go back to 1766, no modern increases in extreme rainfall are found.
Here is a long duration UK rainfall time series:
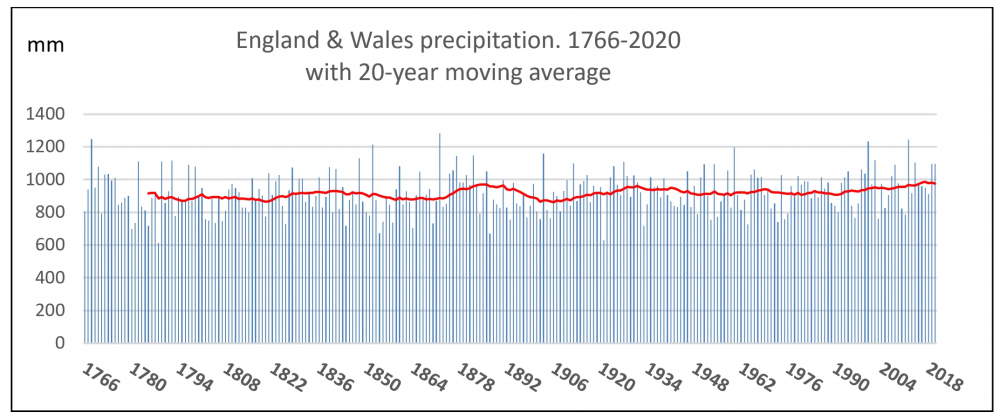
Maybe NPR’s belief that extreme rainfall events are increasing because of the 1990s modernization of rainfall collection in the US’ National Weather Service, a modernization which improved the “catch efficiency” of rainfall measuring devices and posted on our web site. In any event as the temperatures have unsteadily increased in recent years after having fallen from about 1941-1976; there are no modern extreme rainfall events despite NPR’s claims of such.
A GOOD EXPLAINER: A RARE WEATHER EVENT
University of Washington Atmospheric Sciences Professor Cliff Mass’s analysis of the late June heatwave in the Pacific Northwest is published in his eponymous blog, Cliff Mass Weather Blog. Mass blurts out the truth: this was a rare weather event, not a climate catastrophe. Specifically, his post, “Was Global Warming The Cause of the Great Northwest Heatwave? Science Says No,” tells the story of this weather event, which was forecast days in advance.
I strongly recommend reading Cliff Mass’ post.
The map below shows the weather setup for this event, showing features at the 500-millibar level, a favorite tool of mine and most meteorologists involved in operational weather forecasting:
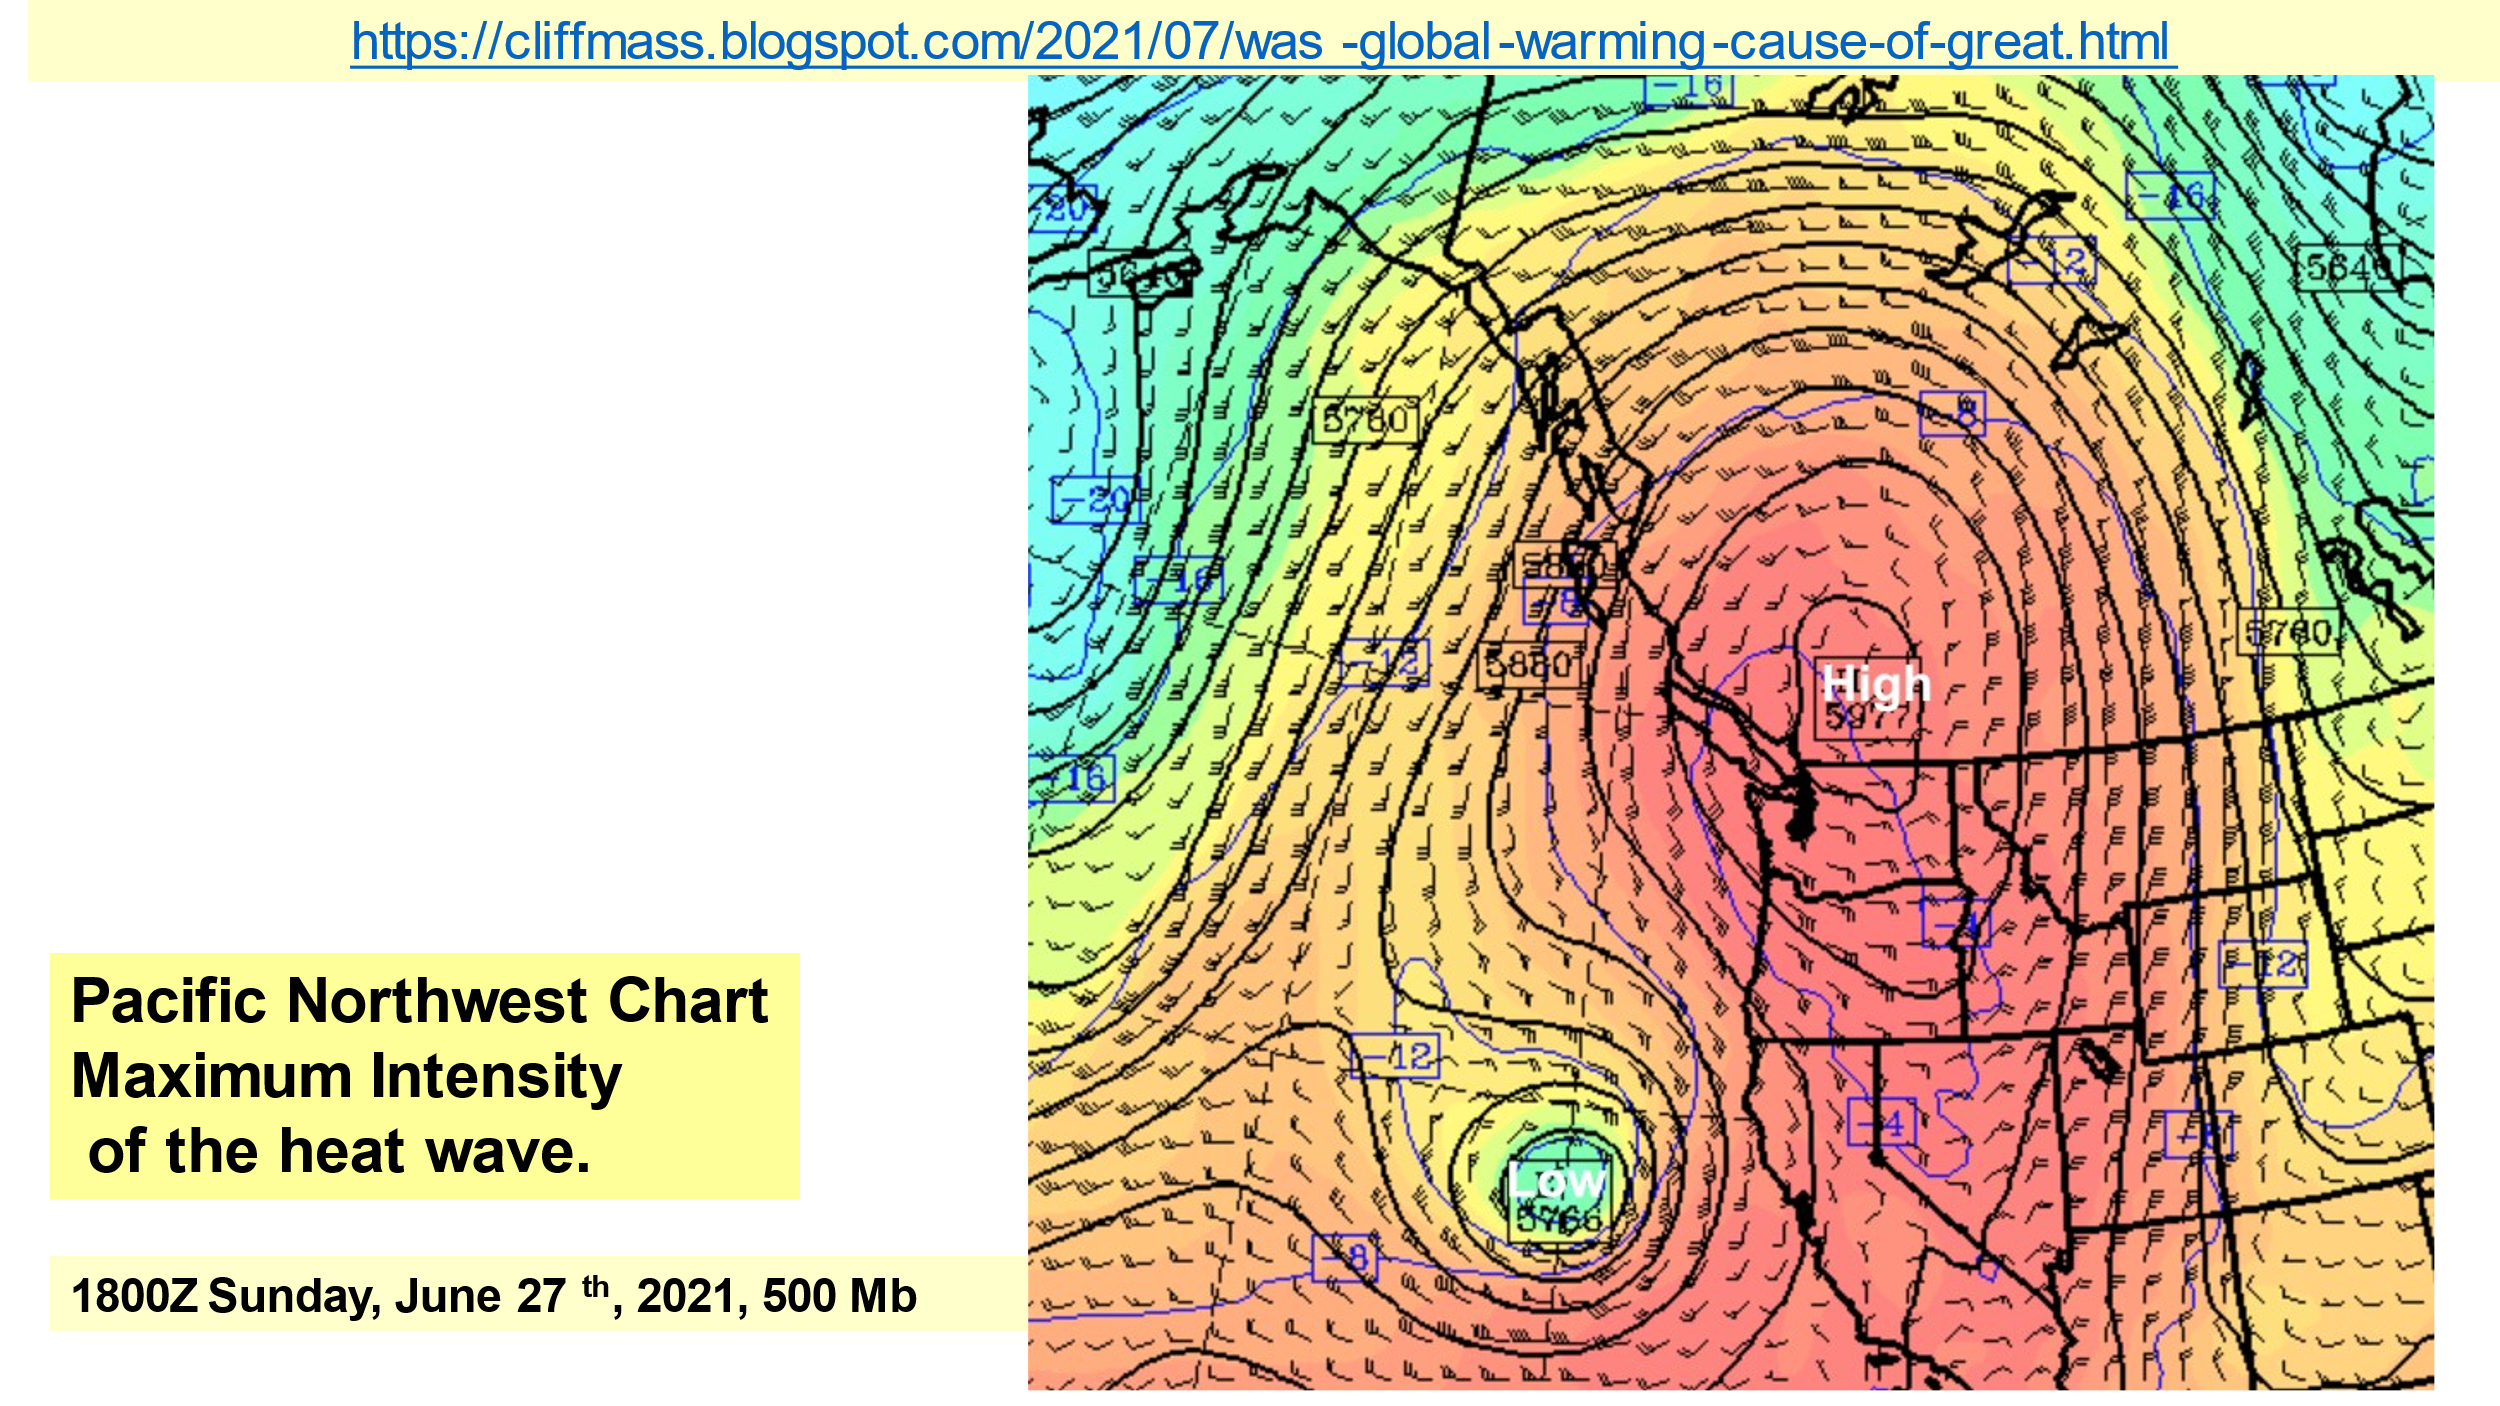
Please note in Figure 3 above, the black contour line which impinges on North America near San Francisco Bay, loops out over the easternmost Pacific Ocean then loops over much of British Columbia, and exits into the Pacific Ocean between Lompoc and Los Angeles. It is in the shape of a huge Omega, and in fact, these atmospheric structures are called Omega Blocks. There is a closed Low pressure off the California coast and another one hinted at with the greenish blue color in the upper right of Figure 3.
In CASF, we saw this before, in Europe in the summer of 2019 as in Figure 4, below.
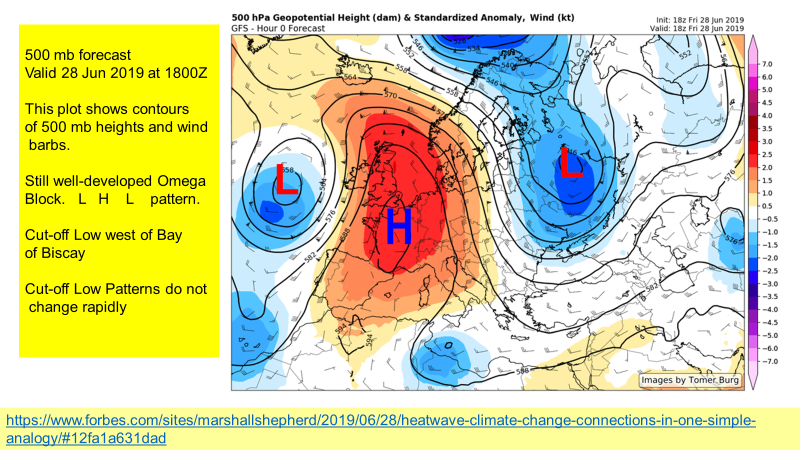
These Omega Blocks with the upper air L H L pattern, for Low-High-Low, are rare events in the jet stream pattern but, even though rare, are features which our large-scale operational weather forecast models pick up accurately, giving forecasters ample time to advertise upcoming extremely warm conditions well in advance.
The severity of these events is enhanced not by more atmospheric CO2, but by their occurrence near the summer solstice when the intensity of sunlight heating the ground surface is very nearly the most extreme intensity of the year. This strong heating of the surface drives vertical convection of the resulting hot air away from the surface in thermals; the ensuing vertical transport of heat from the surface causes intensification of the high-pressure cell aloft, the most important element in formation of the Omega Block.
A YEAR HAS PASSED. WHAT’S IMPORTANT?
The presentation graphics, in many of slides 34 to 42, show NOAA’s new format to display more information about extreme maximum temperatures (and other weather elements for which these records are kept) are shown in a more pleasing and easier to understand visual presentation.
Slide 35 from the presentation graphics shows that 109F was the highest temperature recorded in Maryland, first occurring in 1898, three occurrences in two separate days in 1918, and two occurrences of 109F on 10 Jul 1936. This points to the observation that the extreme maximum surface temperatures occur in discrete weather events.
Slide 37 shows that the extreme maximum surface temperature for Texas, New Mexico, Arizona, and Nevada were all set within a 48-hour period, between 27 and 29 July 1994. A New York Times article on 30 Jun 1994 said the cause was “A vast bubble of hot air stalled over the Southwestern States,” pointing to this being a distinct weather event, not rising CO2 levels.
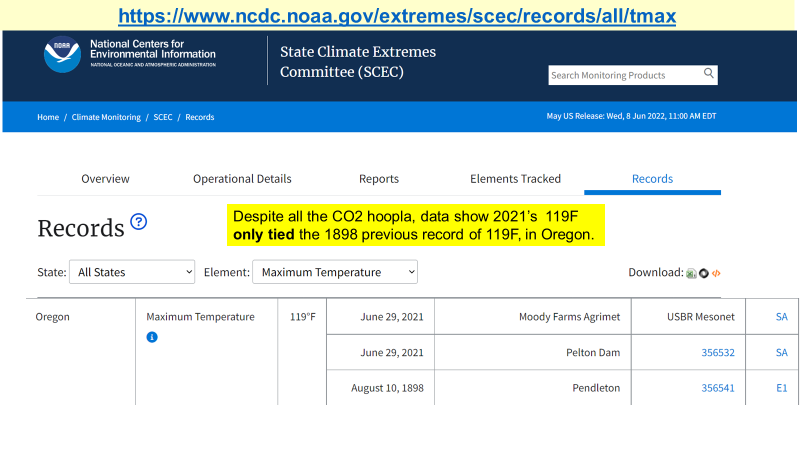
Presentation slide 40, shown below as Figure 5, shows the NOAA extreme maximum temperature graphic for Oregon, displaying the 29 June 2021 maximum temperature in the context of the entire temperature time series for Oregon. Despite NPR’s hoopla on the nature of the CO2-enhanced climate and increased temperatures, the hot 29 Jun 2021 event only tied the 119F set in 1898.
Yes, it was hot in the Pacific Northwest during the period that Omega Block caused easterly downslope winds from the Cascades into Western Washington. But it was over in eastern Washington at Hanford, at the Department of Energy’s site, that a new extreme high temperature record was set, 120F on 29 Jun 2021, which exceeded the previous record set in 1961, at 118F.
TO WRAP UP
Climate alarmists had quite the field day claiming the hot temperatures around 29 Jun 2021 in the Pacific Northwest was an artifact of human-caused CO2-fueled global warming. NPR was a leader in the” Climate Alarmism Olympics,” mentioning hot temperatures, huge wildfires, and flooding rains, but missing on all three. NPR failed to find the cause of the drying of the Pacific Northwest, the PDO, the prime reason for the huge wildfires, huge fuel loads imposed by the flawed Spotted Owl Decision, and claims heavier rainfall amounts where none exist in the best rainfall records from the USA and the UK.
Cliff Mass’ blog post of 5 July 2021 analyzes the hot temperatures experienced in the Pacific Northwest in late June 2021. His analysis is that only a maximum of 1-2F of the 30F to 40F temperature excursions during this weather event might have been caused by atmospheric CO2 increases.
Rather than a climate catastrophe, careful analysis of especially the upper air charts reveals that this was a rare weather event caused by an unusual weather development in the upper air patterns, an Omega Block, an event remarkably similar to the 2019 Omega Block in Europe which led to hot temperatures in Continental Europe and the UK.