
Precursor to the Midwest’s Severe Weather
Robert W. Endlich
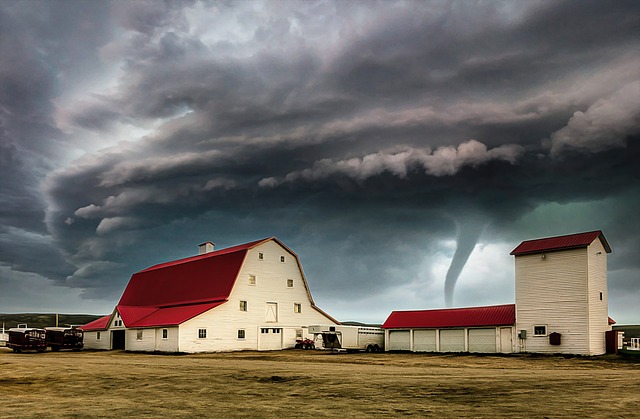
At the end of March 2023, a storm system was moving from the Rocky Mountain states eastward into the Great Plains. One clue as to the severity of the convective storms to come to the tornado-prone Midwest was the very dry weather in New Mexico, indicated by very low dew point temperatures. This post explains why the dry air in New Mexico and adjacent areas in the US and Mexico is an essential component of the severe weather which is a feature of spring (and other times of the year, but especially spring) weather in the Midwestern and adjacent states in the middle of the USA.
SPRINGTIME AND THE THREAT OF SEVERE STORMS
The Midwest USA, especially in the springtime, is the place where severe local storms, strong thunderstorms, frequently accompanied by damaging surface winds, large hail, and even tornadoes, is at a global maximum. In thinking further, this is not a result of strong surface heating alone; sunlight is stronger closer to the equator. It is not a result of a moist atmosphere; many tropical places have heavy rain, but not tornadoes. What is it that leads to the maximum occurrence of tornadoes and other severe local storms in the Midwest of the USA? A first guess might be that the unique geography of this region must be close to the heart of this situation.
Here are some answers:
Yes, it is the unique geography which brings the global maximum in severe local storms to the Midwest USA.
But it is the resultant atmospheric thermodynamics that is the long pole in this “severe local storms” tent.
BASICS THAT CAUSE THESE SEVERE STORMS
Some basics help set the table for this discussion.
From the title: “Dew Point.” So, what is the dew point?
The dew point is a “conservative” measure of the water vapor content of the atmosphere. It is the temperature, if a “parcel” of air we are considering, is cooled, and the parcel reaches saturation of the water vapor. At this temperature, dew will start forming on “stuff” near that parcel, vegetation, fence posts, or perhaps an instrument shelter taking surface weather measurements. While the parcel is cooling, the relative humidity changes a lot, but the dew point temperature remains constant until saturation is reached, and then it decreases as the water vapor condenses into liquid water droplets. This constancy characteristic is why we call dew point a “conservative” property.
Surface weather observations are coded, transmitted for use locally, within the country, and worldwide, and frequently plotted according to an internationally agreed-upon set of standards and protocols overseen by the World Meteorological Organization in Geneva. The presentation graphics has the full set of materials I used to present to the CASF meeting on 15 April 2023.
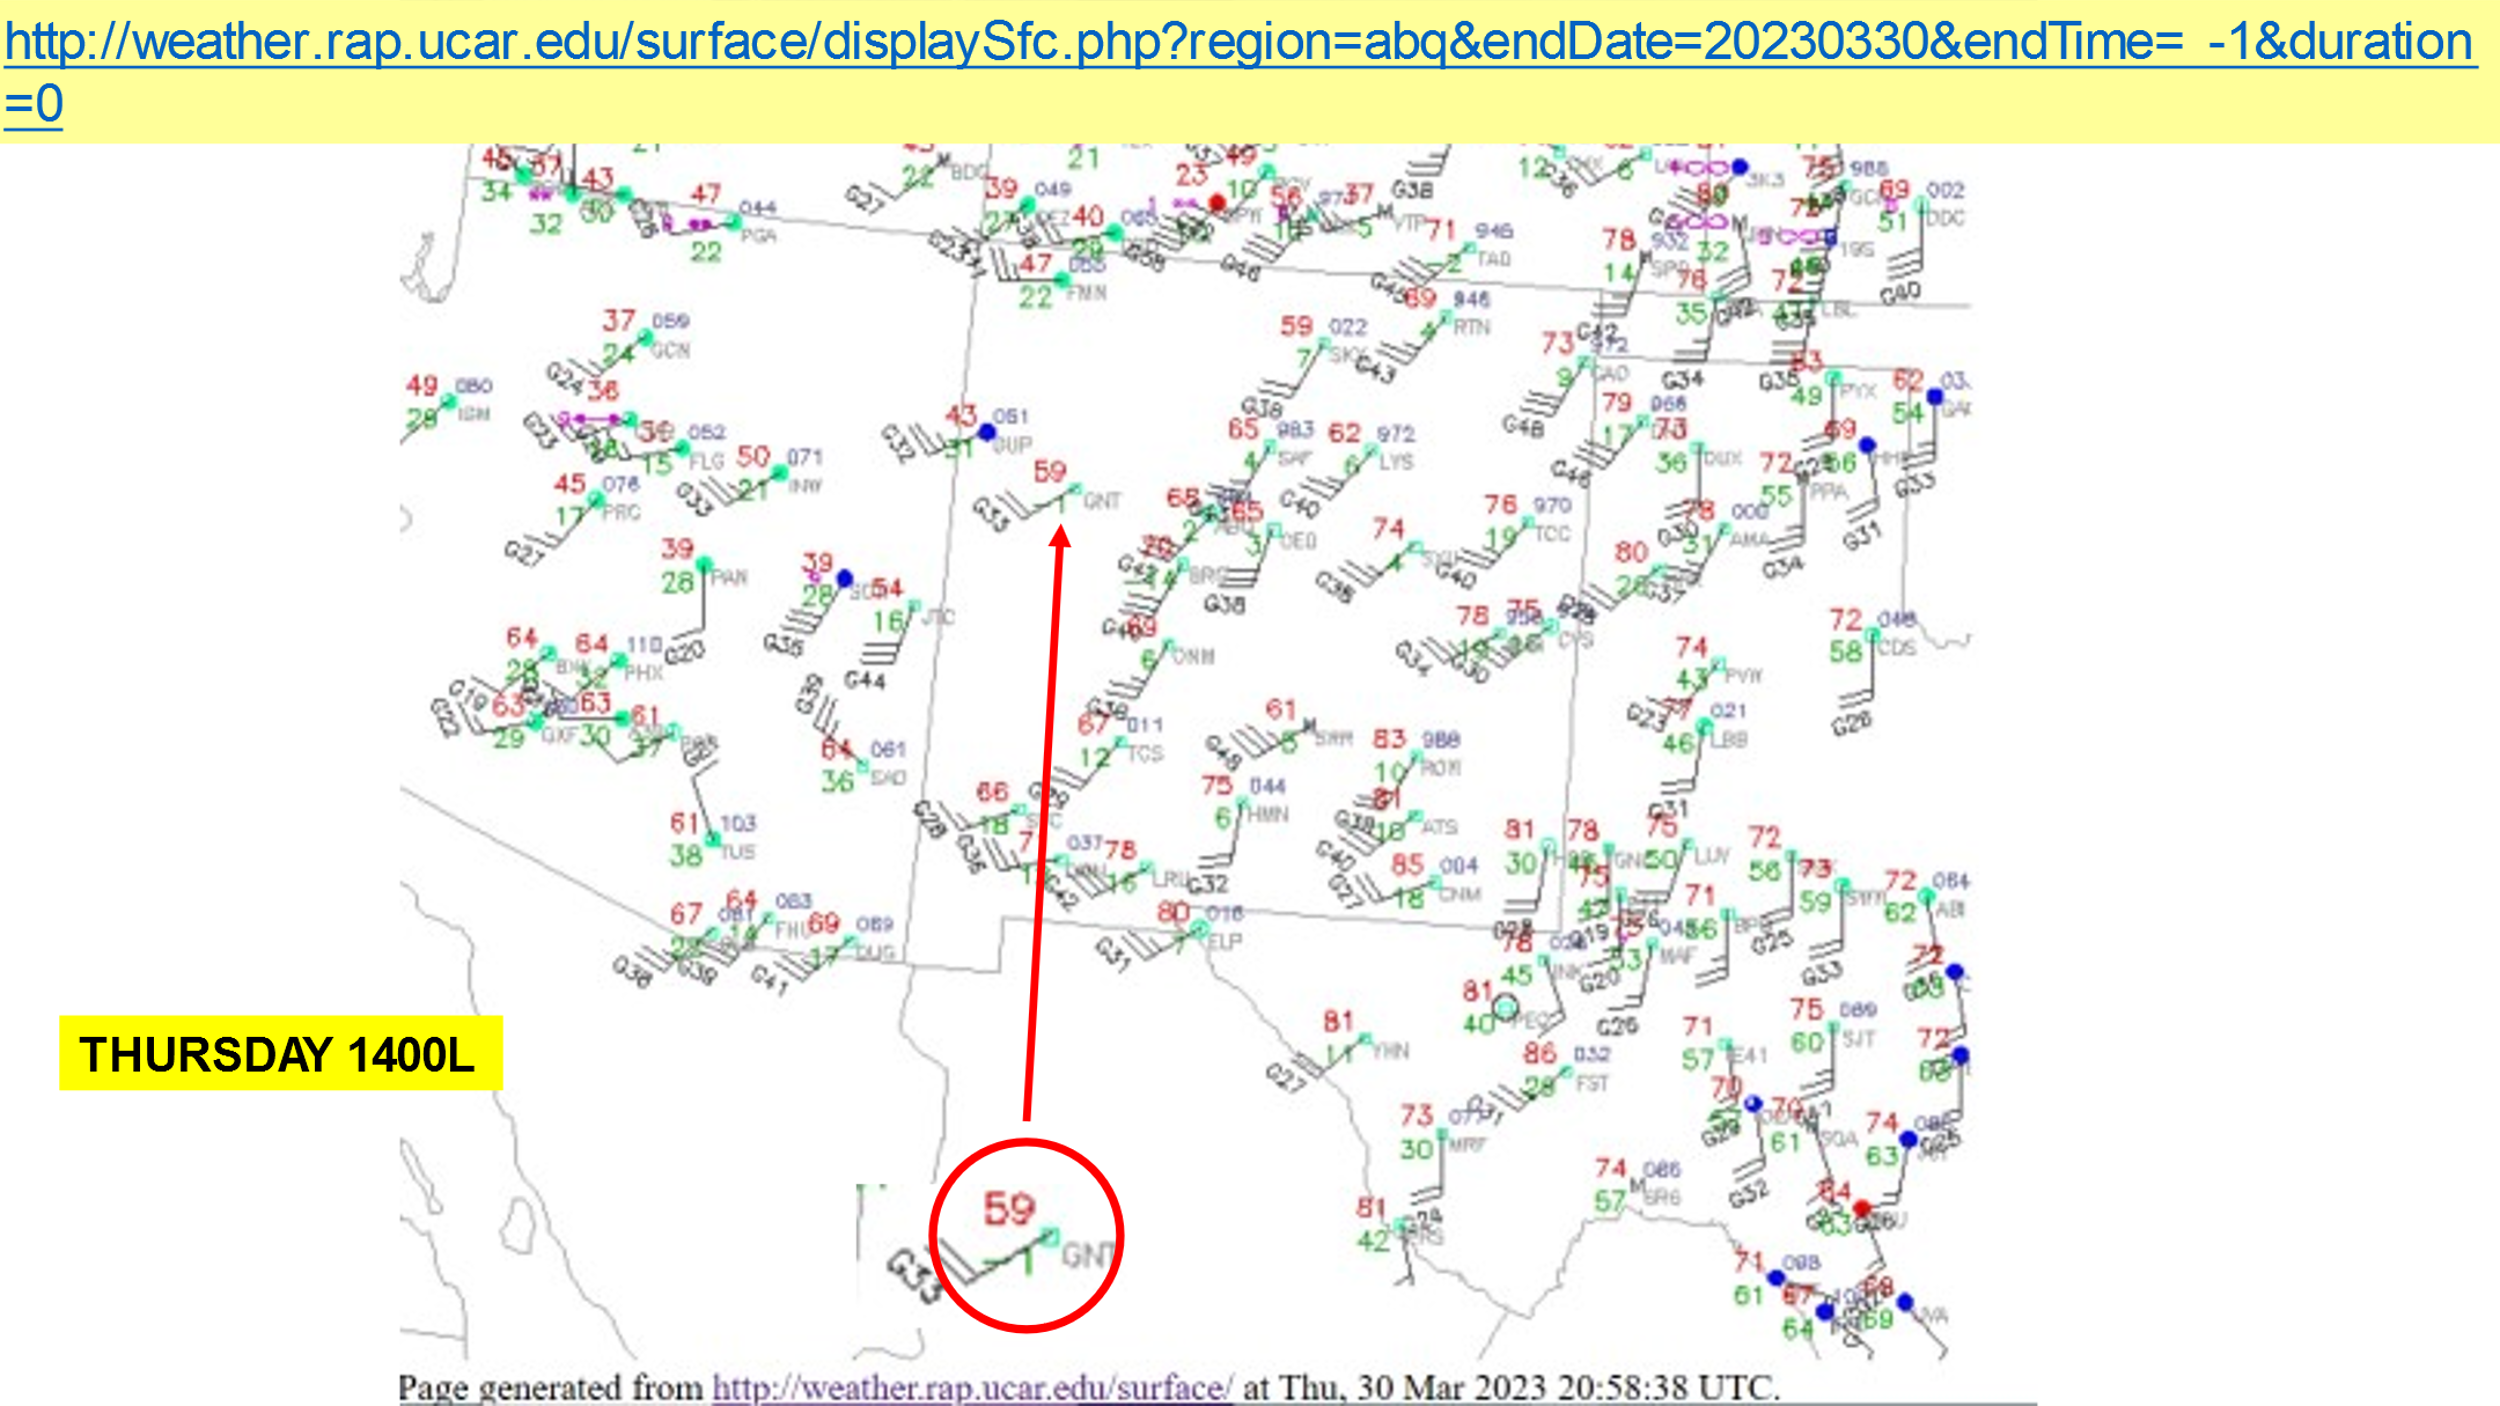
Below are the plotted surface weather observations for the southwestern USA for early afternoon of 30 March 2023. Note particularly the very low dew points plotted at Grants, Holloman AFB, and Ruidoso, all in New Mexico, and El Paso, Texas. The dew point is plotted in the lower left of the station plot, for example the plotted in green -1(Deg F) for Grants, NM, shown in the red circled area in Figure 1 below.
UPPER-AIR MEASUREMENTS
There is a grid of “upper air” stations which measure temperatures, humidity, and winds from the surface to about 100,000 ft every 12 hours, at 00 and 12 Greenwich Mean Time, sometimes called 00Z and 12Z. These are the “Zulu” times, the time at Greenwich, England, a universal coordinated standard time used by the Weather, Aviation, Military, Nautical, Geographic, Space and Satellite communities. Frequently this time is called Coordinated Universal Time, UTC.
Locally nearby, “weather balloons,” actually Radiosondes or Rawinsondes (the latter includes winds), which are released so as to be in the air at 00Z and 12Z, at Santa Teresa, NM, Albuquerque, NM, Tucson, AZ, San Diego, CA, Midland, TX, (and other locations worldwide). This list above gives you an idea of the grid spacing for upper air measurements. These sondes measure temperatures, relative humidities (from which the dew points are calculated) and their horizontal displacement over time reveals the winds aloft.
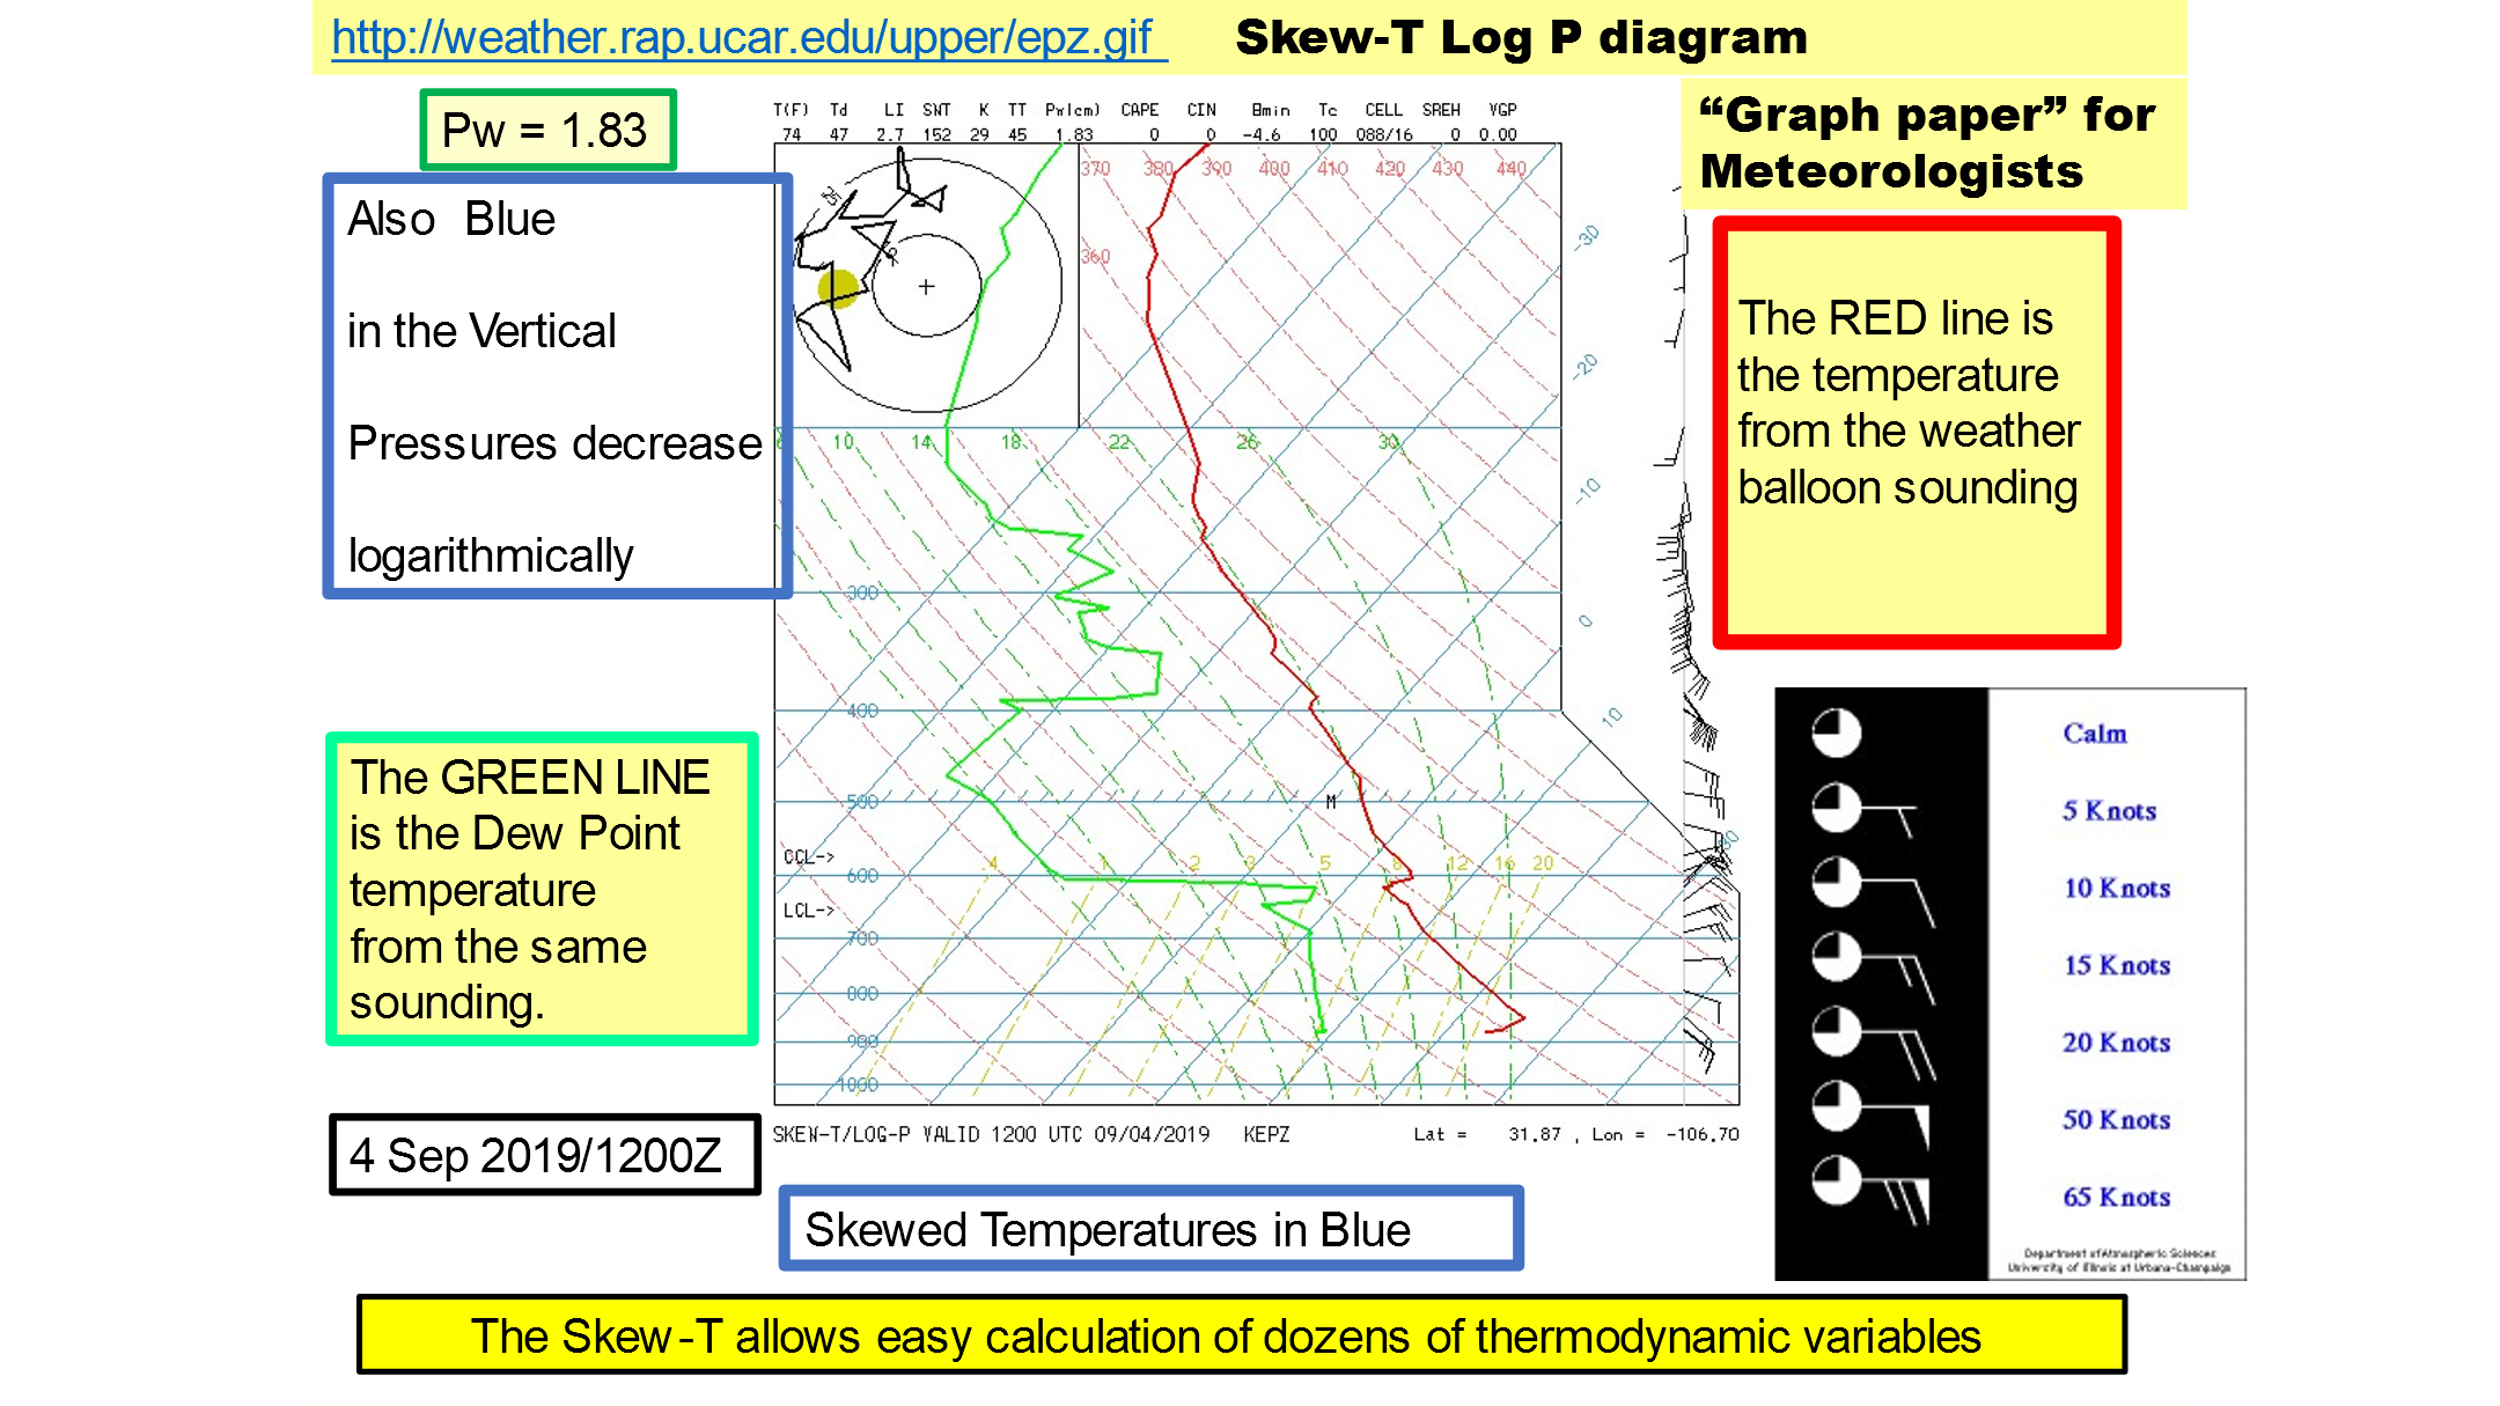
Next, we will look at what at one atmospheric sounding from Santa Teresa, New Mexico, near El Paso, TX, which is why it has the location designator “EPZ.” This type of chart is called a “Skew-T, Log P” diagram, because the lines of constant temperature are the blue lines slanted up and to the right, while the pressures decrease logarithmically in the vertical, the way they do in the atmosphere.
The coordinates of the temperatures aloft at given pressures can be plotted on the Skew-T, Log P diagram to gain information on the atmospheric structures aloft over the station which sent the balloon and its measurement package aloft. The red line on the graph is the plot of temperature aloft, while the green line is the plot of dew point aloft.
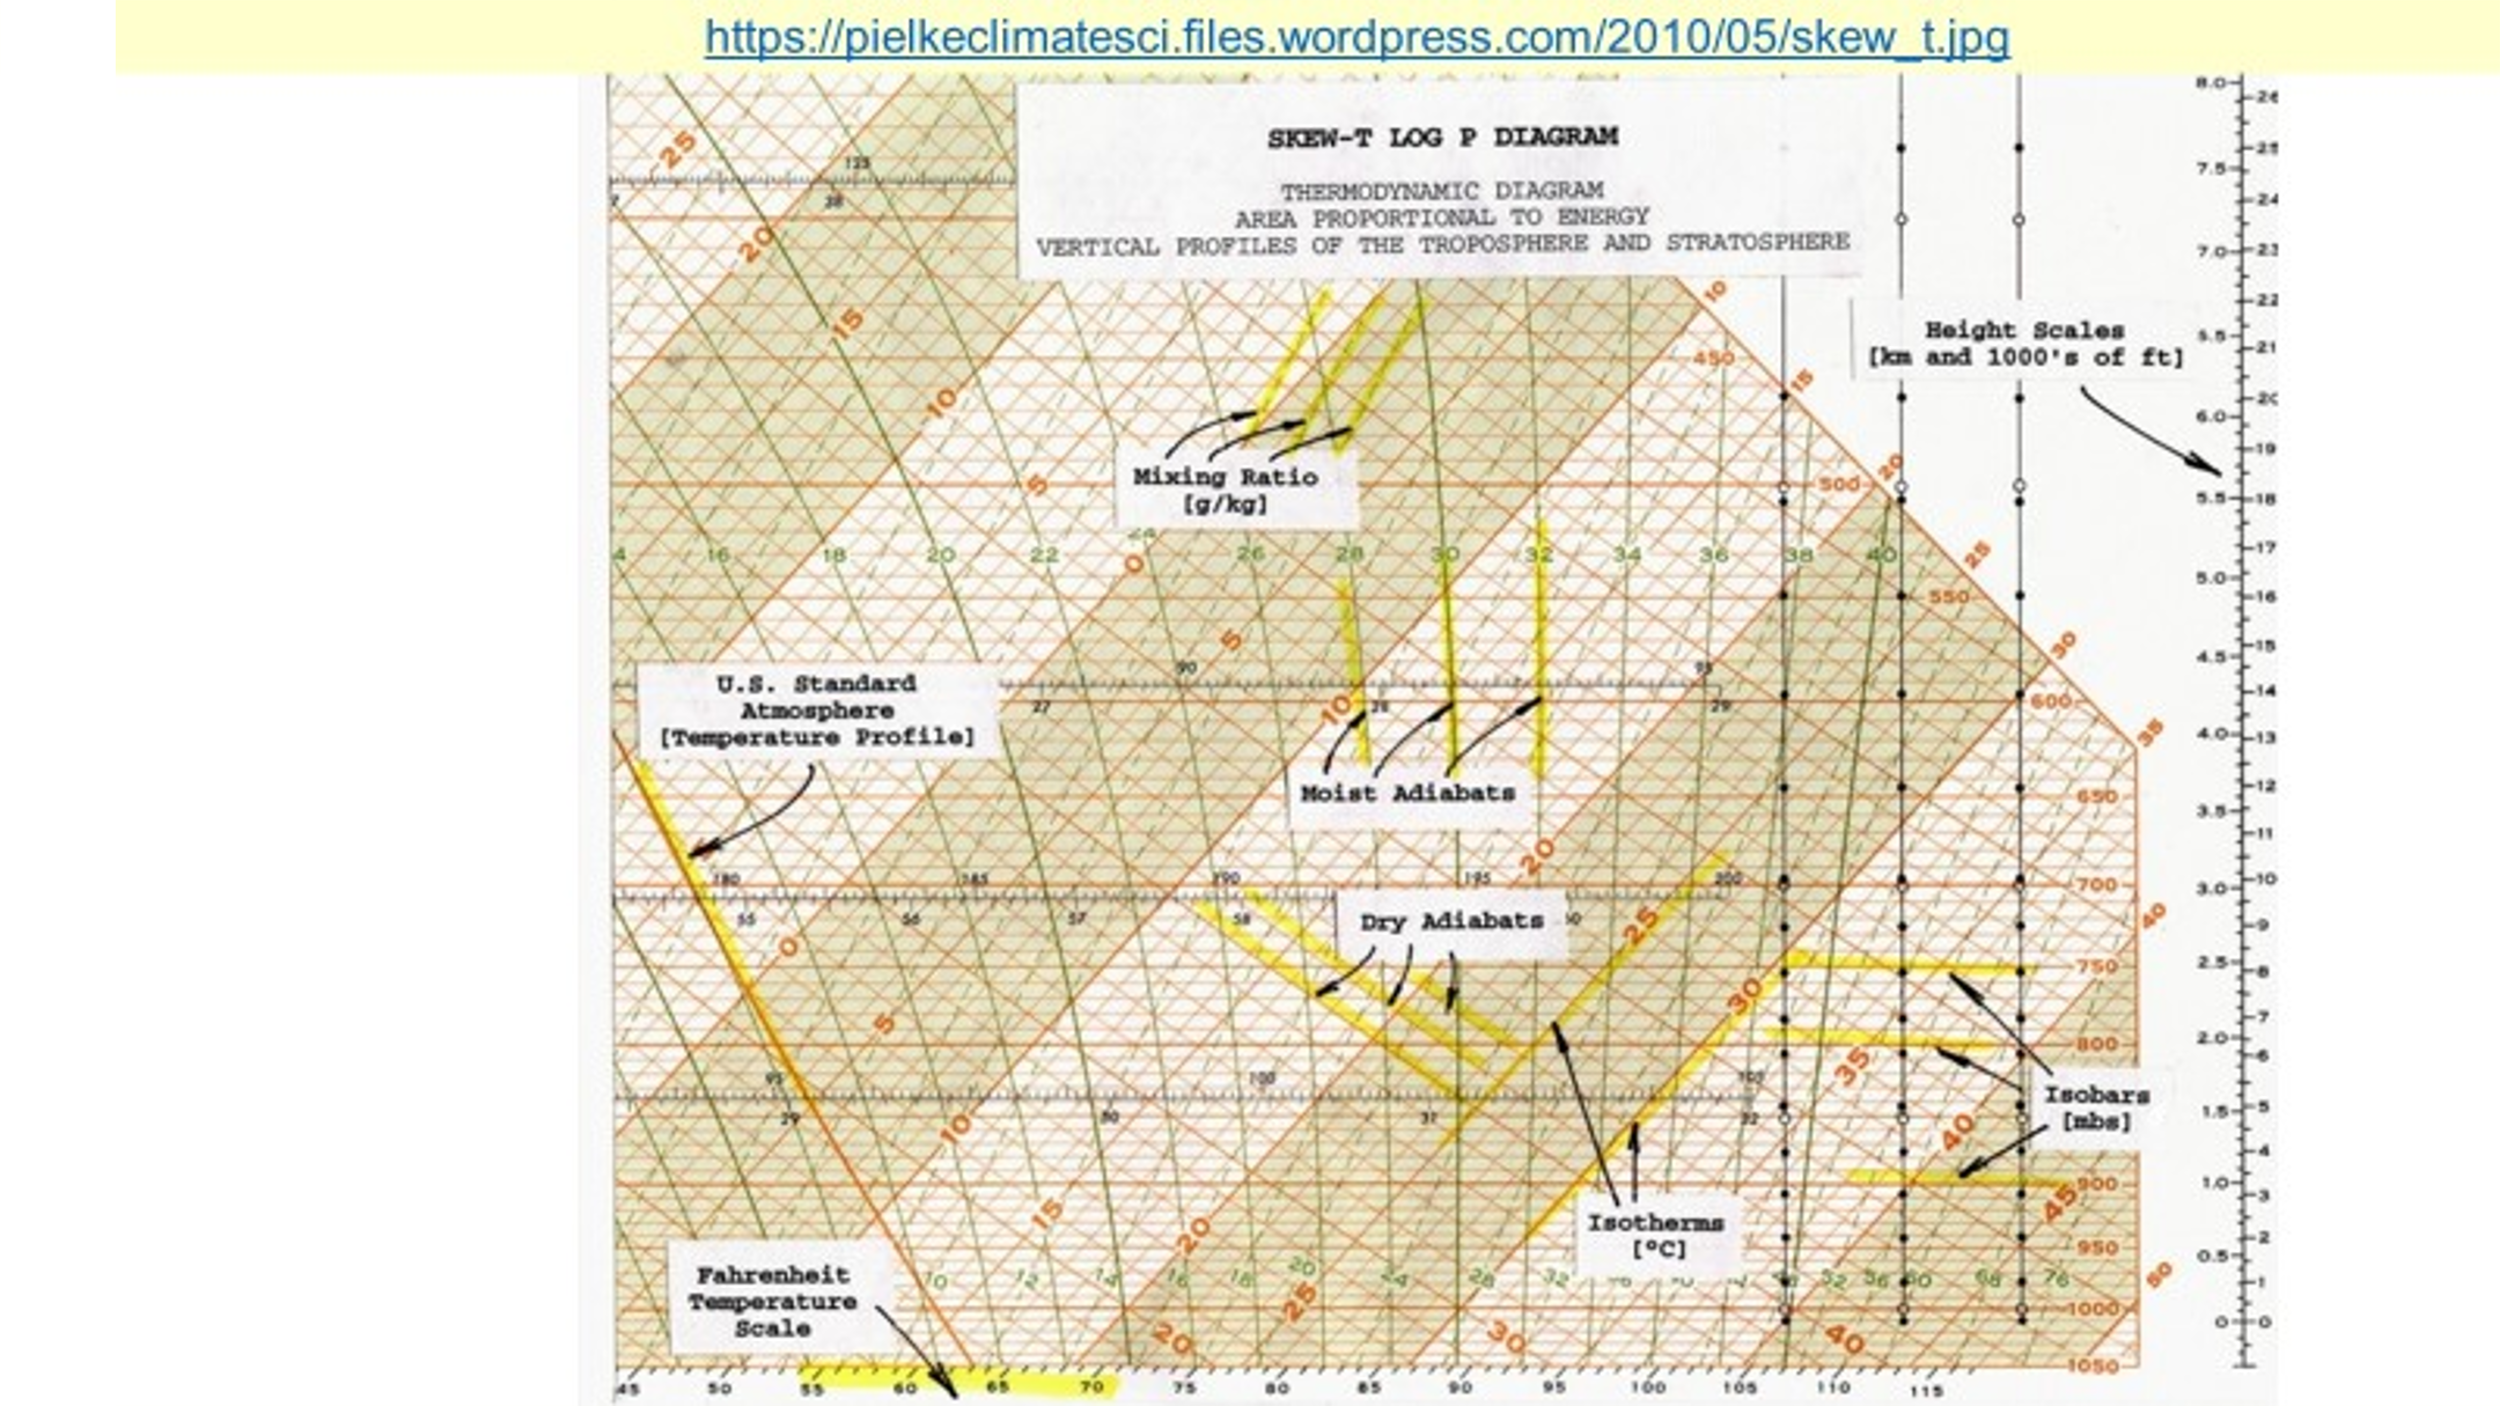
Roger Pielke, Sr., has on his web site a more general and a more detailed description of the Skew-T Log P diagram, shown below as Figure 3.
The Skew-T Log P diagram is often used by operational meteorologists because equal areas represented on the chart represent equal energies in thermodynamic calculations.
THERMODYNAMICS: THE SCIENCE THAT PROVIDES GOOD ANSWERS
When dry, unsaturated air is lifted or forced downward, its temperature changes according to the Universal Gas Law, warming by compression when descending and cooling by expansion, when lifted. Such changes in temperature occur without the addition of or subtraction of heat, a process called “adiabatic.”
For the weather or physics geeks, that rate of change of temperature is equal to the ratio of two constants and is g/Cp.
It takes a lot of energy to heat and evaporate water, and much of the Sun’s energy reaching the surface is spent evaporating water or changing it from liquid to gas phase. We call that property the high “specific heat” of water, and it is high for water in comparison to many other common substances.
Especially in the warm season, the morning sun’s energy is used to heat the surface of the earth, and when the surface heats up, it heats the air in contact with the surface. Eventually the air actually boils, and the heated air ascends, cooling adiabatically, until it is no longer warmer than its surroundings.
When the air contains enough water vapor, as the heated air expands and cools adiabatically, it loses its ability to keep the water vapor in the gas phase, and eventually it might reach the dew point of the air. At this point, the air reaches saturation, and water droplets form within that parcel which can result in the formation of clouds. This is the often-flat base of cumulus clouds.
As the saturated air parcel is further lifted, it cools at the “moist adiabatic lapse rate,” where that “parcel” of air “gives back,” or releases, the large amount of energy that was absorbed when the water evaporated.
Now, please go back to Figure 3 and observe the difference in slope between the “dry adiabats” to the left, and the “moist adiabats” to the right.
On the Skew-T diagram, these differences show up dramatically as differences in slope along the process (the temperature change process that happens in a parcel of air moving vertically) line, be it a dry parcel cooling at the dry adiabatic lapse rate (as Pielke says, “dry adiabats”) or if that parcel is saturated, along the moist adiabatic lapse rate (the moist adiabats).
TORNADO SOUNDINGS WARN OF SEVERE WEATHER
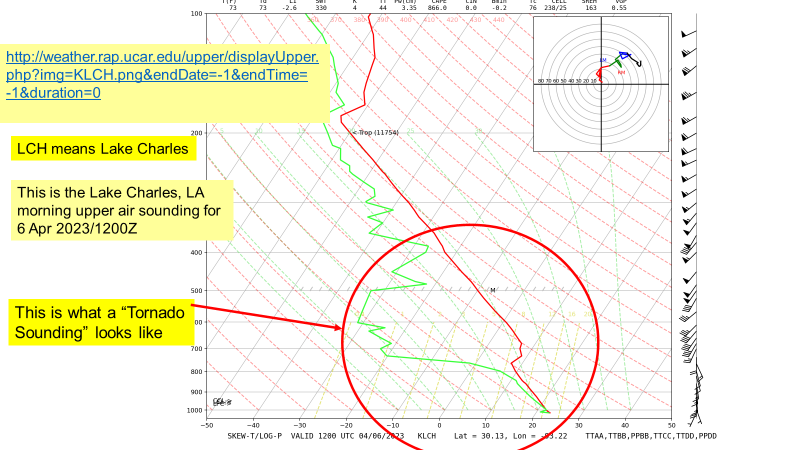
As spring storm systems move into the Midwest, warm moist air is drawn from the Gulf of Mexico into the central plains, so we have nearly summerlike heat and humidity at and a few thousand feet above the surface, and the dry desert air from New Mexico and surroundings lie above. Figure 4, a sounding from Lake Charles, LA, shows the vertical profile of temperature and dew point measured on 6 April 2023 by a balloon sounding released at 12Z, the morning sounding.
The characteristic shape of the sounding, indicative of severe weather, possibly tornadoes, is circled in red.
The National Weather Service training page for severe weather forecasters contains a similar sounding and description which is also illustrative of this sequence of events, and is shown below:
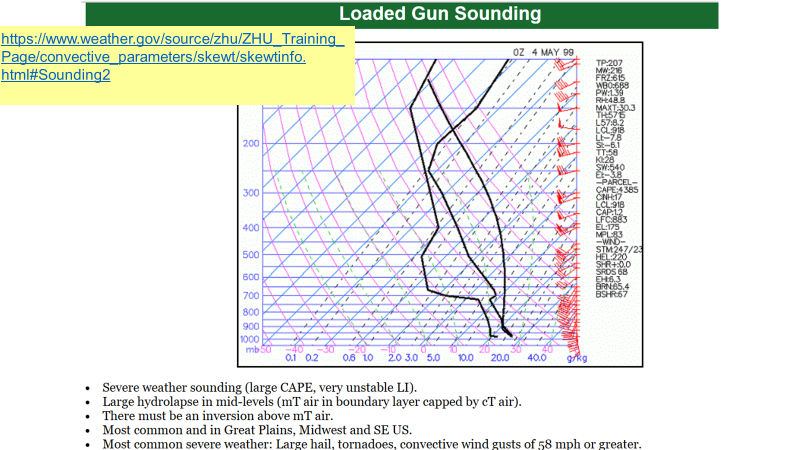
From the left, in sequence, the vertical lines are the dew point sounding, in the middle, the temperature sounding and the right-most line, the process curve for a lifted parcel. With morning heating of the surface, a parcel of air would be lifted by convection, rise dry adiabatically up to saturation of the water vapor which produces a cumulus cloud base. Further heating would provide other parcels additional lift, and those parcels would cool moist adiabatically as they rise further. With further heating, once the parcel is lifted above the “Level of Free Convection” the level above which the parcel is warmer than the surrounding environment, it ascends by itself, still following the moist adiabatic process curve, to great heights, in this case, to at least to 180 millibars or at least to 41,000 ft, possibly higher if an “overshooting top” occurs.
When the conditions outlined previously, moist air overlain by dry air, occur, the conditions become ripe for severe weather, especially in the spring in the Midwestern parts of the USA. Figure 5 shows such a situation, with such potential for severe weather, it is called a “Loaded Gun Sounding.”
In the above description of the sequence of events, once the sun’s heating of the surface starts convective overturning of that atmosphere. Huge thunderstorms, with tops of 41,000 ft, even higher, occur once convective overturning lifts parcels of air to the “Level of Free Convection,” shown with this sounding.
ANOTHER WAY OF LOOKING AT SEVERE WEATHER POTENTIAL
Another way of looking at this is to consider what happens in the atmosphere when the air ahead of a vigorous low-pressure system is lifted, especially during the spring months in the USA, per Technical Note 2 in the presentation graphics.
When storm systems move, the whole column of air ahead of these systems is lifted. In the moist air ahead of the storm system, heating of the surface in the morning sun, convective overturning results in saturated air in morning cumulus clouds. Such parcels of air cool MOIST adiabatically.
However, lifting of the dry air (from New Mexico and the Desert Southwest of the USA and adjacent Mexico) results in parcels of air which cool DRY adiabatically.
The resulting column of air becomes extremely unstable, and when continuing heating of the surface is added, the resulting huge thunderstorms, “hot” cloud towers, which accelerate to strong vertical wind speeds, some measured at vertical speeds of 87 knots, can produce tornadoes.
THE CLIMATE TIE-IN.
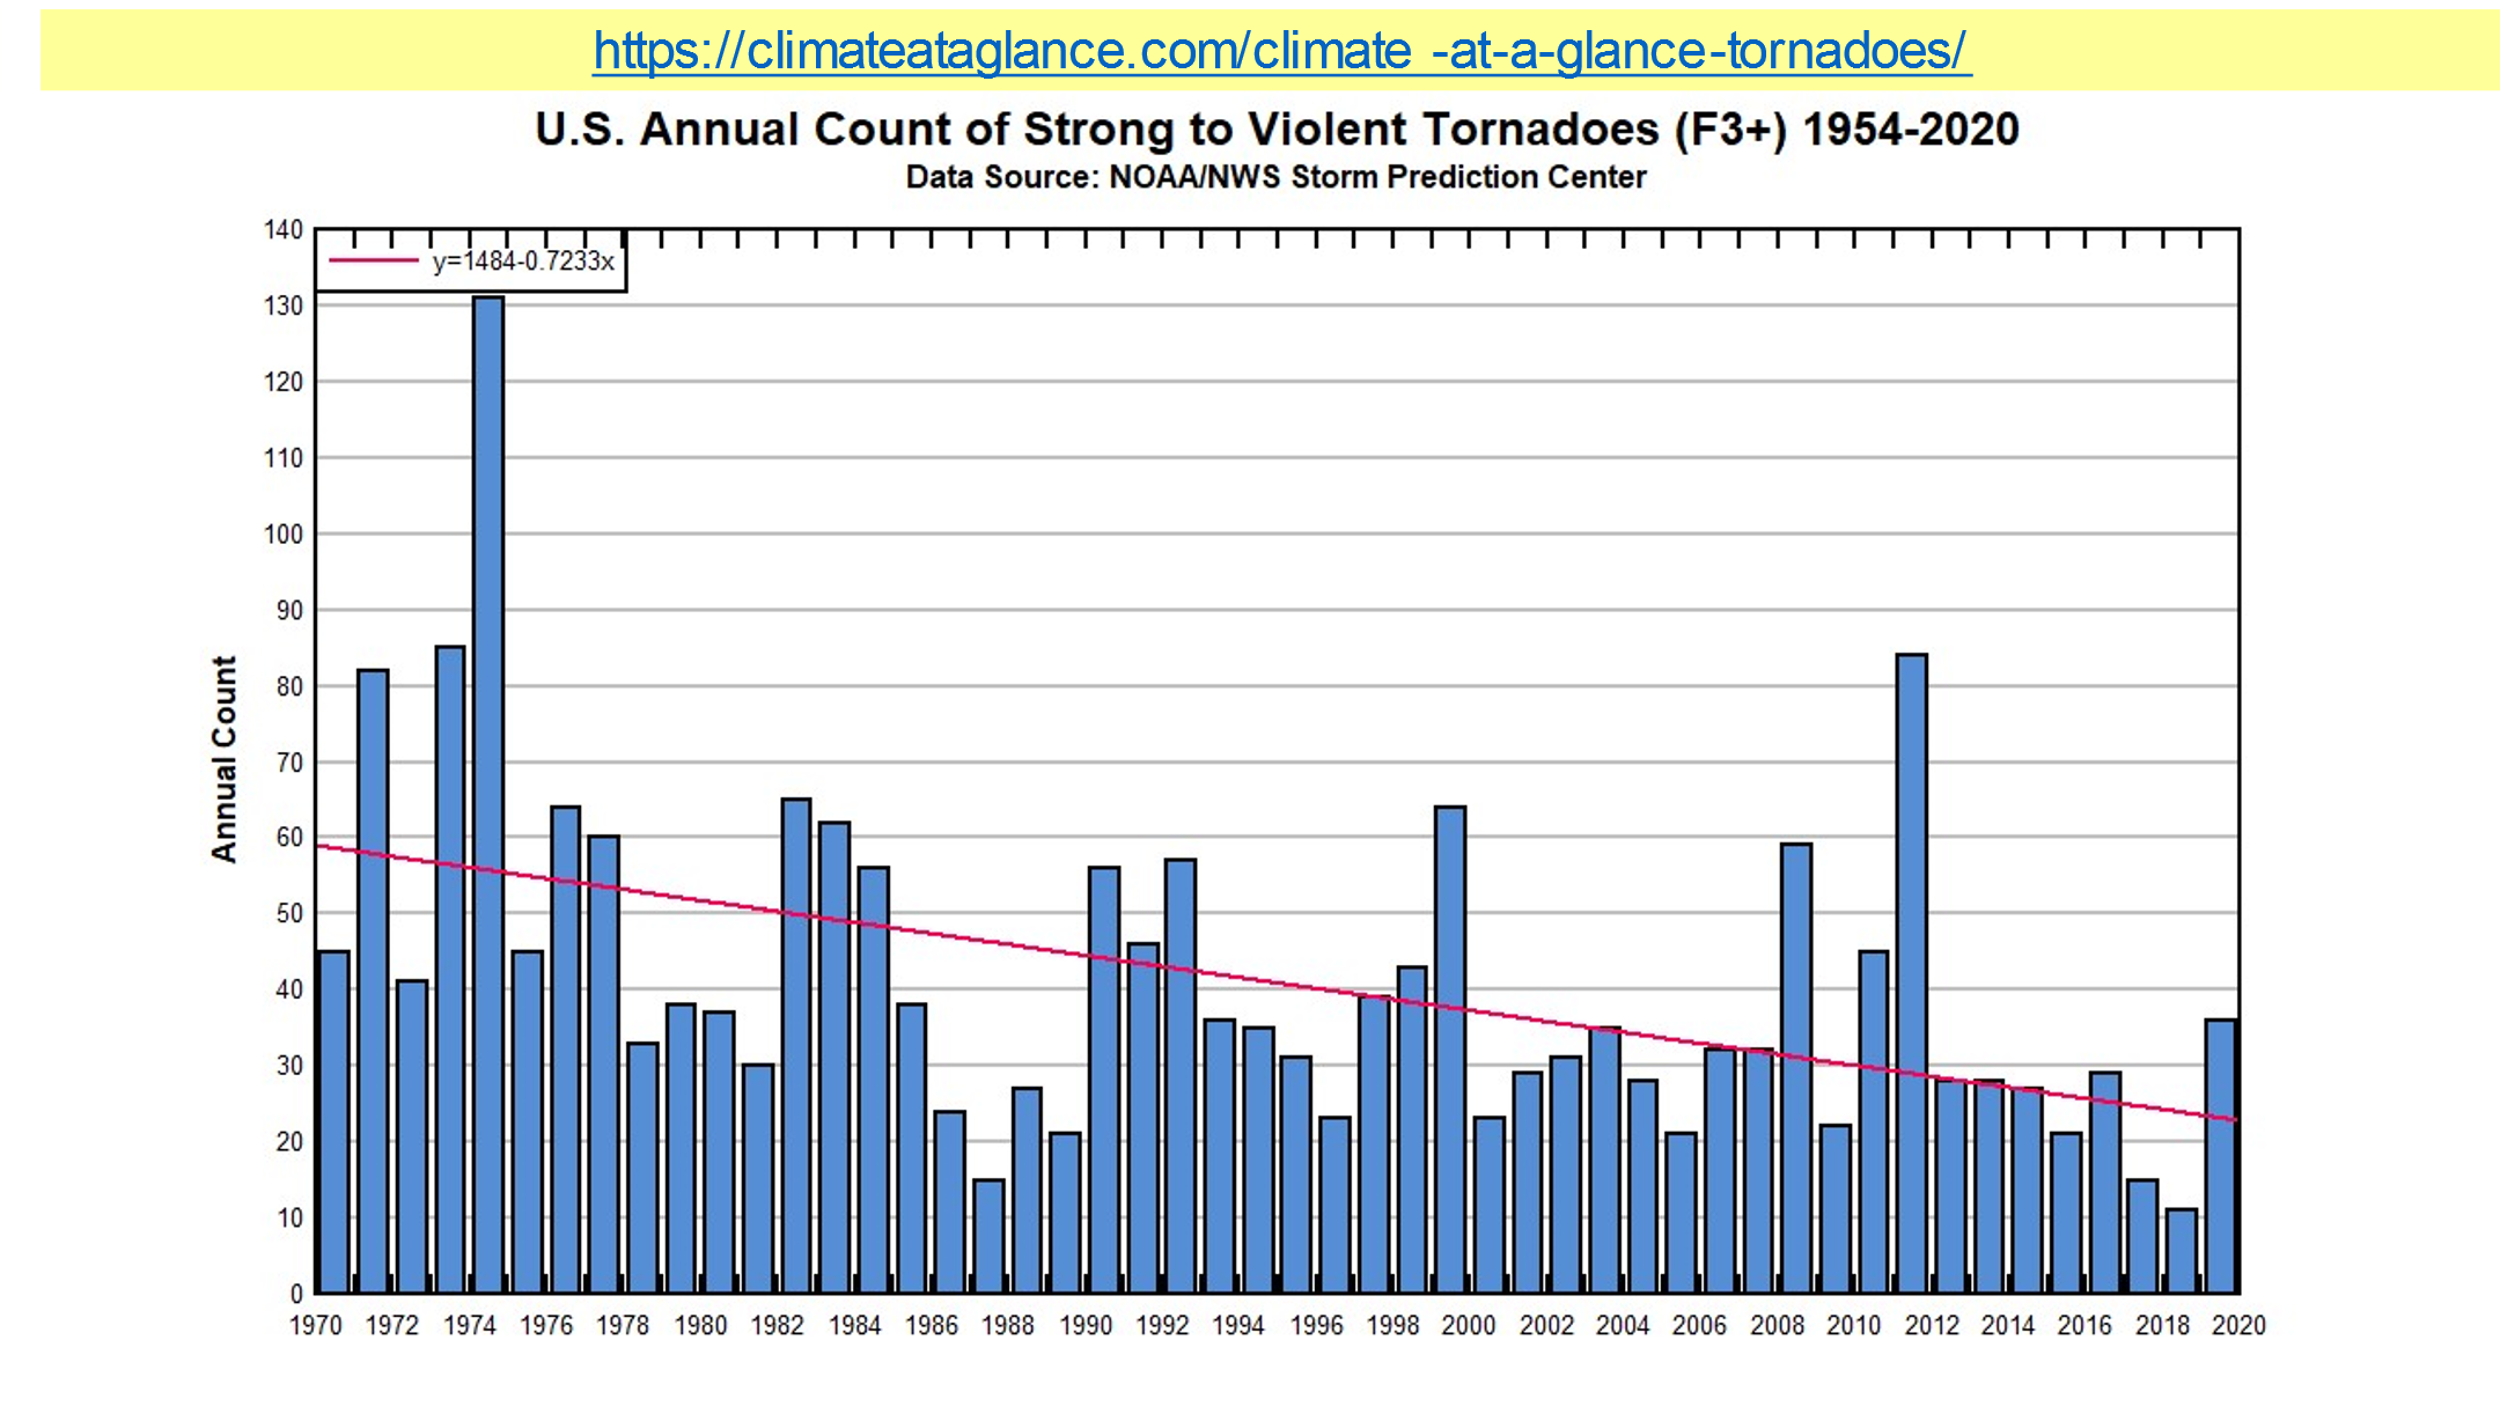
Climate alarmists claim that as the planet slowly warms in this part of the Holocene, that severe weather is also increasing, as one of the alarmists claims in the Fourth National Climate Assessment. Such alarmist claims are made without actually looking at the data and are foolishness.
Figure 6, below, from The Heartland Institute’s “Climate at a Glance” web page, shows that since 1970 the incidence of strong to violent tornadoes in the USA has decreased, based on the numbers published by NOAA’s Storm Prediction Center.
SUMMARY
We now know a great deal about the formation of severe local storms and can provide those living in threatened areas with good forecasts of the severe weather threat.
One of the early indicators of the development of such conditions is the occurrence of very dry conditions over New Mexico a day or two in advance of outbreaks of severe local storms, including the possibility of tornadoes.
Knowledge of the atmosphere’s thermodynamics shows us that it is the dry air aloft over moist, muggy air at and just above the surface, that is the key to such developments. The climate alarmists, who claim that the present warming, which they erroneously attribute to the burning of fossil fuels, say that warming is making such violent storms more frequent, but in fact, warming is reducing the frequency of severe local storms.