
by Robert W. Endlich
A significant weather system which affects the globe was not even discovered until the 1970s, perhaps because it is stronger in the Southern Hemisphere than the Northern. This system, the Madden-Julian Oscillation, is an area of enhanced rainfall with these characteristics:
The enhanced precipitation anomaly starts in the Indian Ocean; it always moves eastward, and usually moves from Indian Ocean into mid-Pacific at speeds of 9-19 Miles/Hour. In addition to the enhanced precipitation area itself, there is an associated area of suppressed precipitation, an out-of-phase area ahead of it, usually way out ahead of it. The disturbed weather areas usually last 30 to sometimes 90 days.
The convective precipitation signature of this system is strongest within 15 degrees north and south of the Equator.
Since the Pacific Trade Winds originate near the West Coasts of South and North America, and these trades cause upwelling of cold deep water, the Madden-Julian Oscillation, usually MJO for short, frequently becomes indistinct when approaching cooler water off the Americas.
Sometimes the MJO continues (perhaps when El Niño is active) or reappears over the equatorial Atlantic and moves into Africa, that is, it sometimes moves around the entire earth.
Schematic Diagrams:
Figure 1 is a schematic diagram which shows changes in tropopause height and sea level pressure as the MJO propagates and strengthens. Some of the literature mentions that it takes about 5 days for the area of enhanced precipitation to pass a single station.

Figure 1. From a schematic of the MJO from a 1994 survey article by Madden and Julian. The top section, “F,” shows the enhanced tropopause heights, enhanced convection, warmer temperatures, and ascending air in front of the precipitation area. The “G” section shows lower sea level pressures associated with the area of enhanced precipitation, and, well out in front, the area of higher sea level pressure and subsiding air.
The MJO is an area of active and ongoing research, certainly the “Science is NOT Settled.” The journal articles and NOAA web pages sometimes conflict with each other; nonetheless there are broad areas of agreement, so I present here what is known and occasionally some areas where the literature disagrees.
Figure 2 below shows the area of enhanced precipitation, grey cloud icon, and the area of suppressed precipitation, the sun icon. A little later we will get into a discussion of the satellite-observed areas of enhanced Outgoing Longwave Radiation anomalies “enhanced OLR” anomalies. But, for the moment, just consider the areas of differing Sea Surface Temperatures, with warmer SSTs, as they are commonly called, in red, and the areas of cooler SSTs in blue, in relation to the enhanced precipitation and suppressed precipitation areas.

Figure 2. From NOAA’s Climate Prediction Center this diagram of the MJO area of enhanced precipitation (grey cloud icon) and suppressed precipitation (sun icon) and associated warmer Sea Surface Temperatures in red and cooler SSTs in blue.
To further introduce the MJO and it’s areas of enhanced and suppressed Outgoing Longwave Radiation, please look at this Hovmöller Diagram, Figure 3 below. Time increases from top to bottom, and the scale of longitude is across the bottom of the chart, left to right. The areas of suppressed OLR are in blue, these are the cloudy areas with enhanced rainfall. The brighter orange areas are enhanced OLR, brighter in the infrared with lower cloud cover, so they indicate areas where the warmer sea surface temperatures are radiating directly to space to be observed by satellite sensing systems.
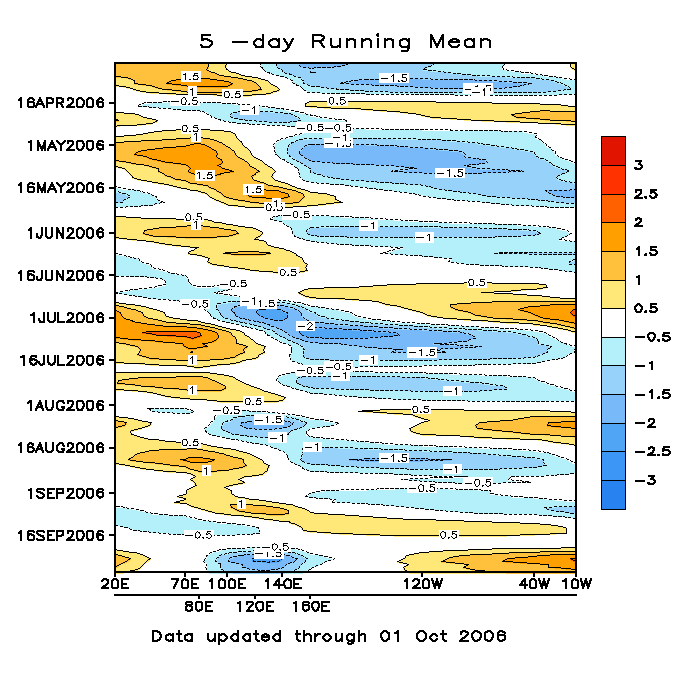
To demonstrate just how huge the areas represented by the enhanced and suppressed convection are, the chart in Figure 4, below, superimposes an extended Mercator projection of Earth’s surface with Figure 3’s Hovmöller Diagram:

Figure 4. The Hovmöller diagram showing the areas of enhanced and suppressed Outgoing Longwave Radiation juxtaposed with an enhanced or almost doubled Mercator Projection of Earth’s surface. Note well the wide longitudinal extent of the Madden-Julian Oscillation as revealed with this diagram.
Brief discussion of OLR and the MJO:
Figure 5 below shows two charts illustrating the eastward progression of an MJO area of enhanced precipitation as revealed from satellite observation of the Outgoing Longwave Radiation. Negative Values of OLR (Blue colors) indicate the enhanced convection area, more cloud cover, and the cooler cloud tops radiating less longwave radiation to space
Positive Values of OLR (Red colors) indicate suppressed convection, less cloud cover and more radiation (a lot more) lost to space directly from the warm tropical seas, (because the black body radiation from those warm seas goes T**4).

Figure 5: Two visualizations of an MJO area of enhanced precipitation, in blue, as it progresses eastward from the Western Pacific to the Central Pacific. The blues represent areas where radiation to space is from the cold cloud tops of tropical precipitation systems. The oranges and reds indicate areas of less cloudiness; the warm tropical sea surfaces radiate directly to space, since there is almost no cloud cover. Most of this activity is in the Southern Hemisphere from the Equator to 15S.
Areas of Outgoing Longwave Radiation are calculated by the Physical Sciences Division of NOAA’s Earth Systems Research Laboratory. Daily, Weekly, Monthly, and Seasonal calculations of OLR and OLR anomalies are available at their Map Room page, https://www.esrl.noaa.gov/psd/map/clim/olr.shtml.
Why should WE care?
Most of us live in North America, or at least in the Northern Hemisphere. Why should we be concerned with the Madden-Julian Oscillation if it is mostly a Southern Hemisphere and tropical feature?
There are several answers to this question. But, first we must realize that the effects of the MJO depend on the season where enhanced or suppressed precipitation occur (e.g., in North America). The phase difference between the enhanced and suppressed precipitation elements of the MJO is often attributed to the situation when North Pacific typhoons are active, and the North Atlantic’s hurricanes are not. And conversely.
If enhanced precipitation occurs during the summer Hurricane Season it can make hurricanes stronger and have heavier precipitation.
If, however, suppressed precipitation occurs during the summer Hurricane Season, it can act to cut off or interrupt otherwise strong hurricane formation. If suppressed precipitation occurs during the height of the growing season in the Midwest, it could contribute to a “flash drought,” similar to such an occurrence in 2012, in the Southern Plains.
Enhanced precipitation MJO occurrences during winter has caused an increase in frequency and intensity of “Pineapple Express” events along the US West Coast; this feature is shown in Figure 11, below.
Another winter characteristic of the MJO is its contribution to increased frequency and intensity of cold air outbreaks across the eastern USA
Here are some notes on the timing and “synoptic climatology” of Madden-Julian Oscillation events:
MJO impacts are well known, especially in the tropics. Periods when the MJO is active offer opportunities for enhancing weather prediction and decision assistance, but NOAA’s Climate Prediction Center calls this “climate prediction.”
The MJO can have dramatic impacts in the mid-latitudes. Typically, northern Hemisphere late fall, winter, and early spring have greatest MJO activity. Several times a year the MJO is a strong contributor to significant events in the United States, including Arctic air outbreaks during the winter months across the central and eastern portions of the United States.
MJO tends to be most active during ENSO-neutral years; it’s often absent during moderate-to-strong El Niño and La Niña events.
Especially in Australia and the neighboring areas, there is a common reference to the Maritime Continent, a term used by meteorologists, climatologists, and oceanographers in describing the region between the Indian and Pacific Oceans including the archipelagos of Indonesia, Borneo, New Guinea, the Philippine Islands, the Malay Peninsula, and the surrounding shallow seas.
Madden-Julian Phases
Since its discovery in the 1970s, the MJO has been described in terms of its position around the globe in eight “classic” areas: Phase 1, West Indian Ocean, Phase 2, East Indian Ocean, Phase 3, West Maritime Continent, Phase 4, East Maritime Continent, Phase 5, Western Pacific, Phase 6, Central Pacific, Phase 7, Eastern Pacific, and Phase 8, Western Hemisphere
The diagrams in Figure 6 below show these areas and the 33-year long average of the MJO’s precipitation anomalies in these eight areas from November through March, the Southern Hemisphere Summer. The blues and greens represent positive precipitation anomalies, while the browns represent negative precipitation anomalies. The tendency for the positive and negative anomalies to occur in the Southern Hemisphere is enhanced by the selection of the period for the average, November through March.


Figure 6. Average precipitation anomalies for the November through March, 1979-2012, for the eight separate areas defining the phases of the MJO. The greens and blues show the areas of enhanced precipitation, while the browns show areas of suppressed precipitation. Since the time periods displayed is the Southern Hemisphere summer, November through March, most of the anomalies occur in the Southern Hemisphere; NB the proximity of the centers of action to the Equator.
Year 2005 Visualizations:
This next section refers to separate visualizations of the MJO which occurred during one specific year, 2005. Now would be a good time to look at this link, https://casf.me/casf-monthly-meeting-presentations/ and scroll to the March 2018 entry which has the separate visualizations, each visible for about seven seconds. The following graphics show the spread of the precipitation anomalies in terms of degrees of longitude.
Figure 7, below, shows an extreme spread which occurred during a Western Hemisphere or Phase 8 example of the MJO, centered on 9 March 2005.There are 180 degrees of longitude between the suppressed phase, near DaNang, Vietnam, and the enhanced phase, in western Brazil.

Figure 7. This visualization is centered on 9 March 2005, and it shows an extreme distance in terms of longitude between the suppressed area of convection near DaNang, Vietnam and the enhanced area of convection in the westernmost reaches of Brazil, some 180 degrees longitude, or halfway around Earth.
The next visualization showing the wide latitudinal extent between enhanced and suppressed precipitation elements of the MJO is below, in Figure 8, an East Indian Ocean, or MJO Phase 2, event. While the maximum area of suppressed convection is east of New Zealand, other major suppressed convection areas are off Mexico’s west coast and Brazil’s coastal bend. 
Figure 8. Another wide area of geographic extent between enhanced and suppressed convection in an MJO Phase 2 event from 3 May 2005. The maximum area of enhanced precipitation lies almost directly astride the Equator in the Indian Ocean, while the most important area of suppressed convection lies not too far east of New Zealand, in the south Pacific Ocean; the spread is a little over a third of Earth’s circumference.
The next two graphics show MJO phases having important weather effects on North America
First is Figure 9 which shows a Phase 8 or Western Hemisphere-located enhanced precipitation area. In addition to heavy enhancements from Ecuador, Columbia, Panama and Venezuela, there are important enhancements in the north American deserts, mountain West, and wheat belts.

Figure 9. An MJO Phase 8 instance showing important precipitation enhancements for much of Central America and northern South America, but for most readers, significant precipitation enhancements for North America, especially western North America where drought is often a problem. At the same time suppressed precipitation covers wide swaths of east Asia and the Maritime Continent. Important dryness encompasses the regions from Japan and Korea, northern China, a large portion of India and Bangladesh, and a huge area of Australia.
“Huge” and “Massive” are the first words to describe these areas of suppressed and enhanced precipitation which occurred in the 18 May 2005 MJO Phase 8 event, the Western Hemisphere, shown in Figure 10 below. Resembling a huge egg yolk covering parts of India, Bangladesh, Burma and Thailand, the suppressed area of precipitation extends from the Aral Sea to Australia and Japan to the Horn of Africa. The enhanced precipitation area extends from the Outer Banks of North Carolina almost to the coast of west Africa, tropical South America, all Central America and the Yucatan.

Figure 10. The 18 May 2005 Phase 8 MJO event, which shows a dramatic Western Hemisphere area of enhanced precipitation featuring a north-south extent from Prince Edward Island to Argentina and from the Great Lakes states to west Africa. Half a world away, the area of suppressed precipitation covers central and east Asia from the Aral Sea to Australia and from Japan to the Seychelles in the Indian Ocean.
MJO and the Pineapple Express:
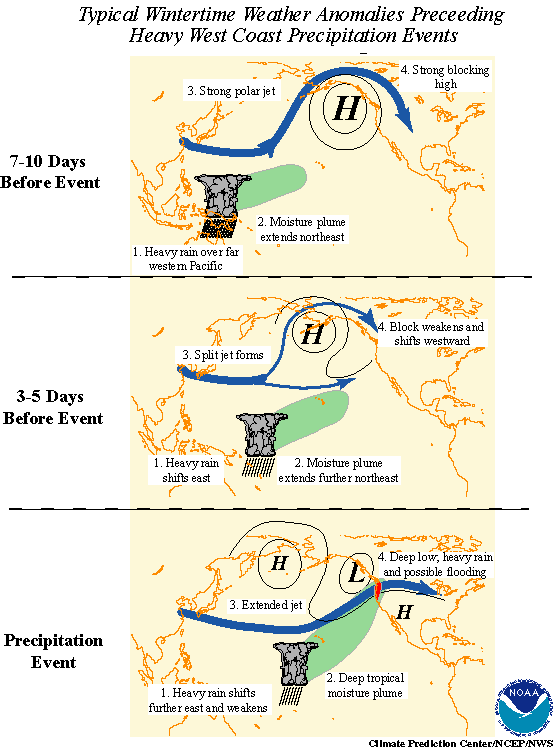
One of the MJO winter influences on the North America is the development of, and possible enhancement of, heavy rainfall events along the Pacific coast from southern California to Canada, often called the “Pineapple Express,” because of the river of moisture from Hawaii to the Pacific coast which accompanies such systems. A diagram showing the synoptic climatology of development of these Pineapple Express is shown below, in Figure 11.

Figure 11. Sequence of events for development of a Pineapple Express event along the west coast of the USA. The sequence starts over a week ahead, with a strong high in the Gulf of Alaska, and heavy precipitation in the western Pacific. Three to five days before the event, in the westerlies, the Gulf of Alaska high retrogrades into an “Omega Block” in the Aleutians, split flow in the jet stream develops in the west-central Pacific, north of Midway Island, and in the tropics, movement of the heavy rain and deep tropical moisture flow east, to the central Pacific. The Pineapple Express event has the blocking high retrograded to the westernmost Aleutian Islands, a strong low has replaced it in the Gulf of Alaska, and the strong flow of tropical moisture flows southwest to northeast, from Hawaii to the Pacific coast.
Putting it all together:
One of the references, shows how the enhanced precipitation events correspond to sea level pressure anomalies and to enhanced Outgoing Longwave Radiation anomalies (OLR anomalies) in both southern hemisphere summer and northern hemisphere summer. The original presentation at this link, contains numerous graphics showing these patterns, specifically in graphics 51-60. So, the graphics below show only a lesser included subset, emphasizing Western Hemisphere patterns.
Figure 12, below, shows for the East Pacific and Western Hemisphere, MJO Phases Seven and Eight, sea level pressure anomalies, left, and MJO precipitation enhancements, right, for the 25-year period, 1979-2004, for northern hemisphere summer.
Low Sea Level Pressure anomalies in Blue on the left, are associated with positive precipitation anomalies in Green on the right.

Figure 12. Sea Level Pressure anomalies on the left are colored, Reds and Oranges for higher sea level pressure anomalies and Blues for lower sea level pressure anomalies. Precipitation anomalies on the right show precipitation deficits in Brown, and positive precipitation anomalies in Green. NOAA collected these data for the 25-year period from 1979-2004, for northern hemisphere summer, May through September.
Figure 13, below, shows for the East Pacific and Western Hemisphere, MJO Phases Seven and Eight, Outgoing Longwave Radiation anomalies left and MJO precipitation enhancements, right for the 25-year period, 1979-2004, for northern hemisphere summer.

Figure 13. Outgoing Longwave Radiation anomalies on the left are colored, Reds and Oranges for higher OLR anomalies and Blues for lower OLR anomalies. Precipitation anomalies on the right show precipitation deficits in Brown, and positive precipitation anomalies in Green. NOAA collected these data for the 25-year period from 1979-2004, for northern hemisphere summer, May through September. Positive OLR anomalies are associated with precipitation deficits, less cloud cover, and strong radiation directly to from the warm tropical sea surface temperatures. On the other hand, the lower OLR anomalies in blue display the reduced OLR anomalies from the cooler and colder cloud tops associated with the precipitating cloud systems which produce the enhance precipitation, displayed on the right in Greens.
Concluding Notes
These concluding notes are taken from NCAR’s web page, Year of Tropical Convection. The climate alarmists are quick to tell us and the world:
“The science (of climate catastrophe from additional CO2 in the air from our use of fossil fuels) is settled!”
The words below are from a working scientist at NCAR who sees some problems:
“The realistic representation of tropical convection in our global atmospheric models is a long-standing grand challenge for numerical weather forecasts and global climate predictions.”
The page continues,
“Our lack of fundamental knowledge and practical capabilities in this area leaves us disadvantaged in modeling and predicting prominent phenomena of the tropical atmosphere such as the ITCZ, ENSO, TBO*, monsoons and their active/break periods, the MJO, subtropical stratus decks, near-surface ocean properties, easterly waves, tropical cyclones, bulk budgets of cloud microphysical quantities, and even the diurnal cycle.” <*Tropospheric Biennial Oscillation>
Acknowledgement: Steve McGee modified the animated GIF to slow it down enough for visualizations of the separate times; this slowed down GIF has been incorporated in the web page, scroll to March, 2018.
References:
https://en.wikipedia.org/wiki/Madden–Julian_oscillation
http://www.cpc.ncep.noaa.gov/products/precip/CWlink/MJO/MJO_summary.pdf
http://www.cpc.ncep.noaa.gov/products/precip/CWlink/MJO/mjo.shtml
https://www.esrl.noaa.gov/psd/mjo/MJOprimer/
https://www.esrl.noaa.gov/psd/mjo/
https://www.climate.gov/news-features/blogs/enso/what-mjo-and-why-do-we-care