
By Robert W. Endlich
Author’s Note: This is Part THREE of a four part post topic. Figure numbers remain consecutive across the four parts of the post.
Part ONE is here.
Part TWO is here.
Part FOUR is here.
Presentation is here.
ANTARCTIC ICE
We have geological evidence that since before the Mesozoic, at the very beginning of the Age of Dinosaurs, Earth was much warmer than today, and CO2 concentrations mainly due to warm sea temperatures were around 3000 Parts Per Million, (PPM), compared with the about 420 PPM today. Dr Chris Scotese, author of the Paleomap Project, says of those times, in the early Triassic, ~245 million years ago,
“Warm Temperate climates extended to the Poles.”
The science of plate tectonics was unknown in my days as a Geology undergrad at Rutgers, 1958-1962, but by the early 1970s it had been discovered that the continents (and other plates) floating on the mantle, moved as a result of convection currents within the mantle, the layer below Earth’s crust.
In 2019, I presented, “A Book Review as a learning and teaching tool, John Kehr’s ‘An Inconvenient Skeptic’.”
Kehr presents evidence that 41 million years ago the Drake Passage opened between the southern tip of South America and the Antarctic Peninsula.
This enabled the Southern Ocean’s Antarctic Circumpolar Current, circling Antarctica, to develop, and thereafter, the world’s ocean currents were no longer forced to flow pole to equator to pole. Subsequently, global temperatures began cooling. And, by 34 million years ago, global temperatures started to fall dramatically, and subsequent to that, Antarctica, previously cool and temperate, became snow-covered.
By the middle Miocene, ~14 million years ago, Antarctica and Greenland became Ice-covered, precursors of the modern planetary ice sheets.
Antarctica has accumulated ice since the development of the Antarctic Circumpolar Current and has an average ice depth over 2 km deep. We know now that more recently there has been a long series of cold periods, called “glacials,” ~80,000 years long, followed by an “interglacial” warm period about 20,000 years long. Today, we are towards the end of the interglacial called the Holocene.
Serbian geophysicist Milankovitch, analyzing Earth’s orbital cycles a century ago, predicted the existence of 41,000-year periods, the so-called obliquity cycles. These 41,000-year cycles were dominant from 2.6 million years ago to about 1.3 million years ago. But for the past million or so years the periodicity has been ~100,000 years, matching the eccentricity cycle.
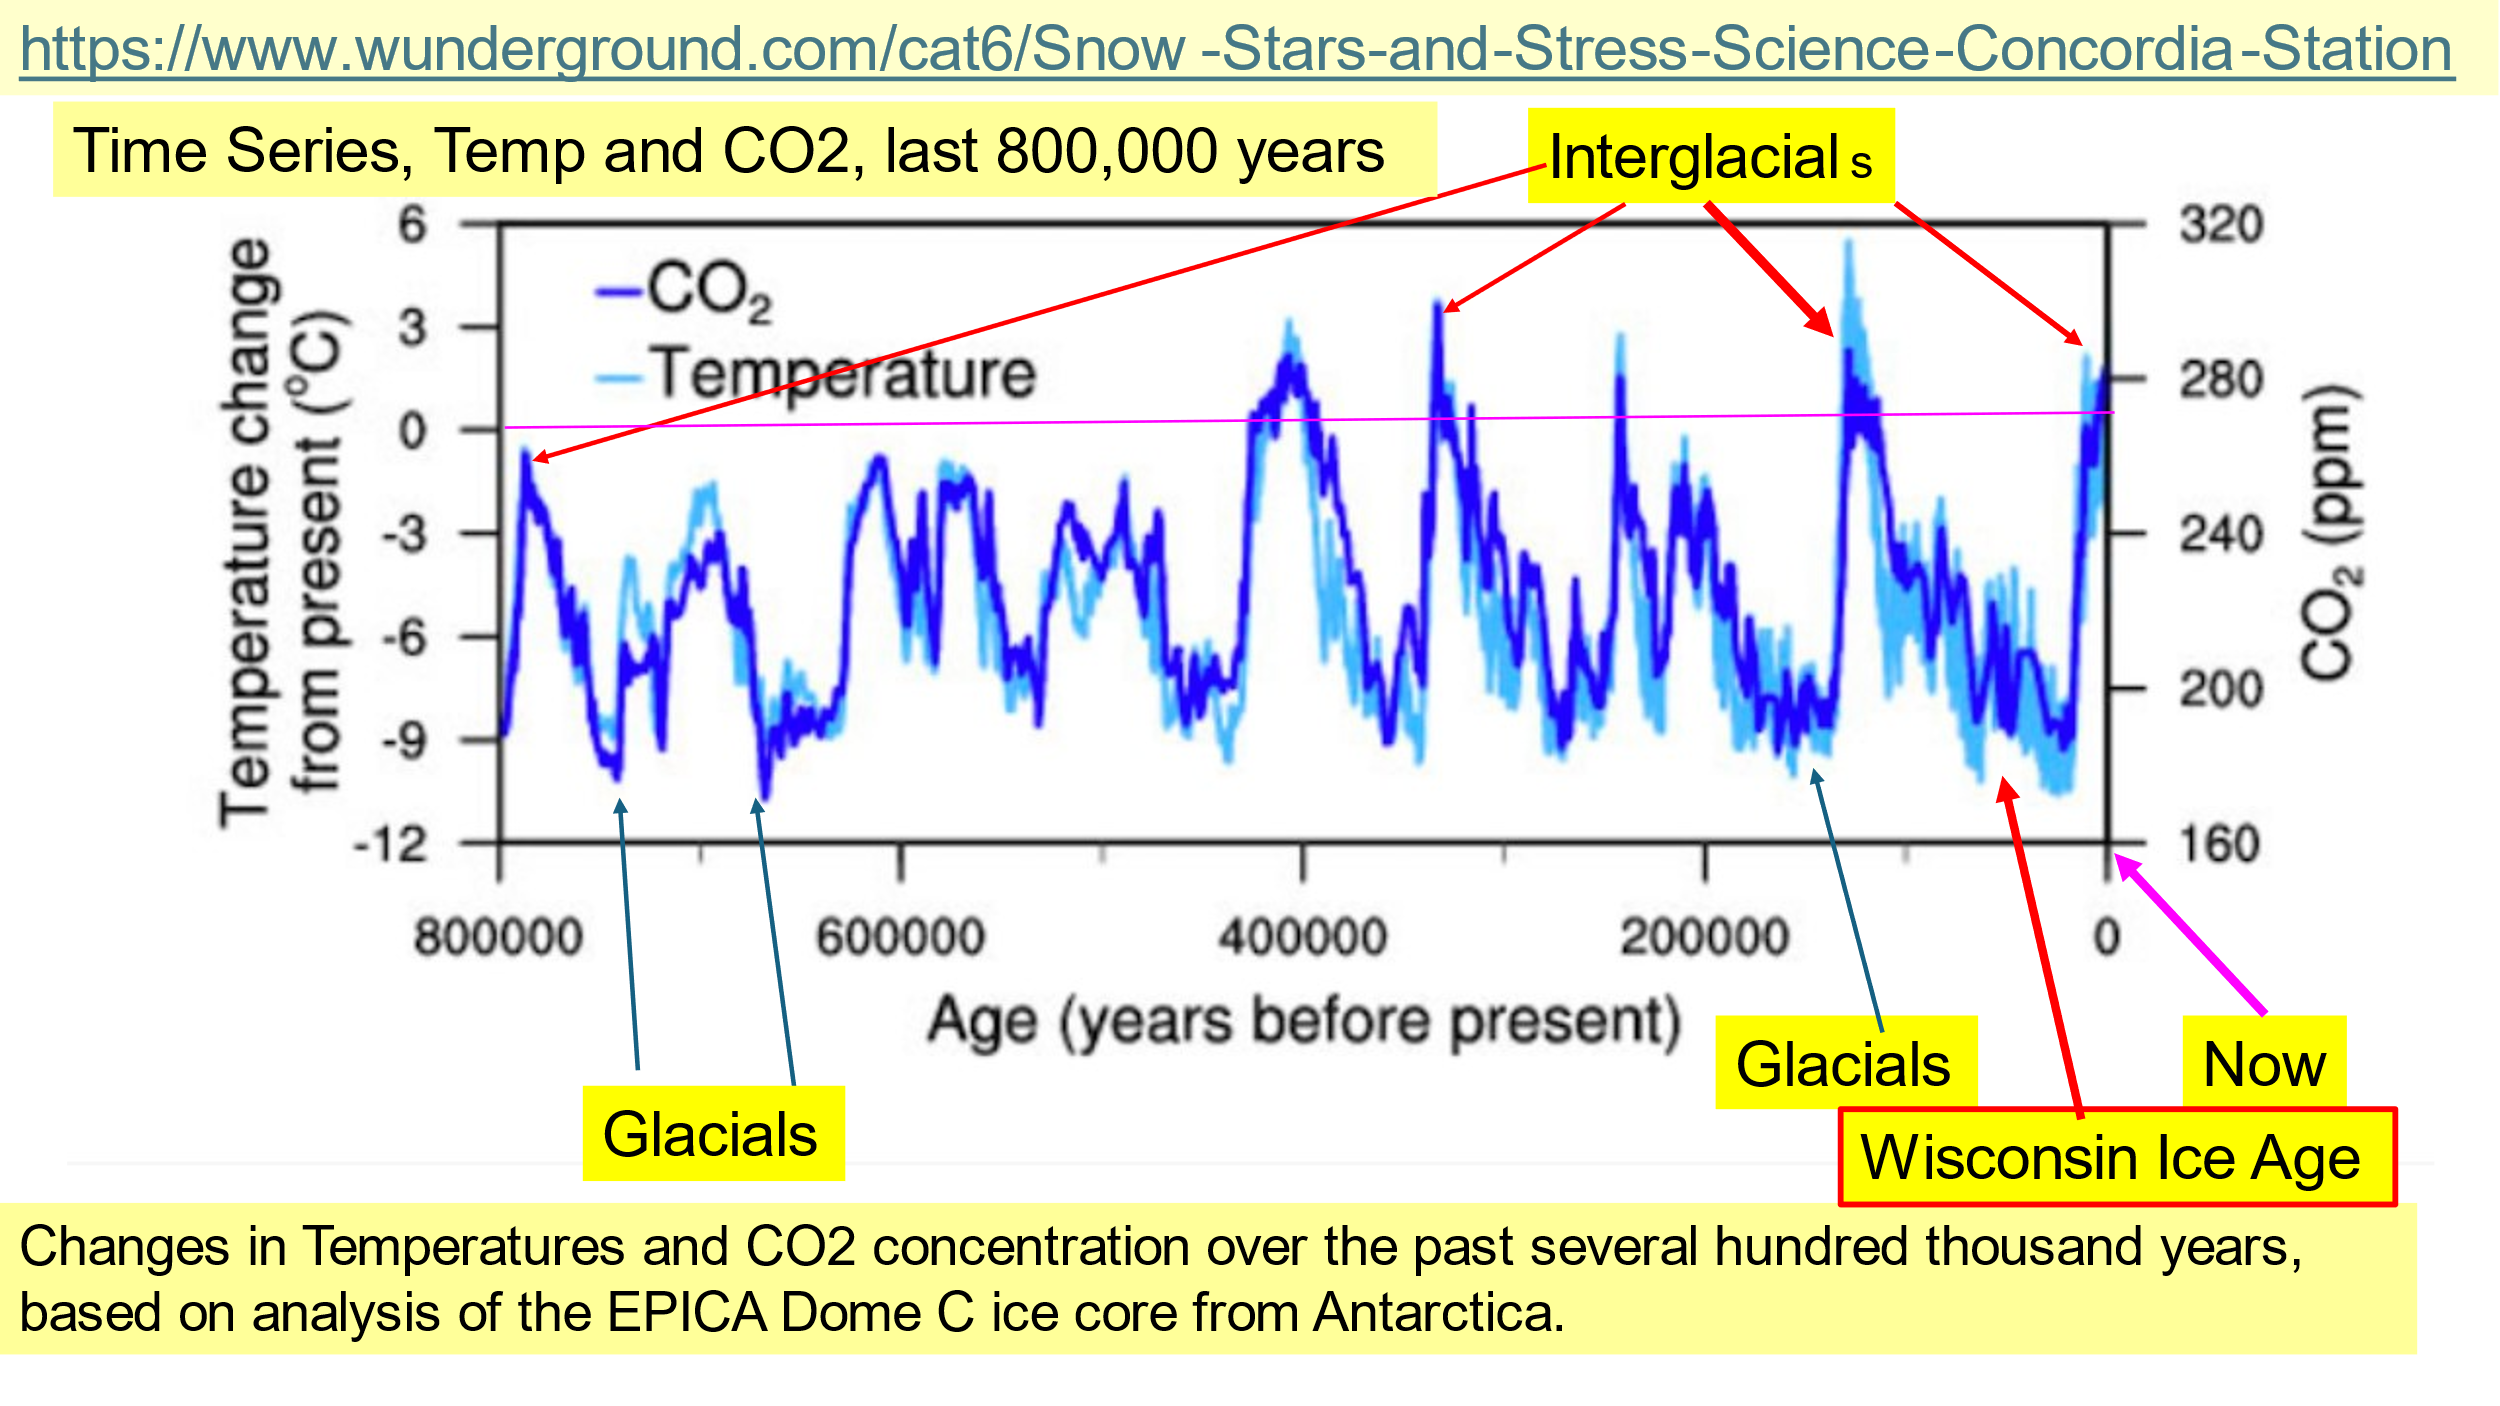
Frequently I use the Vostok Ice Cores, some 3.739 km deep, which show that now, in the Holocene, with present day <CO2> about 422 PPM, we are in the coolest of the past five interglacial periods. None of those previous warmer interglacials had <CO2> exceeding 320 PPM. This analysis of the data certainly pokes holes in the “increasing <CO2> is causing catastrophic global warming,” cry, often mentioned in the press and by certain politicians.
Figure 10 below shows ten interglacial periods in the past 800,000 years. The present interglacial is by far the coolest of the last five interglacials, with the highest <CO2>, ~422 PPM, off scale high.
ANTARCTIC PLANETARY ICE SHEET
To repeat NPR’s claim from the top,
“Now, rapidly melting ice at the poles is shifting the planet’s mass, raising the level of the ocean at the equator.”
NPR also states,
“As temperatures rise, massive amounts of ice are melting from Greenland and Antarctica.”
Neither quote contains any specific reference to measurements nor cites specific data.
When I looked for some current data, I found this story, from 19 Mar 2024, containing this quote,
“Anomalous/record-breaking cold continues to affect the lower part of the world. On Sunday, March 10, values below -60 °C were measured again in Vostok: -63.1 °C, to be exact.
As for Antarctic Sea Ice, a remarkable – and ‘overlooked’ by the MSM – reversal of fortune is taking place. The once cripplingly low extent is now higher (3,165,625 km²) than it was 27 years ago (3,075,000 km²).”
Over here, this story from 27 July 2024 tells us,
“The Chinese Academy of Sciences found that the Antarctic cold spells shattered records amid global heat waves in late winter 2023, something we never heard from the mainstream media.”
There are newspaper accounts from 1932 and 1948 showing that in the first part of the 20th Century, Antarctic Sea Ice and Ice sheets on the Antarctic Continent were shrinking well before the mid-20th Century alleged start date for Human-Caused, CO2-fueled Global Warming often cited by the IPCC. The 1948 story says that there was a
“remarkable thinning of the polar ice cap in the Antarctic”
reported by a Norwegian expedition. The 1932 story reported,
“…The Ross Ice Shelf in West Antarctica retreated 30 miles from 1840 to 1930, about five feet per day. The retreat ‘may have been going on for centuries’.” <Bold added>
Contrary to what NPR and PNAS claim about, “rapidly melting ice at the poles,” there is evidence that in Antarctica, cooling has been prevalent for at least 1,000 years.
This blog post, “Antarctica Is Colder, Icier Now Than Any Time In 5000 Years. The Last Warm Period Was 1000 Years Ago,” tells part of the story, extracted, in part, from the Jun 2023 Bulletin of the American Meteorological Society, BAMS, of all sources.
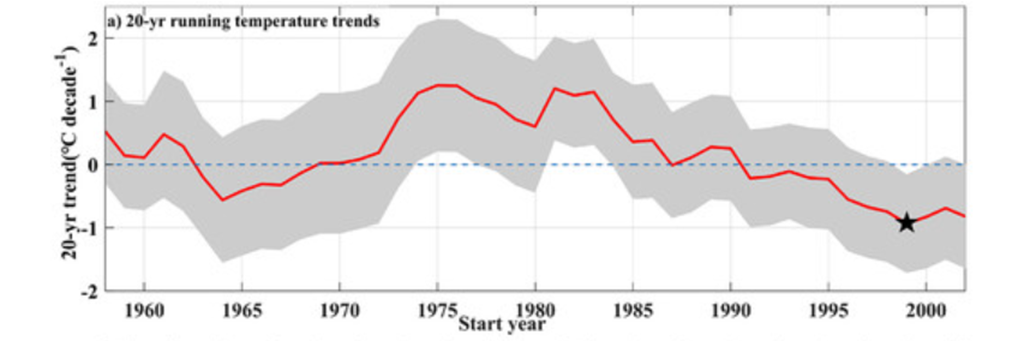
The Bulletin article argues that large, synoptic scale system movement, not greenhouse gas warming, is responsible for the dramatic temperature falls of over 1C over all of Antarctica since 1980, as shown in the temperature time series below, derived from a high-quality surface air temperature record from Byrd Station. A synonym for “synoptic scale system” might also be called, “jet stream pattern.”
According to this note from Nature, Antarctic temperatures can be inferred from the sediment in Lake Profound, on King George Island alongside the Drake Passage, Antarctica.
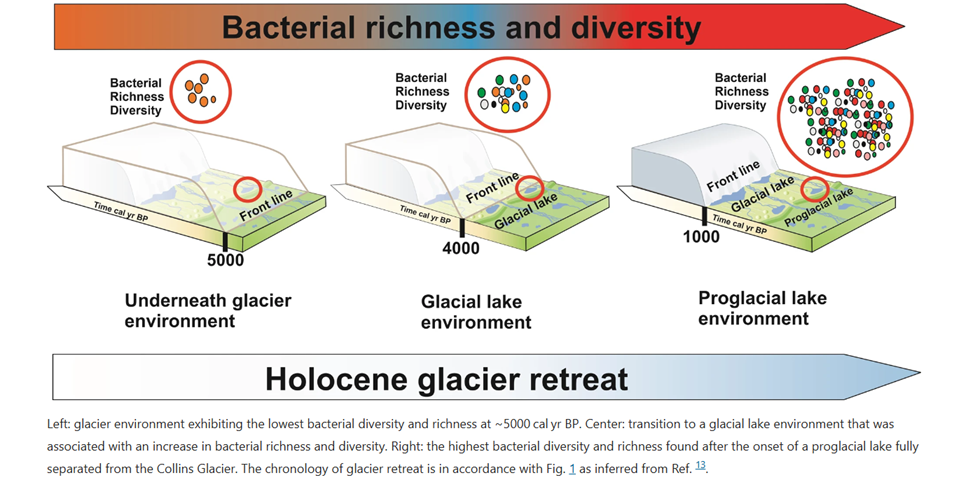
Lake Profound is on the southernmost corner of King George Island, one of the islands at the northern end of the Antarctic Peninsula. Lake Profound’s sediment change was caused by the changing location of the front line of Collins Glacier on that island. Collins Glacier at first covered, then exposed Lake Profound to become a glacial lake, then it became a proglacial lake as Collins Glacier retreated. A proglacial lake is a lake situated in front of a glacier or ice sheet, formed from its meltwaters).
At first, as the Collins Glacier began retreating, ~5000 years ago, Lake Profound was covered by the Collins Glacier, and the biodiversity of the lake’s sediment, revealed by prokaryotic debris (remains of single celled organisms) was limited. As Collins Glacier retreated, by 4,000 years BP, the richness of the biodiversity revealed in the lacustrine sediment, sediment from the lake bottom, increased, indicating higher temperatures. By 1,000 years ago, prokaryotic biodiversity reached a maximum, indicating a proglacial lake, and warmer temperatures than today.
From the NTZ post,
“In the last 1000 years this glacier has rapidly re-advanced back to the glaciated extent from 5000 years ago, which is in line with the sustained cooling trend ongoing since the Medieval Warm Period.”
Figure 12 below is a diagram of how the retreat of the Collins Glacier exposed Lake Profound to the open air from 5000 to 1000 years BP. King George Island is in the island chain extending Northeast from the Antarctic Peninsula. From left to right, Lake Profound is covered by Collins, 5,000 years BP, then, 4,000 years BP, Lake Profound was exposed as a glacial lake, later becoming a proglacial lake at 1,000 years BP, on the right.
GREENLAND ICE SHEET
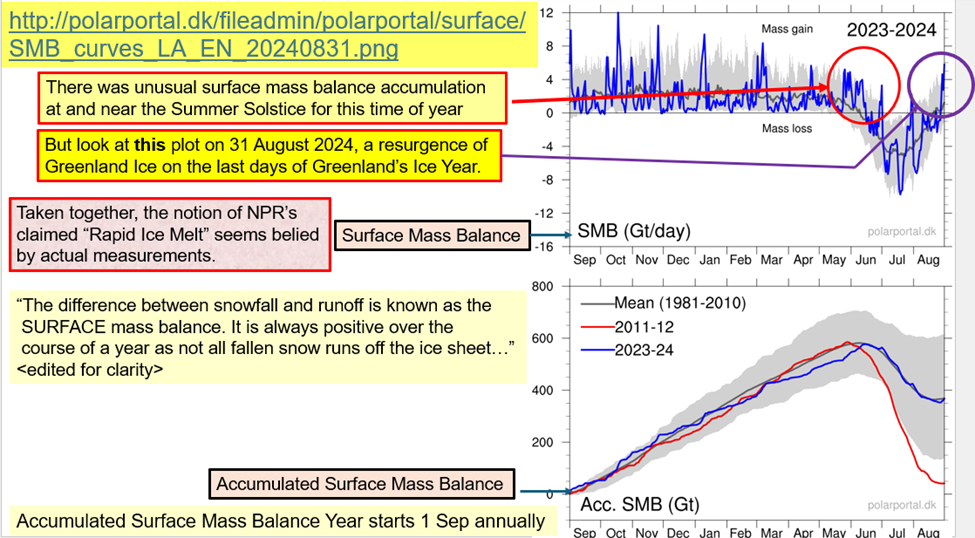
Denmark’s Danish Meteorological Institute keeps daily records on the daily, annual, and past amounts of surface ice accumulation, the Surface Ice Balance. And, for each day of each Ice Balance Year, which starts on 1 September each year, the Accumulated Surface Ice Balance is posted. These records have been kept by the DMI for many years. The data are published daily on the polarportal.dk web site. Here is the location of their 31 August 2024 post, http://polarportal.dk/fileadmin/polarportal/surface/SMB_curves_LA_EN_20240831.png
Anyone should be able to figure out how to find the web location and view any day desirable.
I copied the data for 30 August 2024, the last day of the 2023-2024 Ice year, annotated it, and pasted it below, Figure 13.
The blue line at the top of the figure represents each day’s Surface Ice Balance on top and of the figure and the Accumulated Ice Balance on the bottom <which increases until the following calendar year’s High Sun in June>.
There are significant features to this plot which put the lie to NPR’s 17 Jul 2024 claim of, “rapidly melting ice at the poles.” Just look at the red circled area which showed that, at the time of highest sun in the northern hemisphere, well above average surface ice was accumulating on Greenland.
In the bottom of Figure 13, the blue line shows, for the ice year 2023-2024, Accumulations of Ice Mass significantly MORE than the previous low, which occurred in 2011-2012. Ice Year 2023-2024 accumulation was about the 30-year mean of 1981-2010, the grey area. The data seemingly belie NPR’s claim of “rapidly melting ice at the poles.”
It seems to me that NPR is either: incorrect, or unable to find data corroborating their claims, or deliberately misstating the facts, take your choice. In any event, I don’t trust what NPR claims without checking. It seems worse than when former President Reagan said,‘Trust, but verify.”
In summary, I have shown evidence that the Antarctic ice sheet and the Greenland ice sheet are actually growing and not “rapidly melting” as is frequently stated by NPR and the mainstream media.
In Part FOUR of this series, I will provide a general summary of this four-part blog and provide some editorial conclusions.