
Robert W. Endlich
A couple of months ago, while waiting in the doctor’s office, I happened upon the Winter 2021 edition of Sierra, magazine of the Sierra Club; the lead editorial, “The New Abnormal” by editor Jason Mark caught my eye, and I read it. I was expecting global warming ignorance and was not disap-
pointed by Jason Mark’s prose. Jason Mark gets to his points quickly:
“Twenty twenty-one was the year that the climate crisis became unavoidable. With any luck (if you can call it that), in hindsight this will be seen as the year when Americans finally, belatedly, came to understand the severity of the crisis. The evidence has been impossible to ignore: a freakish winter deep freeze that shut down much of Texas, another horrific fire season in the West, a historic heat wave in the Pacific Northwest, a spate of deadly floods in the South quickly followed by Hurricane Ida—a storm so powerful it ended up killing dozens of people in the Northeast, more than a thousand miles from where it made landfall.”…”The alarm bells are clanging.”
So, Marks thinks unusual weather is “freakish” and “evidence” of human-caused CO2-fueled global warming, and that our use of fossil fuels and the resulting increase in <CO2> is causing unusual weather events, and by implication, and by direct statement later in his editorial, human actions can prevent unusual, and especially, record-setting weather events.
JASON MARK, WEATHER AND CLIMATE EXPERT
What special tools does Jason Mark bring to the table to ascribe his ability to make such pronouncements on the state of the atmosphere? Within the editorial he seems to proclaim such powers from his educational achievement:
“I have a degree in international relations from Georgetown University and a certificate in ecological horticulture from the Center for Agroecology and Sustainable Food Systems at UC-Santa Cruz.”
Since I served as a Weather Officer in the Air Force for over 21 years and having worked as a Meteorologist for over 49 years, I was curious about what academic gifts his education gave him in weather and climate. So, I looked up the International Relations Department’s coursework requirements at Georgetown.
In my judgement, there is nothing in Jason Mark’s academic background or on his web site that would qualify him to know anything about the predictability of future states of the atmosphere. There are no coursework requirements in mathematics, calculus, meteorology, chemistry, physics, thermodynamics, computer science, statistics, fluid dynamics…or even Climate History.
Jason Mark’s personal web site is here.
Let’s examine some of Mark’s pronouncements on the weather events of 2021 he finds as “evidence “of human causation:
THE TEXAS DEEP FREEZE OF FEB 2021
Jason Mark claims the freeze of Feb 2021 was “freakish,” but an NWS report on “The Intense Cold Wave of February 2011,” has its focus on El Paso, TX, and nearby areas of New Mexico. This report uses the number of consecutive days when temperatures failed to reach 32F as the figure of merit in determining the severity cold waves.
There were two occurrences when temperatures did not exceed 32F for four or more days, seven occurrences when temperatures did not exceed 32F for three or more days, and ten occurrences when temperatures did not exceed 32F for two or more days, with episode of 12 Jan 1962 being the most extreme event.
Altogether, there were nineteen episodes when temperatures did not exceed 32F in the 136-year period from 1887 to 2023. This points to the 2023 cold weather event being simply a rare weather event, an episode which occasionally occurs, but cannot be considered “freakish,” if one examines published weather records extant in Texas.
THE 2021 BURNING, HOW DOES IT COMPARE WITH RECORDS?
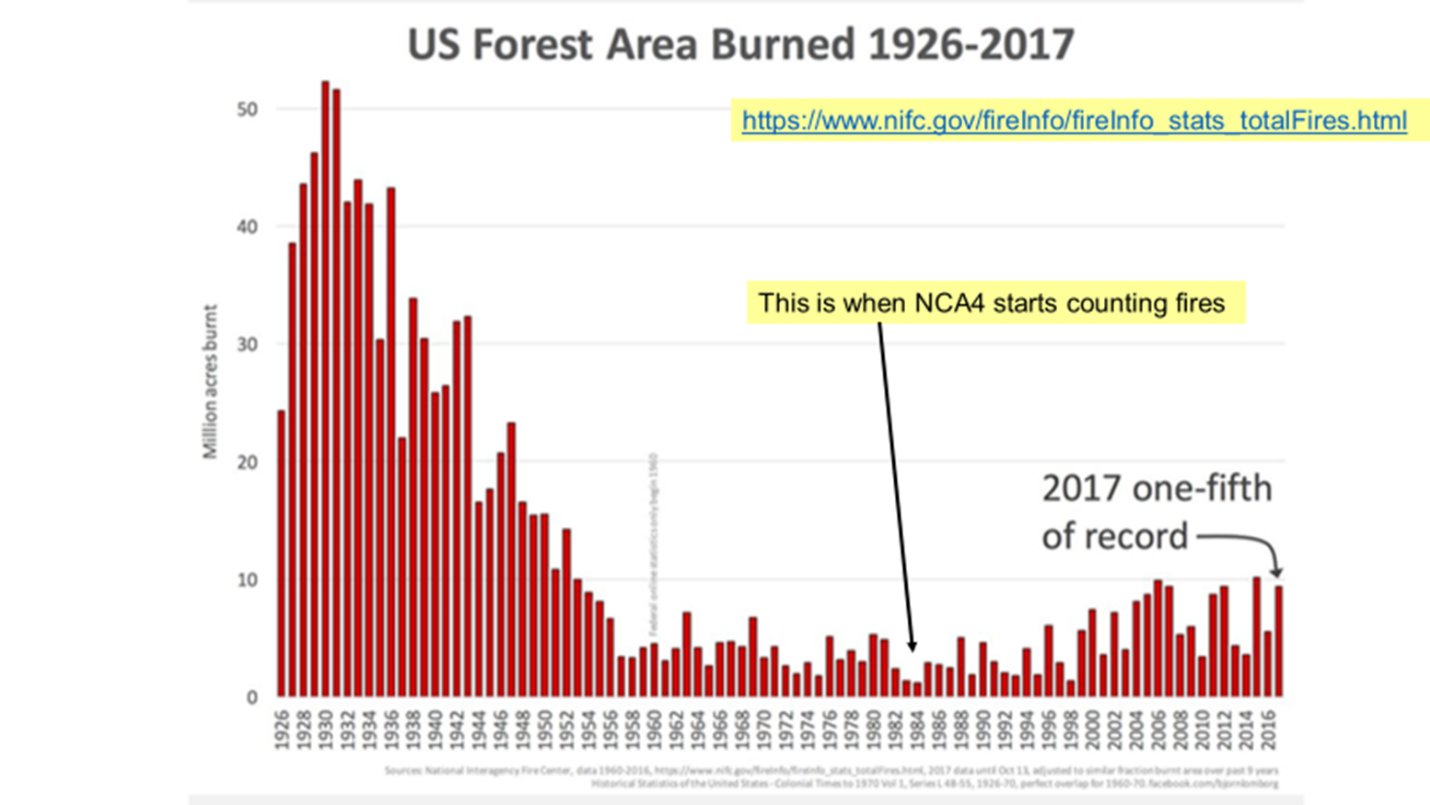
The National Interagency Fire Center, NIFC, lists the 2021 burned acreage as 7,125,643 acres burned. NIFC also says at the same location, “Prior to 1983, the federal wildland fire agencies did not track official wildfire data using current reporting processes. As a result, there is no official data prior to 1983 posted on this site. “
COMMENT 1: This quote from Tony Heller, “Forest Fire Burn Acreage Down 86% Since 1930,” and his following quote,
“Actual data wrecks their global warming scam, so climate experts simply throw out all data prior to the appropriately chosen start date of 1984.”
This is one of many instances where US Government employees are active participants in the global warming scam.
COMMENT 2: For decades publications such as the New York Times regularly reported the Government’s own NIFC data in articles about the forest fire burn acreage totals in the US over the decades. One instance of a plot of those data is in Figure 1 below, which I captured from NIFC in 2017. As you can see from Figure 1, a 2021 total of a little over 7 million acres burned is about one seventh or about fourteen percent of the burn acreage reported around 1930 in the USA. For Jason Mark to report such a burn acreage as “horrific” shows to me that he lacks the ability to look up historical data, engage in critical thought, or both, which seem to me skills a journalist of his experience and reputation should possess.
HURRICANE IDA
According to Jason Mark, 2021’s Hurricane Ida,
“a storm so powerful, it ended up killing dozens of people in the northeast, more than a thousand miles from where it made landfall,”
is his “evidence” that CO2 has made hurricanes so “powerful” that a hurricane with a death toll of dozens should convince readers of his self-proclaimed “truth.”
Meteorological figures of merit, ones I used in this instance, come from the descriptions of 1954’s Hurricane Hazel and her effects, from the Wilmington and Newport-Morehead City Offices of the National Weather Service. From those hurricane descriptions, Hazel first made landfall in western Haiti, where she killed 400-1000 people, and plowed a path of destruction from the NC-SC border to Ontario, Canada, where an additional 100 people died.
According to Distance World, the distance from Port-au-Prince Haiti, to Toronto, Ontario, Canada, is 1779 miles.
So, in Jason Mark’s and Sierra Club’s world, we are to think that the 2021 path of Hurricane Ida, with a death toll of “dozens,” “more than a thousand miles from landfall” is evidence that our use of fossil fuels and the resulting increased CO2 has made hurricanes “more powerful”, while Mark and the Sierra Club ignore1954’s Hurricane Hazel with death tolls of 400-1000 in Haiti, 95 in the USA and 100 in Ontario, Canada, 1779 miles from Haiti. The word ignorance aptly describes Jason Mark’s article and words.
Jason Mark ascribes to himself humanity’s ability to “prevent climate change,” if only the masses would heed his words:
Marks:
“We know precisely what we need to do: Stop burning coal, oil, and gas as fast as possible.”
CHANGES IN TOTAL SOLAR IRRADIANCE (TSI) HELP EXPLAIN EARTH’S TEMPERATURE CHANGES AFTER 1900
There are at least two reasons explaining why the recent planetary warming has occurred; neither has the slightest to do with human actions:
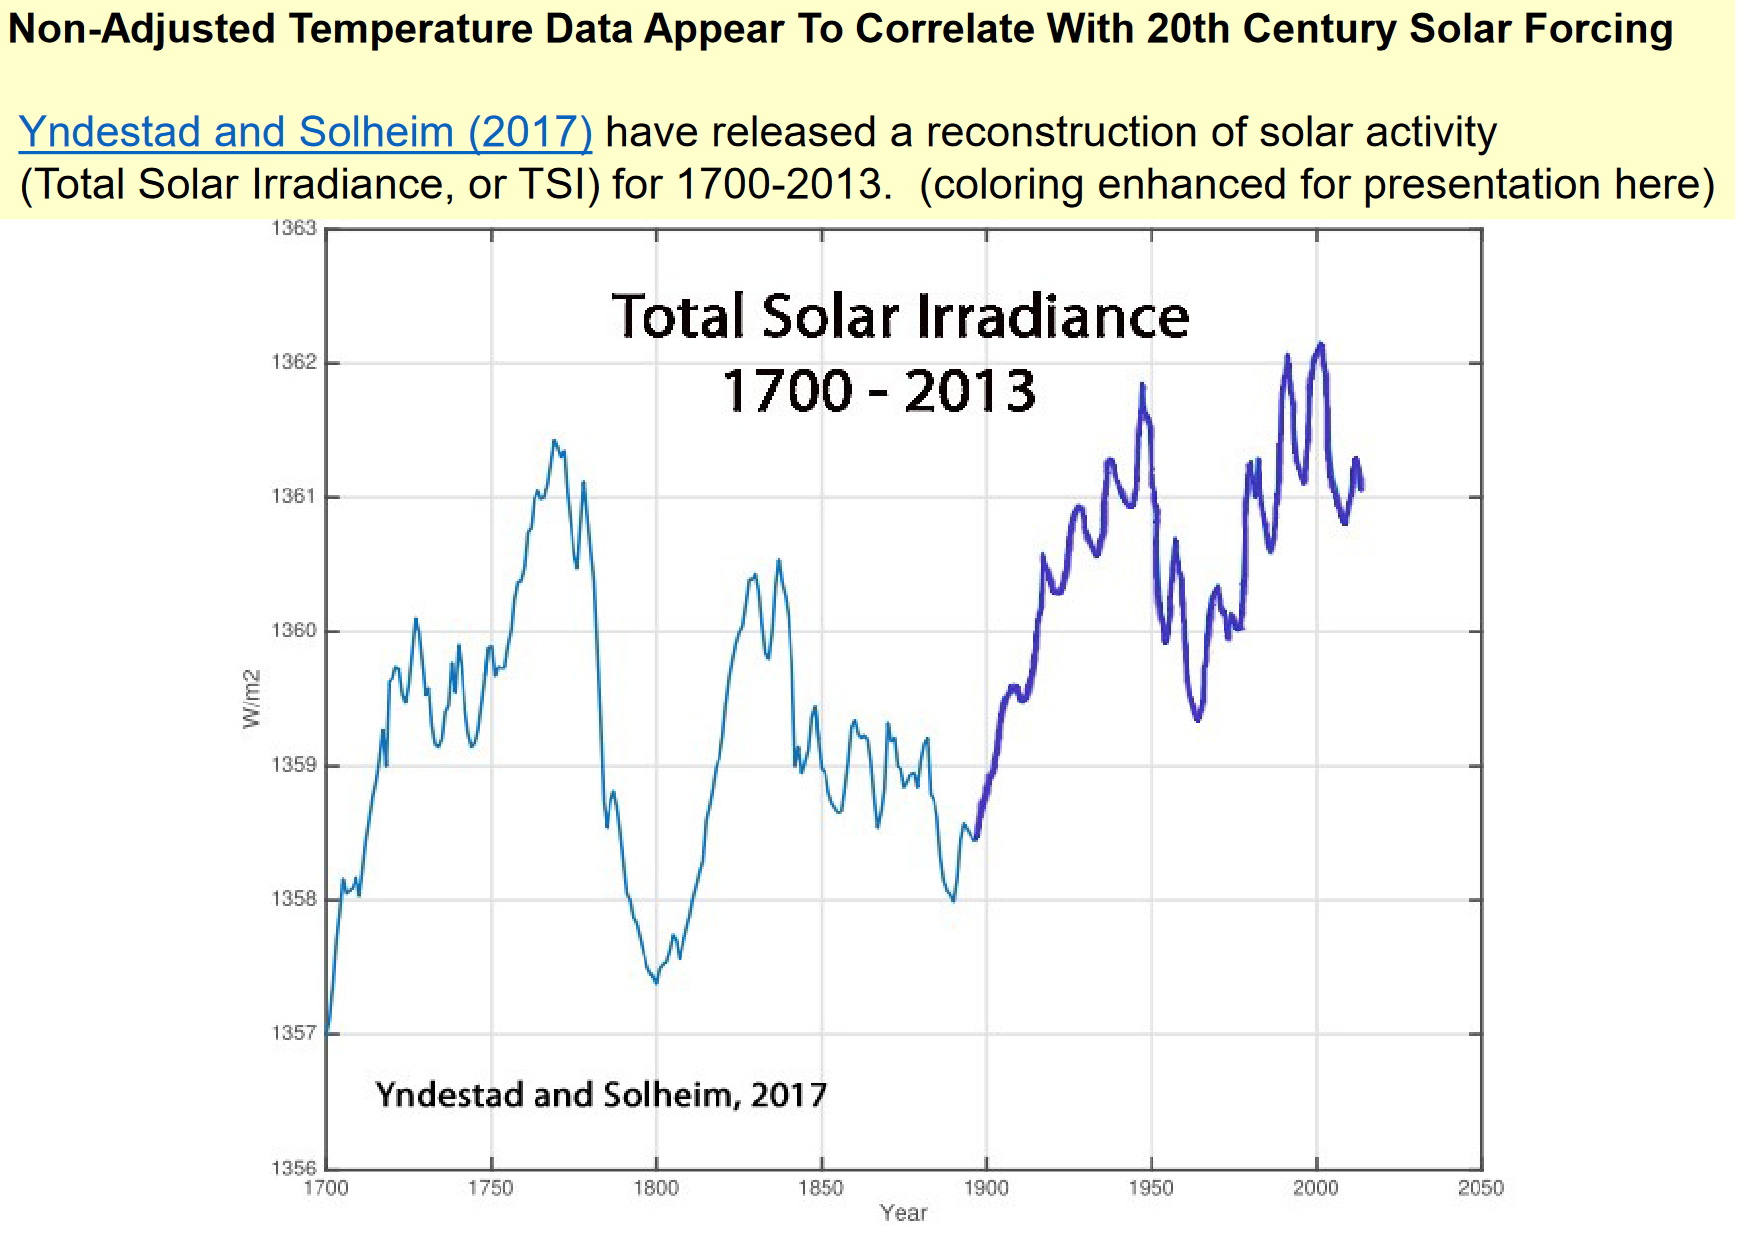
According to the analysis done by Yndestad and Solheim (2017) , the total solar irradiance received at the top or Earth’s atmosphere is affected not by a simple elliptical path of the Earth around the Sun, but a more complicated function, which allows for the position of the Sun to “dance” in its position, according to the gravitational influence of the gas giant planets, Jupiter, Saturn and Uranus, and which is displayed in Figure 2 below.
I compared the Total Solar Irradiance, TSI, the measure of the strength of the Sun’s intensity integrated over all wavelengths, at the top of the atmosphere, as computed by Yndestad and Solheim with reported northern latitude Temperatures (north of 23.6 Latitude) published by Hansen, et al, 1981. This Hansen, et al, paper had disappeared from the NASA web site, and from other locations, so we put it on our web site.
Said comparison is below, in Figure 3.
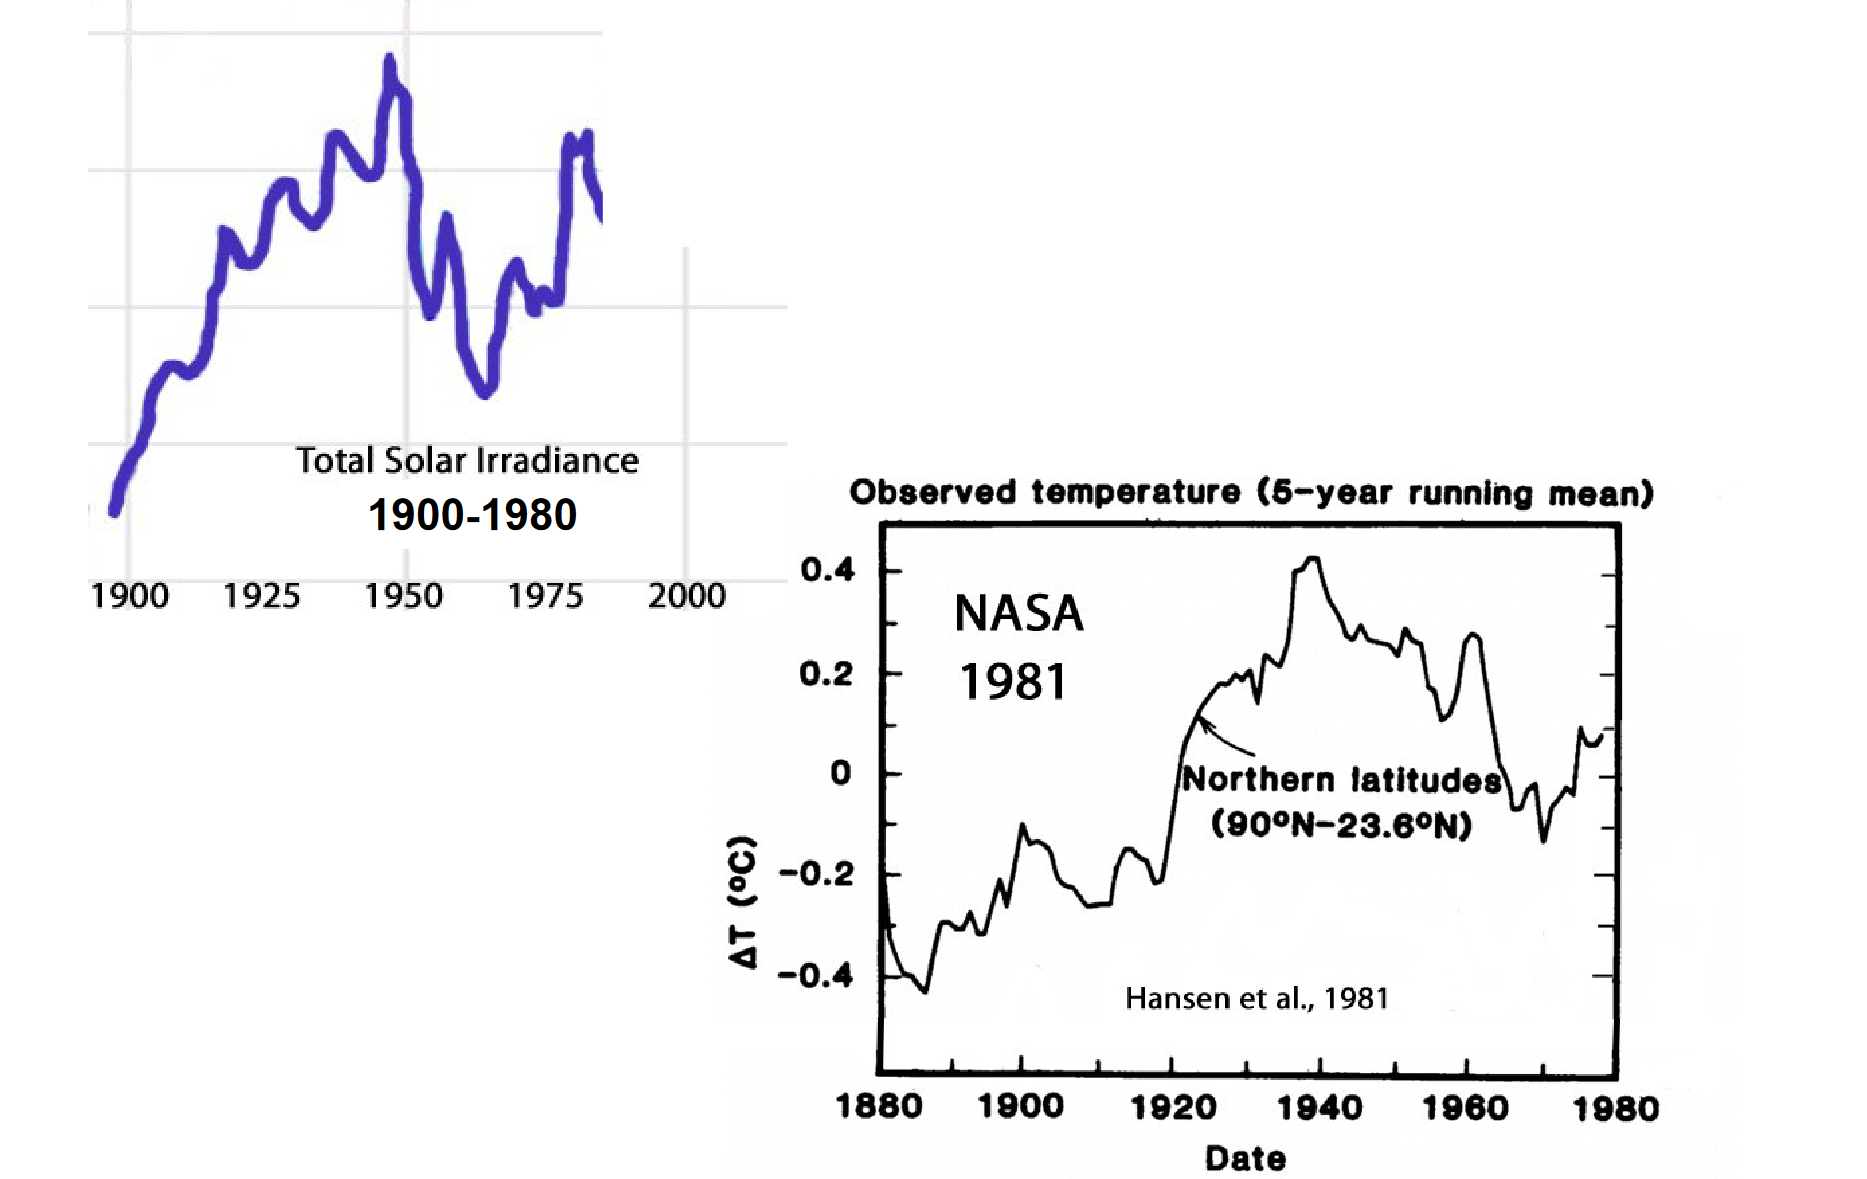
The computed (by Yndestad and Solheim) TSI time series of temperature explains most of the variations of surface temperatures reported by Hansen. The nearly monotonic increases in <CO2> can not and do not explain the many jigs and jags in temperature that are seen in the Total Solar Irradiance time series.
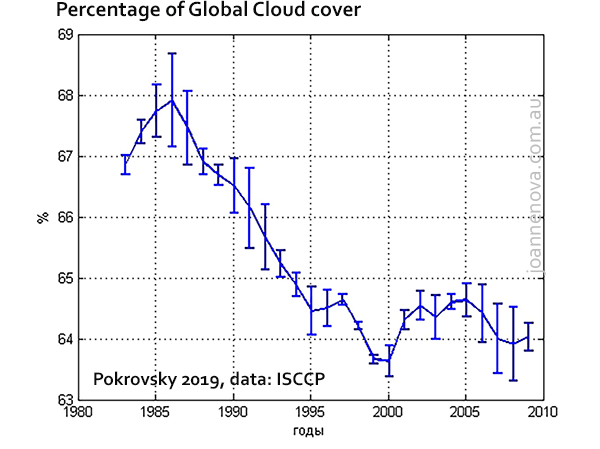
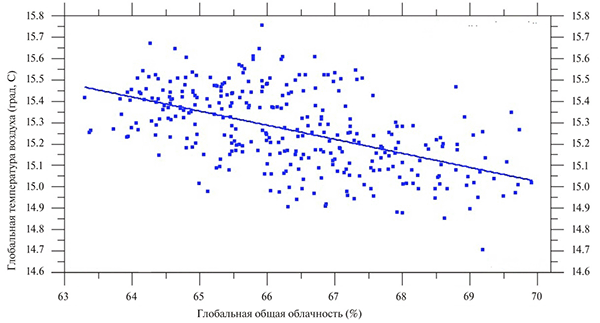
RECENT CHANGES IN CLOUD COVER EXPLAIN RECENT WARMING
Joanne Nova’s 2019 blog post cites a paper by Pokrovsky which shows that, since the early 1980s, global cloud cover decreased, as was determined by satellite measurements published by the International Satellite Cloud Climatology Project, the ISCCP. Further, Pokrovsky showed that as the cloud cover decreased, there was a distinct increase in the global temperature.
Figures 4 and 5, also taken from the CASF July meeting presentation graphics, clearly show this result.
SUMMARY AND CONCLUSIONS
Sierra Club’s editor Jason Mark calls several weather events of 2021 “evidence” humans are having an adverse effect on weather and climate; he calls this a “crisis.”
Mark calls the cold snap, the weather event which paralyzed most of Texas in Feb 2021 “freakish,” but I quickly found this report from the El Paso office of the National Weather Service, which counted nineteen separate episodes in which surface temperatures did not exceed 32F for at least two days in the 136-year period from 1887 to 2023. A rare event, yes, but it was not a freak of nature.
Mark:
“2021: Another horrific fire season in the West.”
In 2021, the total of a little over 7 million acres burned is about one seventh or about fourteen percent of the burn acreage reported around 1930 in the USA, as shown in Figure 1.
Mark declares that CO2 made 2021’s Hurricane Ida more powerful because it killed “dozens” of people some one thousand miles from landfall, but Mark is ignorant of the historical record which shows 1954’s Hurricane Hazel, with her death toll of up to a thousand who died in Haiti, and the hundred more who died in Canada, some 1779 miles from Haiti.
Similarly, Jason Mark is ignorant of the changes in Total Solar Irradiance since 1700 which explain many of the changes in Earth’s temperature recorded and plotted by James Hansen of NASA. Moreover, Mark is unaware that measured decreases in global cloud cover explain the warming observed since 1980.
We can conclude that Jason Mark is generally ignorant of historical weather data. His and other alarmists’ tendency to erroneously blame changes in the climate and weather (real or imagined) on carbon dioxide put into the atmosphere by human activity are marks of both ignorance and lack of critical thinking skills.