
Robert W. Endlich

During the comments and questions part of the 15 July 2023 meeting, CASF Member and physicist Edward Burlbaw suggested that we find a “perfect 10 or 12” images that any CASF member might pull up, for instance, on a cell phone, to show their climate alarmist friends data or graphics to dispel the current climate alarm in the mainstream media (MSM), Governments, Academia, and popular culture.
So, with that as background, this is an admittedly different kind of post for this site. I used the 19 August 2023 meeting of CASF as an opportunity to describe some of what I call the “insanity” of the climate alarmist positions, “insanity” to describe the lack of knowledge combined with lack of critical thinking in those sectors of society mentioned above.
AUGUST’S CLIMATE-RELATED NEWS STORIES: PROPAGANDA
To start off the 19 August 2023 meeting, I presented some items from current events, some of which had been posted on other climate websites, showing how the current climate discussion in pop culture is not only wrong, but devoid of critical thought as it is presented, especially in the MSM. My introduction is posted here: https://casf.me/wp-content/uploads/2023/08/Links-and-images-to-climate-stories-in-the-news-3d-week-of-August-2023.pdf
The World Wildlife Fund has a post titled, “Why are Glaciers and Sea Ice Melting,” but my graphic shows that September sea ice extent in the Antarctic has been increasing at least since 1980.
NO, SAGUAROS ARE NOT KEELING OVER FROM THIS SUMMER’S TEMPERATURES
Here is a TV story, one of many, that purport to show that this summer is so hot that Arizona’s Saguaro cactus are dying from the heat. There’s another one, this one in print. So, I showed a couple of images from Tony Heller’s Blog showing that these stories are a bunch of hooey. Looking carefully, the alarmist’s ‘dead from the heat Saguaro’ photo itself shows healthy and viable Saguaros and other cacti in the background of the fallen Saguaro. The Saguaro supposedly dead from this summer’s heat died quite some time ago. In the image, there are only wooden Saguaro frame pieces; there are no vegetation chunks or fleshy plant material currently rotting in the sun. This shows that this cactus, near the end of a well over 100+ year lifetime, had not died recently from the heat, but had been dead for quite some time, many months ago, perhaps a couple of years. This is pure propaganda!
Before I presented on 19 Aug 2023, I sent to a subset of the CASF membership a draft of the set of images showing the error of the alarmist position which I had gathered. A version of this group of images is the second of three graphic sets for the 19 August meeting. That second one turned out to be about 91 graphics long, a behemoth, and admittedly nowhere near a “Perfect Dozen.” CASF Member Bill Gutman, another physicist, suggested that perhaps a version of the 91-slide behemoth might be useful for those with a science background, which gave me the idea for the suggestion in the next paragraph.
That idea is that there should be on the web site, perhaps in separate topics in New Visitors, TWO sets of graphics, a larger one for scientists and those with a science background, and a smaller one, more in the Perfect Dozen category, suitable for the lay audience.
THE “GOOD OLD DAYS” DID NOT HAVE TODAY’S INTERNET SEARCH TOOLS
My personal observation is that dispelling the notion that we are in or headed for climate catastrophe is a “target-rich environment.” Today, there are so many examples showing the present climate is not extremely hot. There are places and examples, posted on the Internet, that are searchable and findable by anyone with curiosity and even a limited ability to use search terms. Sources and resources are available with a few taps of the keyboard and a few clicks of the mouse to anyone with a personal computer, a search engine, and an internet connection.
During my graduate work at Penn State, from late 1967 to early 1969, our research resources were mainly found in the Earth and Mineral Sciences Library, on the second floor of the Deike Building, first by searching the card catalog, then walking into the stacks to find the books or periodicals that we found listed in the card catalog. That Library also had a microfiche reader, and a printer (for the materials found in the fiche) for publications having only fiche images of print material. Weather information was found in the Observatory on the top floor of that same Deike Building, looking out the windows and using the weather teletypes and facsimile machines there.
Now, anyone with curiosity, critical thinking skills, and the computer resources mentioned above and literacy in English (for the anglophile world) can be their own credible researcher.
Both the ~91 slide behemoth and the smaller perfect dozen slide set have redundant images, each having possibilities and ideas for consideration as we cut each set down to a more manageable size. Each graphic set is indeed too big. Each slide set is a brainstorming group of ideas.
2000 YEARS OF PROXY TEMPERATURES SHOW “THOUSAND-YEAR” CYCLES.
When a physical property of materials found in nature is dependent on temperatures, and substances dependent on that property have accumulated over long periods of time, it is possible to reconstruct good estimates of the temperature time history. These become proxy temperature time series.
Proxy temperatures of the past use fossils and other materials sensitive to temperature during their formation as a substitute for modern thermometers to determine temperatures and temperature trends for times before thermometers were invented.
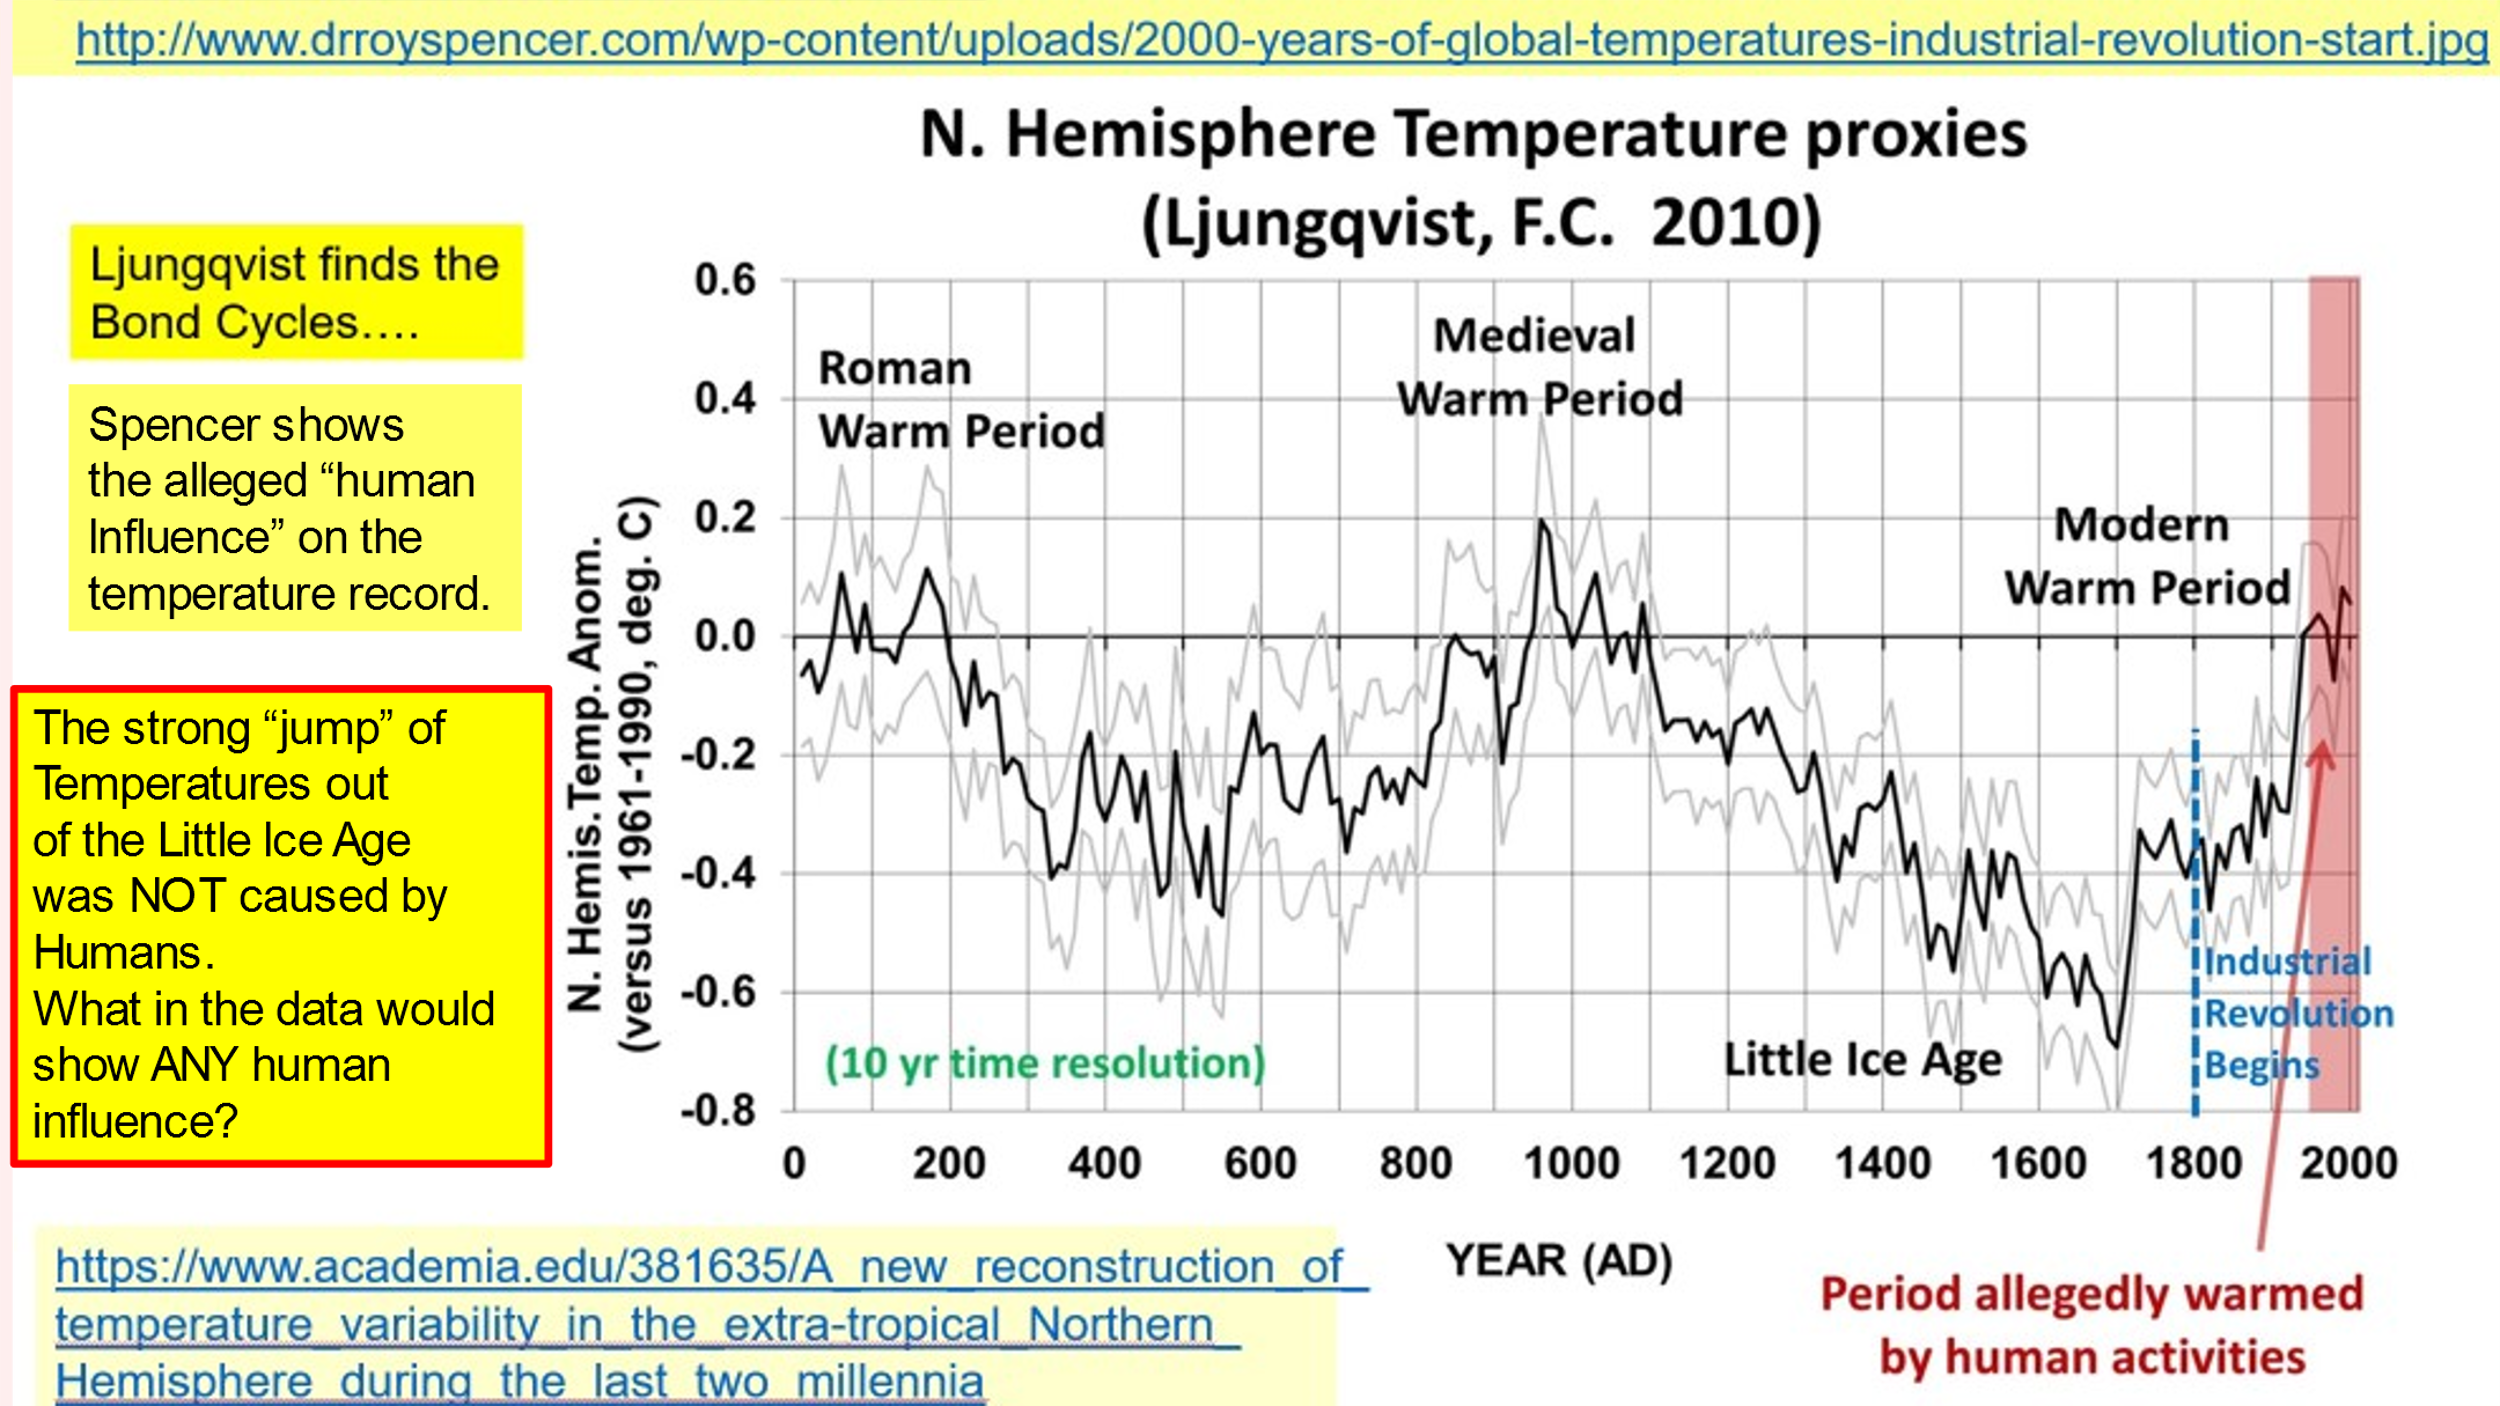
Figure 1, below, from Sweden, “A New Reconstruction of Temperature Variability in the extra‐tropical Northern Hemisphere during the last Two Millennia,” shows a multi-proxy temperature time series for the northern Hemisphere constructed by F. C. Ljungqvist. This chart is a great example to show the natural “thousand-year” temperature cycles first discovered by the late Gerard Bond, and published in SCIENCE. These cycles could not have been human caused.
Dr Roy Spencer from the University of Alabama, Huntsville, provided annotations to Ljungqvist’s chart during his testimony before the Senate EPW committee in July 2013.
Look carefully at Figure 1. None of the temperature changes before 1800 could possibly have been caused by humans. Note especially the huge jump in temperatures immediately after 1690, the jump in temperatures that heralded the end of the Little Ice Age which was the coldest period in the previous 10,000 years.
GREENLAND ICE CORES: THOUSAND-YEAR TEMPERATURE CYCLES ARE PERVASIVE DURING HUMAN HISTORY SINCE THE LAST ICE AGE
Alleged Climate Expert and former Vice-President Al Gore cites the Vostok Ice Cores during his science fiction movie, “An Inconvenient Truth.” The Vostok Ice Cores ARE useful proxy temperature time series, and we’ll see them referenced later in this post. Let’s continue to look at the “thousand-year” cycles which are present in another set of ice cores, the Greenland Ice Cores.
Both Antarctic and Arctic ice cores can be useful in their determination of proxy temperatures from the analysis of the Oxygen 16 to Oxygen 18 isotope ratios of water. In the case of Greenland, warm Gulf Stream water evaporated to become water vapor, then condensed to become liquid water in clouds, then froze to solid water in the form of snow crystals, which, after precipitation accumulation on the ground and burial, changed form again to become layers of ice. Each year’s winter layers of snow and ice are separated by a layer of dirt and dust which is deposited in the summer months.
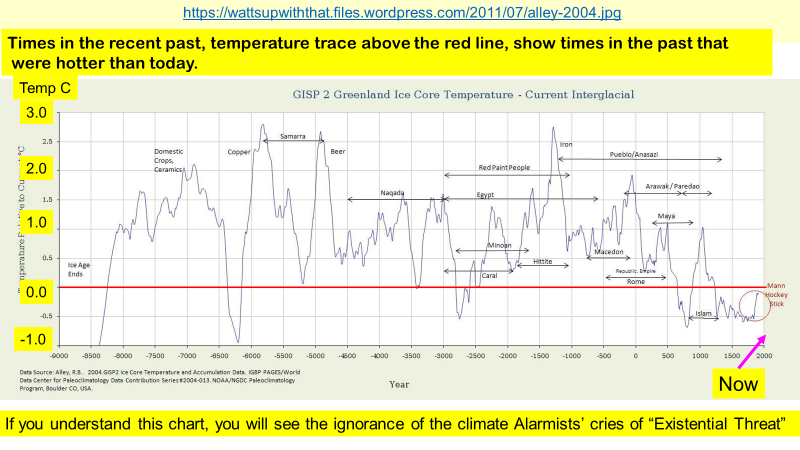
One of the most useful tools in Arctic proxy temperature reconstruction is the GISP 2 ice core. The time series of temperatures from the GISP 2 series was published in 2004, ironically, by noted climate alarmist Richard Alley of Penn State. Look at that annotated time series of temperatures from WUWT below and see the “thousand-year” fluctuations on top of Holocene temperatures which peaked about 8,000 years ago.
THE VOSTOK ICE CORES FROM ANTARCTICA SHOW THE LIES THE ALARMISTS TELL
Another very useful proxy temperature set, mentioned above with regard to VP Al Gore’s misuse of the data, comes from the ice cores drilled at Vostok Station, Antarctica. These ice cores go back in time much further than Greenland’s Ice Cores because Ice has been accumulating there for a much longer time than in the Arctic or Greenland. The information showing this is in this post from 2019, which shows that plate tectonics opened the Drake Passage between South America and Antarctica about 42 million years ago and snow and ice started accumulating in Antarctica about 33 million years ago. The Arctic and Greenland’s ice sheets originate about 2.6 million years ago, and perhaps a million years ago the ~100,000-year cycles of glacials and interglacials became prominent.
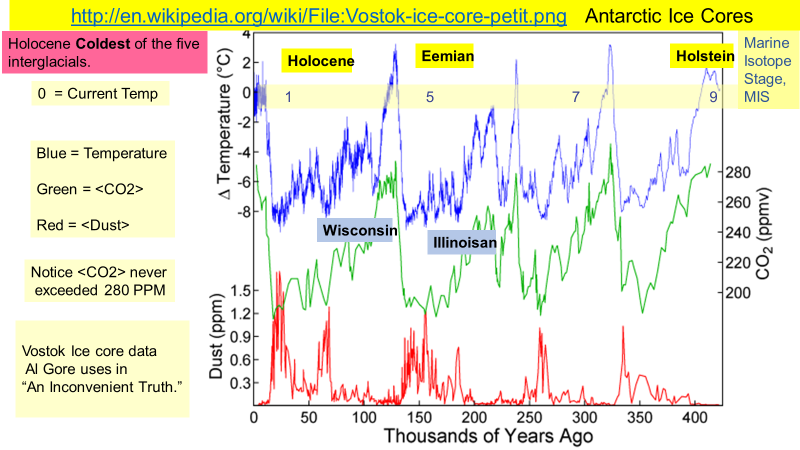
Wikipedia shows a Temperature, <CO2>, and Dust time series graphic from the Vostok Ice Cores derived from a paper by Petit et al, which is shown in Figure 3 below. Looking at that time series is instructive to the reader and destructive to the alarmist rant that changing <CO2> controls temperature.
The blue time series is temperature for the past ~425,000 years. Peaks in temperature are interglacials, while valleys in temperature are glacial periods. The present interglacial is called the Holocene, but it is also Marine Isotope Stage 1 in the stack of temperatures for the past 5.3 million years, derived by Lisiecki and Raymo.
The present temperature is zero on the X-Axis.
In the ice core data, the peak <CO2> for the past ~425,000 years was 280,000 Parts Per Million, PPM. The present (Aug 2023) <CO2> is about 417,000 PPM.
Note well these features from Figure 3’s time series:
There are numerous temperatures in the Holocene that are +/- 1.5C excursions from the present temperature, none of which could have been human caused. In fact, there are some temperature excursions of +/-2C present in the Holocene.
There are FIVE interglacials shown with the maximum <CO2> of 280,000 PPM determined from the ice in the ice cores.
BY FAR, this interglacial, the Holocene, is the coldest of the five.
So, the notion that <CO2> controls temperature is demonstrably false with respect to the previous four interglacials. Note well, with the present <CO2>about 417 PPM, we are nowhere near the maximum temperature even within the Holocene, let alone the past 425,000 years.
WHAT HAVE WE LEARNED HERE?
Natural fluctuations in temperature have occurred in the past without any help from us humans. Despite current <CO2> being about 417 PPM, temperatures are nowhere near the maximum of the Holocene, the time since the last glacial maximum.
Within the last several thousands of years, there is a distinct “thousand-year” periodicity of temperatures first published by Gerard Bond of Columbia University in 1997. The data in Figure 2 show that most of the temperatures in the Northern Hemisphere have been distinctly warmer than at present, despite today’s <August 2023> <CO2> being about 417 PPM.
Within the past nearly half million years there have been five interglacials. The previous four interglacials have been distinctly warmer with maximum <CO2> never exceeding 280 PPM.
Critical examination of the data here, especially in Figure 3, show that the cries of an “existential threat” to humanity because of the present rise in temperatures are silly.