Roy W. Spencer, Ph. D.
[This blog by Dr. Roy W. Spencer was originally published on his blog site on 8 November 2024. It is reproduced here under the fair use doctrine and with standing permission from the author. Ed]
 Key Points:
-
-
- Over the years, a few commentators have have argued that the world record highest temperature of 134 deg. F at Death Valley, CA recorded on July 10, 1913 is physically implausible.
- Here I show quantitatively that the 134 deg F temperature is biased high, by about 10 deg. F.
- Extensive historical research by William T . Reid has suggested the person making the temperature observations at Greenland Ranch likely replaced the official measurements from a thermometer in a Stevenson screen shelter with other measurements made next to the adobe living quarters.
-
Update #1 (11/8/2024): Fixed a few typos.
Update #2 (11/8/2024): For those messaging me about Furnace Creek temperatures reaching 130 deg. F in recent years, see Bill Reid’s summary of side-by-side measurements made there [and reported at an AMS meeting] showing the non-aspirated “official” equipment produces temperatures 2-3 deg. too high during light wind conditions.
Update #3 (11/9/2024): Bill Reid corrected my use of the term “mountain” stations to describe those not in Death Valley. Many of those stations are at desert plateau sites, so I have changed the term to “higher elevation” stations. I have also asked Bill to provide additional thoughts on this issue, which will be the next blog post here.
BACKGROUND
The “official” world record highest near-surface air temperature is 134 deg. F, recorded in Death Valley, California on July, 10, 1913 at Greenland Ranch, California an isolated location with no similarly sited stations with which to compare (say, within 10 miles and below sea level). Greenland Ranch was a man-made oasis created by the Borax people around the turn of the 20th Century, with water piped in from a nearby mountain. It has a rich history, but always against a backdrop of oppressive summer heat that few visitors (and even workers) could endure.
As part of my new analyses of GHCN daily high and low temperatures, John Christy suggested I take a look at the Death Valley temperature data, and the record 134 deg. temperature in particular. Several people over the years have expressed concerns that the 134 deg. reading is implausibly high, but this has been difficult to prove. Both the World Meteorological Organization and NOAA’s National Weather Service continue to recognize 134 deg. F as the world record. It is quite likely that Death Valley remains the hottest location in North America; it’s the world record value that is in question here.
The most extensive meteorological and historical arguments against the record I’m aware of come from a series of blog posts by storm chaser, climatologist, and weather observer William T. Reid, re-posted at Weather Underground here, which I did not read until after I did the calculations which follow. I have since read some of what Bill has written, and I encourage anyone with an interest in history to read his extensive summaries (along with old photos) of Greenland Ranch, where the world record temperature was recorded. He has done considerable library research and he found a letter from the ranch foreman who expressed disappointment that the measurements from the instrumented shelter provided by the U.S. Weather Bureau in 1911 were so much lower than what he measured under his veranda. Bill suspects (and I agree) that the reported values for some period of time might well have not been from the instrumented shelter.
The method I will use to demonstrate the near-certainty of a high bias was also included in a limited fashion in Reid’s blog post (which contains a variety of meteorological arguments). I will apply the method to all years since 1911, and will show that the 134 deg. F record was approximately 10 deg. higher than what it should have been. The analyses I present are based upon the NOAA GHCN daily temperatures, with basic NOAA quality control procedures applied, thus they are from an “official” source. The GHCN dataset includes the 134 deg. F record high temperature from Death Valley.
HOW CAN ONE QUALITY-CHECK THE WORLD RECORD HIGHEST TEMPERATURE?
The main reason that the world record hottest temperature cannot be easily “fact-checked” is that there were no other weather stations in Death Valley at the time, and the low elevation (below sea level) of Greenland Ranch is routinely tens of degrees F hotter than at the mountain stations, which are tens of miles away and thousands of feet higher.
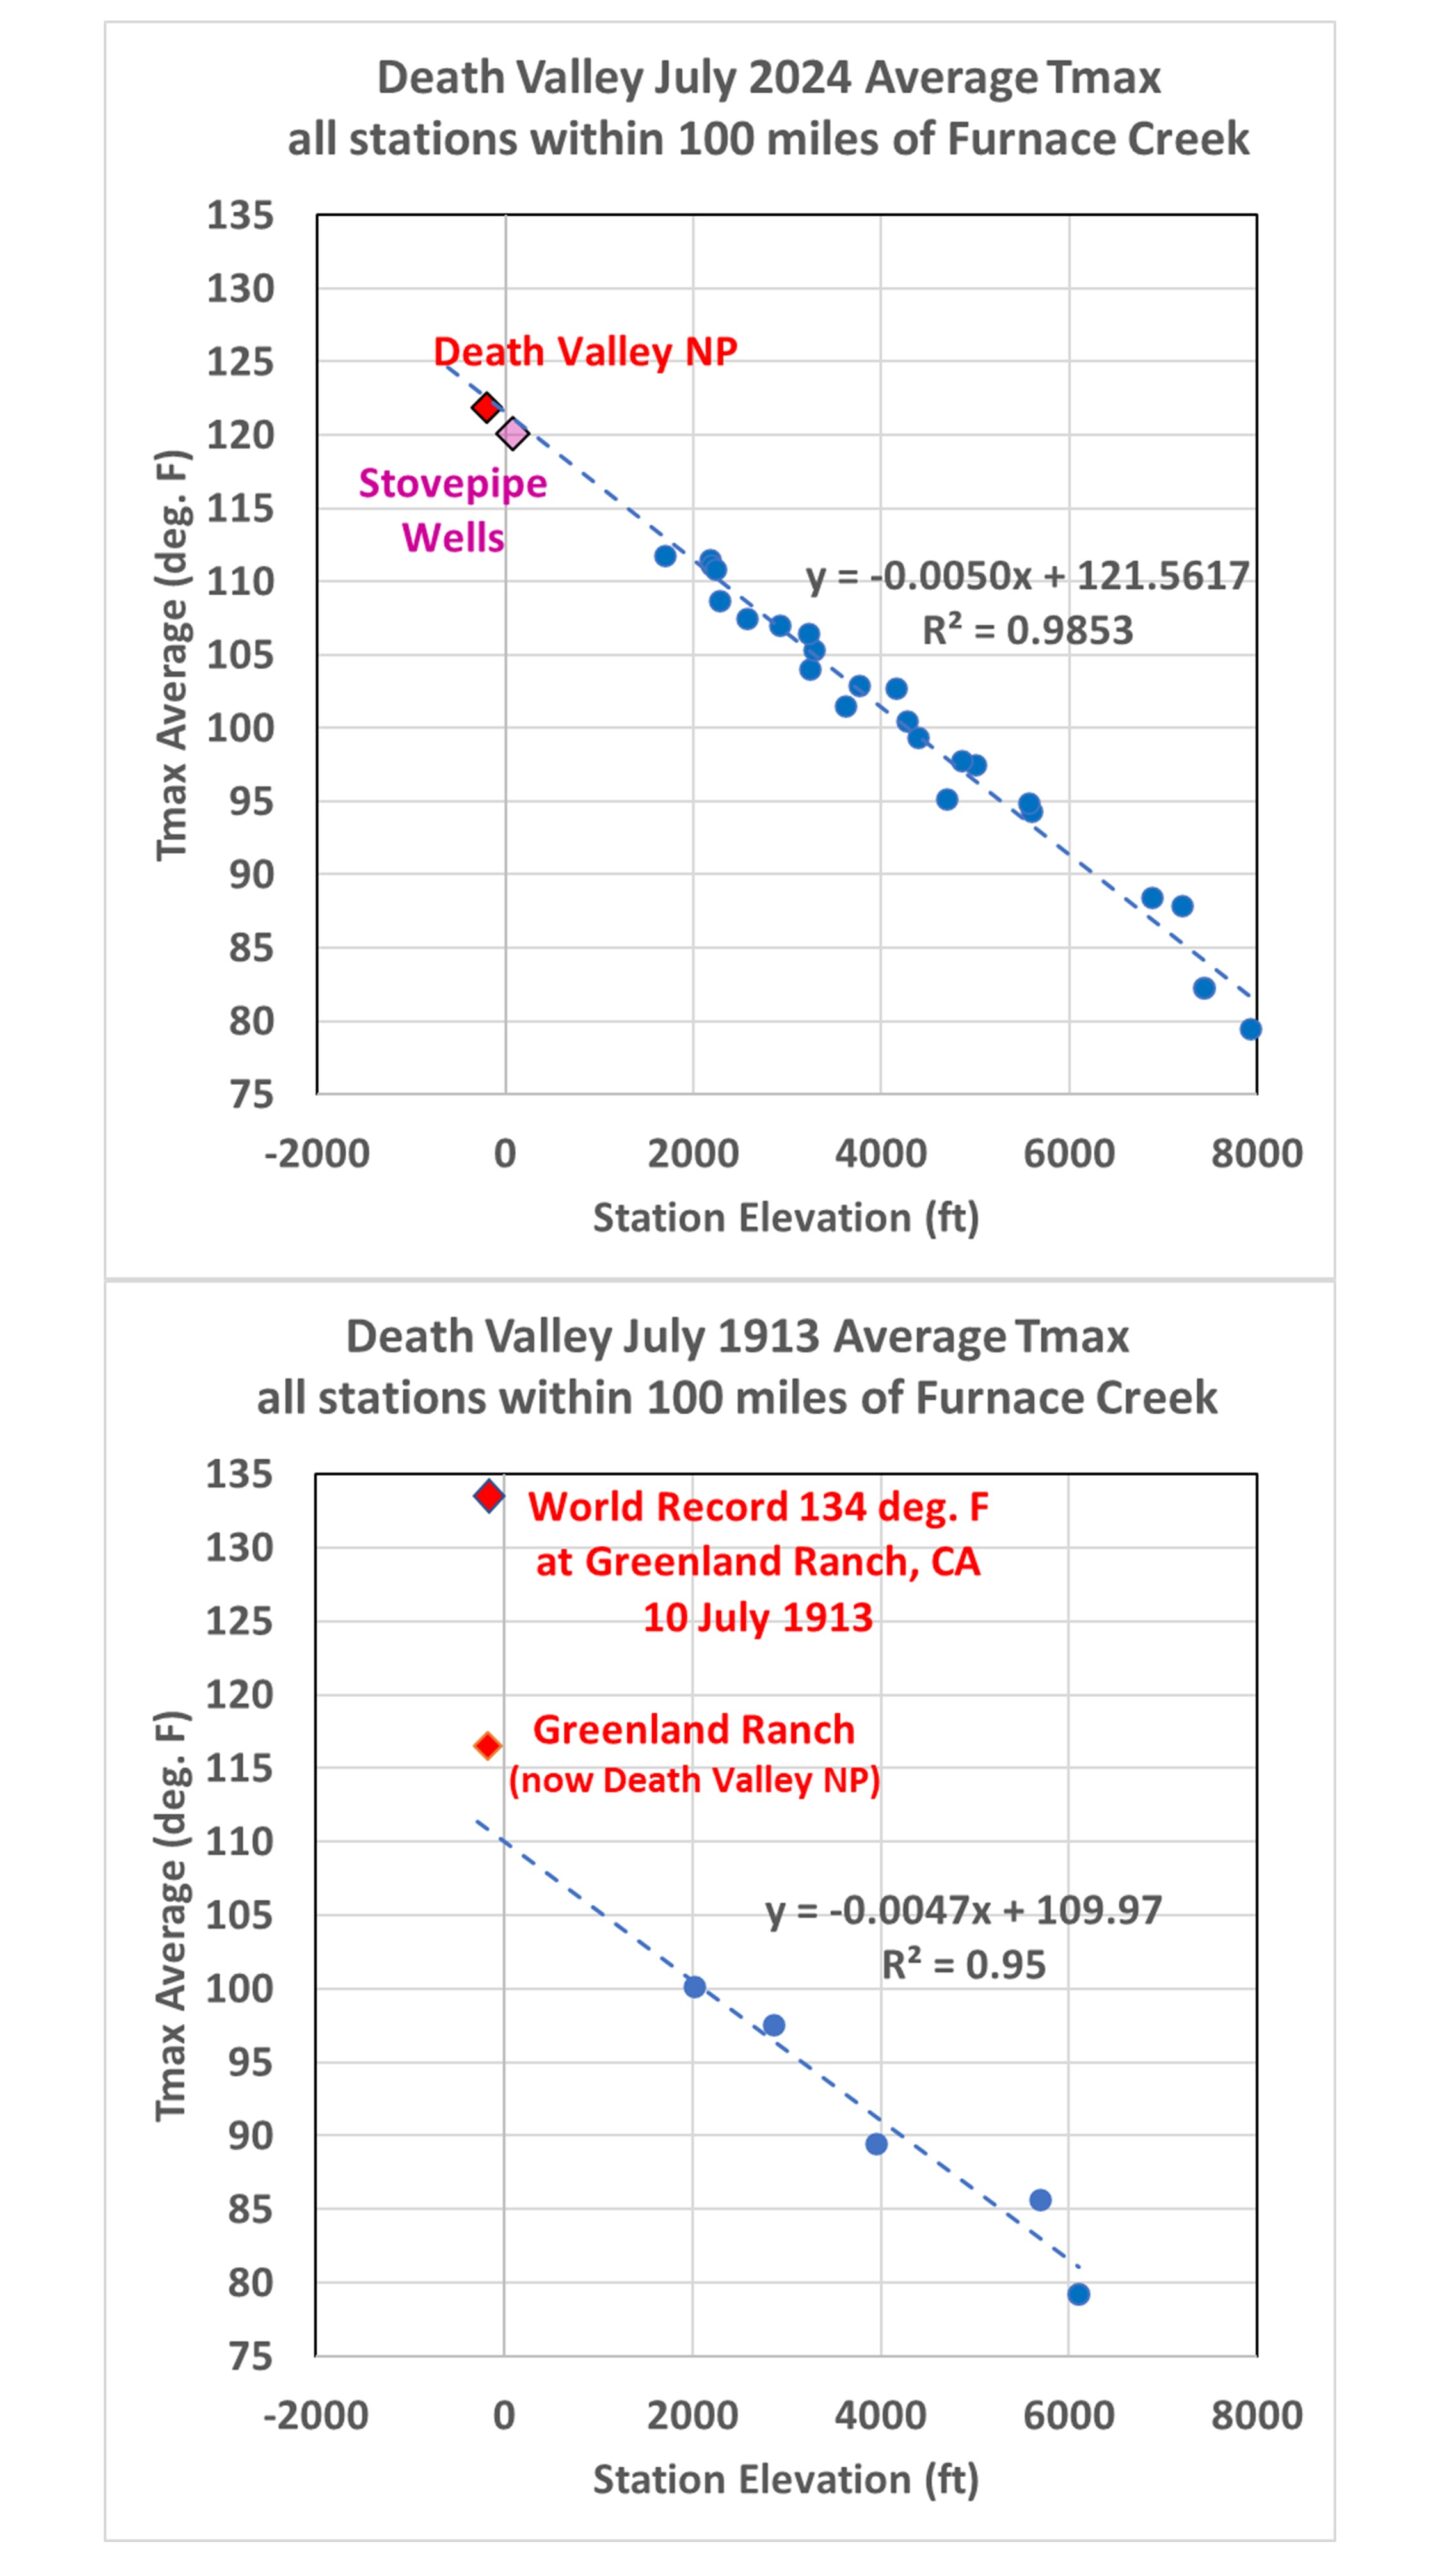
Yet, from a meteorological standpoint, Death Valley in the summer is the perfect place to quality check those hot temperatures from more distant, higher-elevations stations. Before I explain the reasons why, let’s first look at how Death Valley air temperatures compare to higher-elevation stations during July of this year (2024, which had near-record high temperatures), as well as during July of 1913. Following is a plot (Fig. 1) of July-average high temperatures (Tmax) for all stations within 100 miles of the Furnace Creek station (previously “Greenland Ranch”, and today called Death Valley National Park [NP] station). Importantly, I’m plotting these average temperatures versus station elevation:

Note the strong relationship between station elevation and temperature in the 2024 data (top), something William Reid also noted. Significantly, the two lowest-elevation stations (in Death Valley) in 2024 have temperatures which are very close to the regression line that relates how the July-average high temperatures vary with station altitude (the two Death Valley stations, located below sea level, are not included in the regression). But in 1913 (bottom plot), the Greenland Ranch value departs substantially from what would be expected from the surrounding stations.
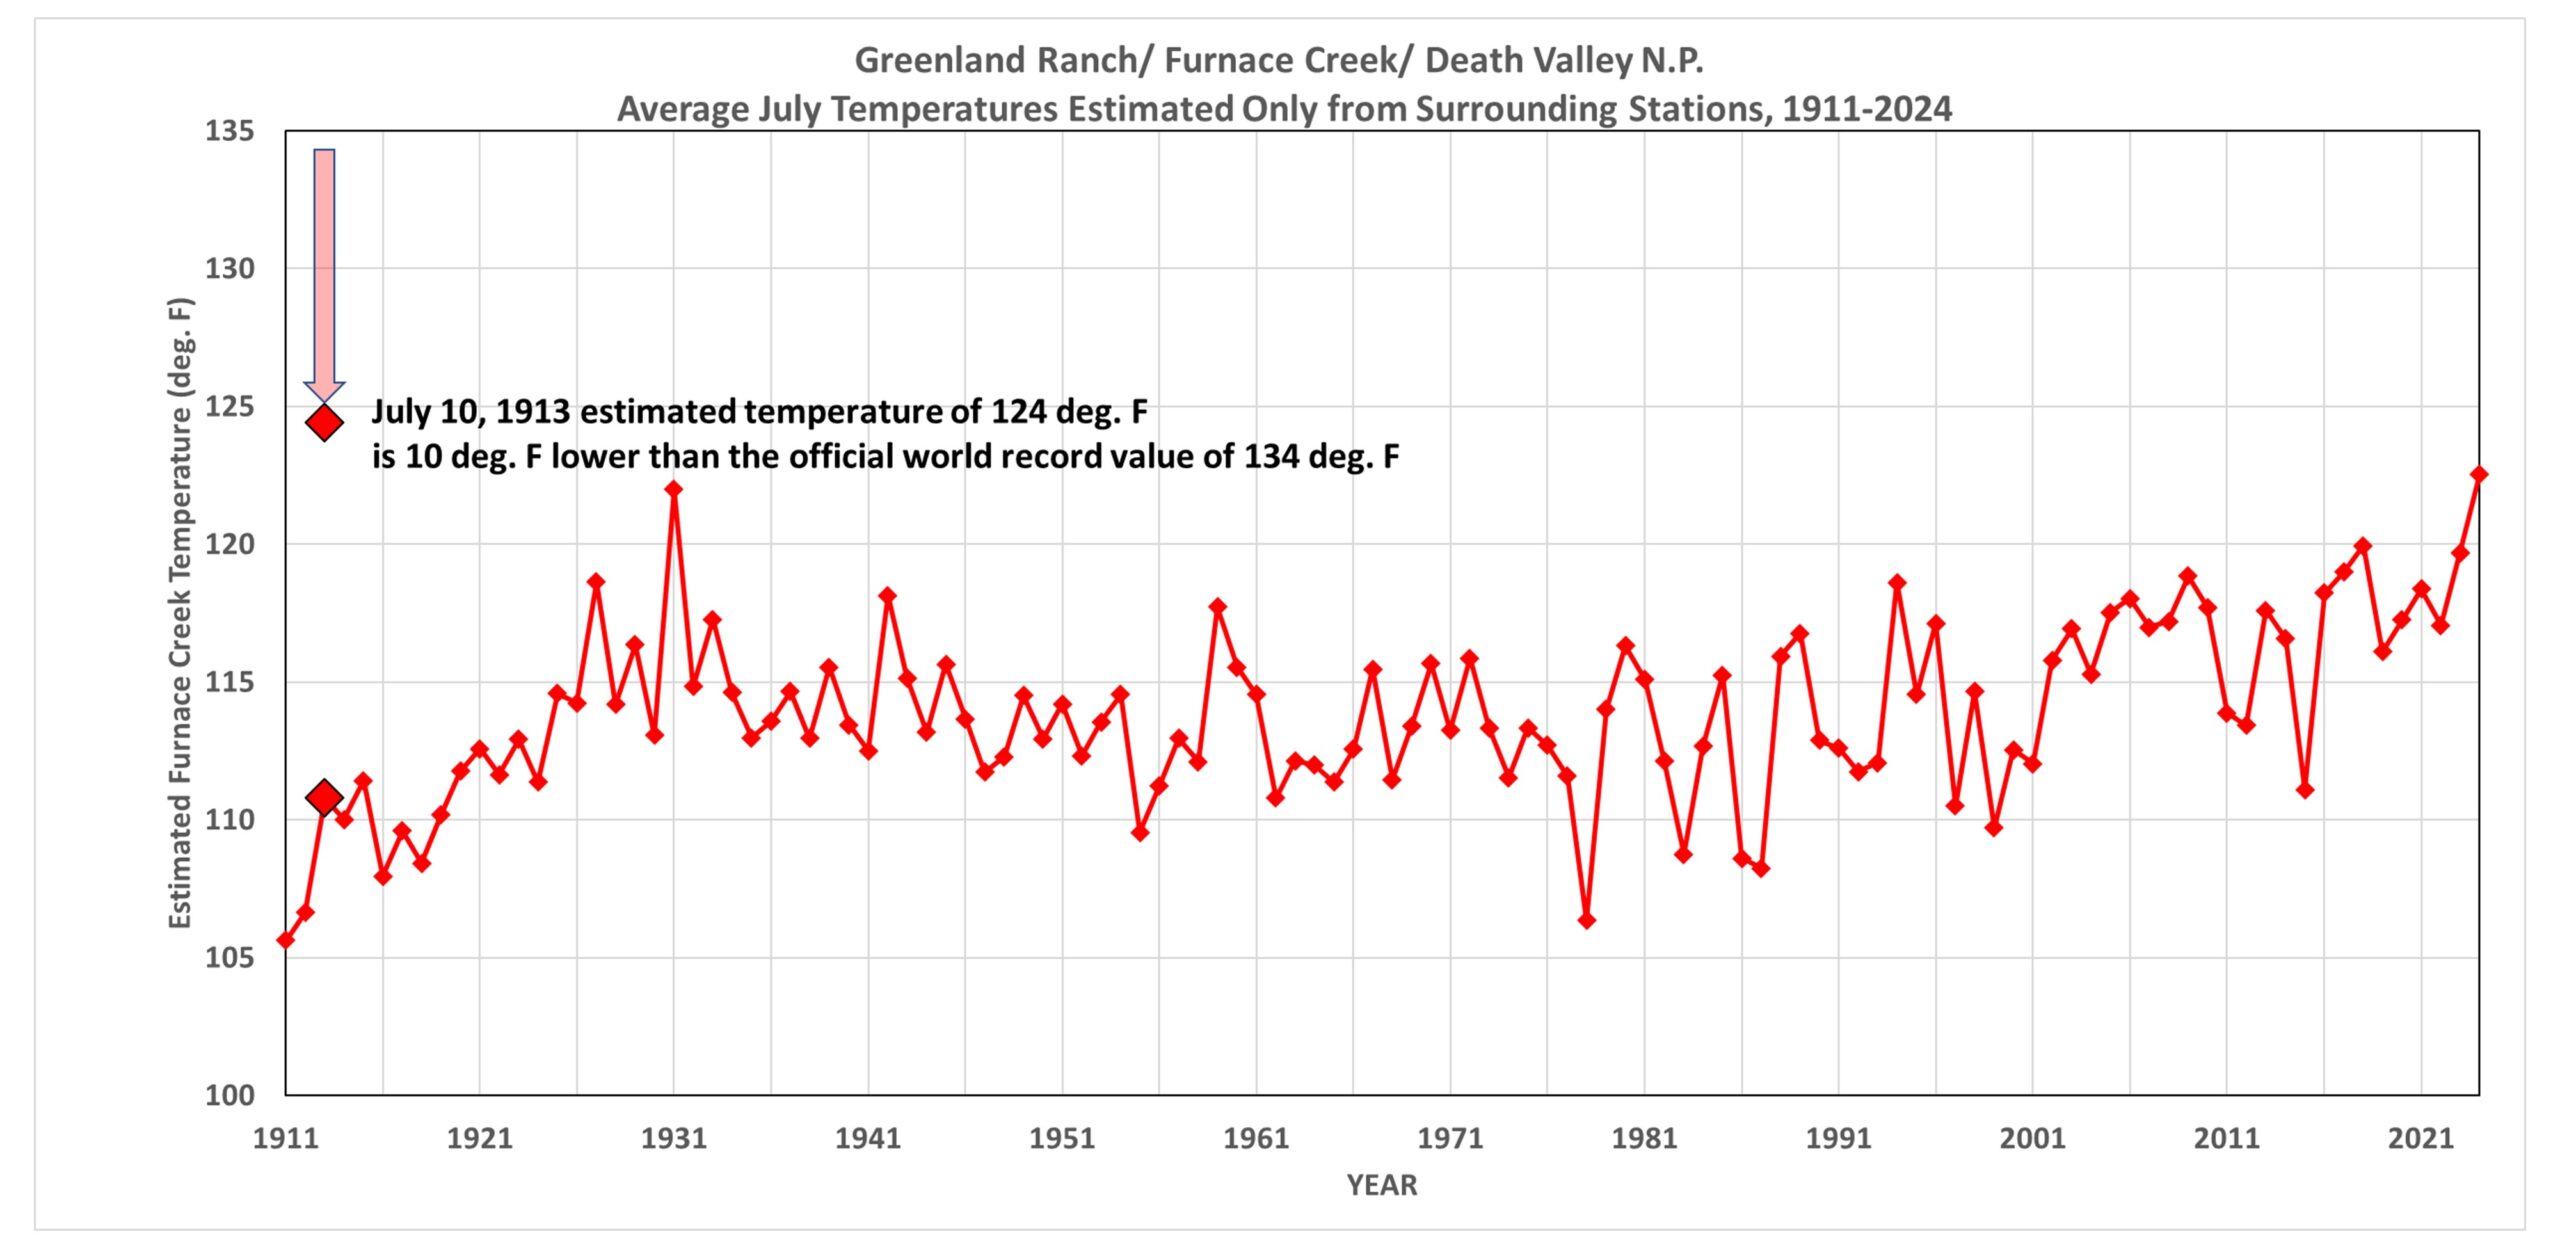
Regression lines like those in Fig. 1 can be computed in the other years, too, and used to statistically estimate what temperature the Furnace Creek station in Death Valley should have measured, based upon the surrounding, higher-altitude stations. This method allows us to estimate the Death Valley temperatures in each year, which is shown next in Fig. 2. (Bill Reid correctly points out that in the plots which follow, the results in the early years are from very few stations, and I agree that I should probably have used regression-derived lapse rates averaged from other years with more stations.)

METEOROLOGICAL JUSTIFICATION FOR THE METHODOLOGY
There are solid meteorological reasons why one can use fairly distant, higher-elevation stations to check Death Valley temperatures in July. (Remember, my formal training is as a meteorologist… I only work in climate because it pays better. I actually took some of the temperature measurements contained in the GHCN daily dataset during summers in the late 1970s when I interned at the National Weather Service Office in Sault Ste. Marie, Michigan).
In simple terms, daytime temperatures during the warm season in dry, semi-desert or desert climates vary with altitude in a predictable and repeatable manner, and with little change over substantial distances. Evidence of this is shown in Fig. 1. This is much less true during the cool season, at night, or during cloudy (or even rainy) weather. This makes Death Valley in July one of the best places on Earth for fact-checking of very warm daytime temperature values. This applies very well to the southwestern U.S. in the summer (at least before monsoon rains arrive), where a semi-permanent high pressure ridge in May-July gets set up every year, with slowly subsiding (sinking) air producing mostly clear skies. This kind of weather feature has a large and uniform regional extent (unlike low pressure troughs, which can be sharp with strong horizontal temperature changes). This is related to something called the “Rossby radius of deformation“.
In simple terms, the warm, high pressure air masses that settle in over the SW U.S. in July are spatially uniform, with strong daytime vertical mixing producing temperature lapse rates approaching the dry adiabatic value. This allows comparisons between temperature at stations up to (for example) 100 miles away. The big differences in temperatures between neighboring stations, then, are primarily due to altitude. Daytime temperatures in the summer in dry climates decrease rapidly with height (see Fig. 1), providing perfect meteorological conditions for doing the kind of comparison I’m describing here.
ESTIMATED JULY BIASES IN THE GREENLAND RANCH/FURNACE CREEK/DEATH VALLEY
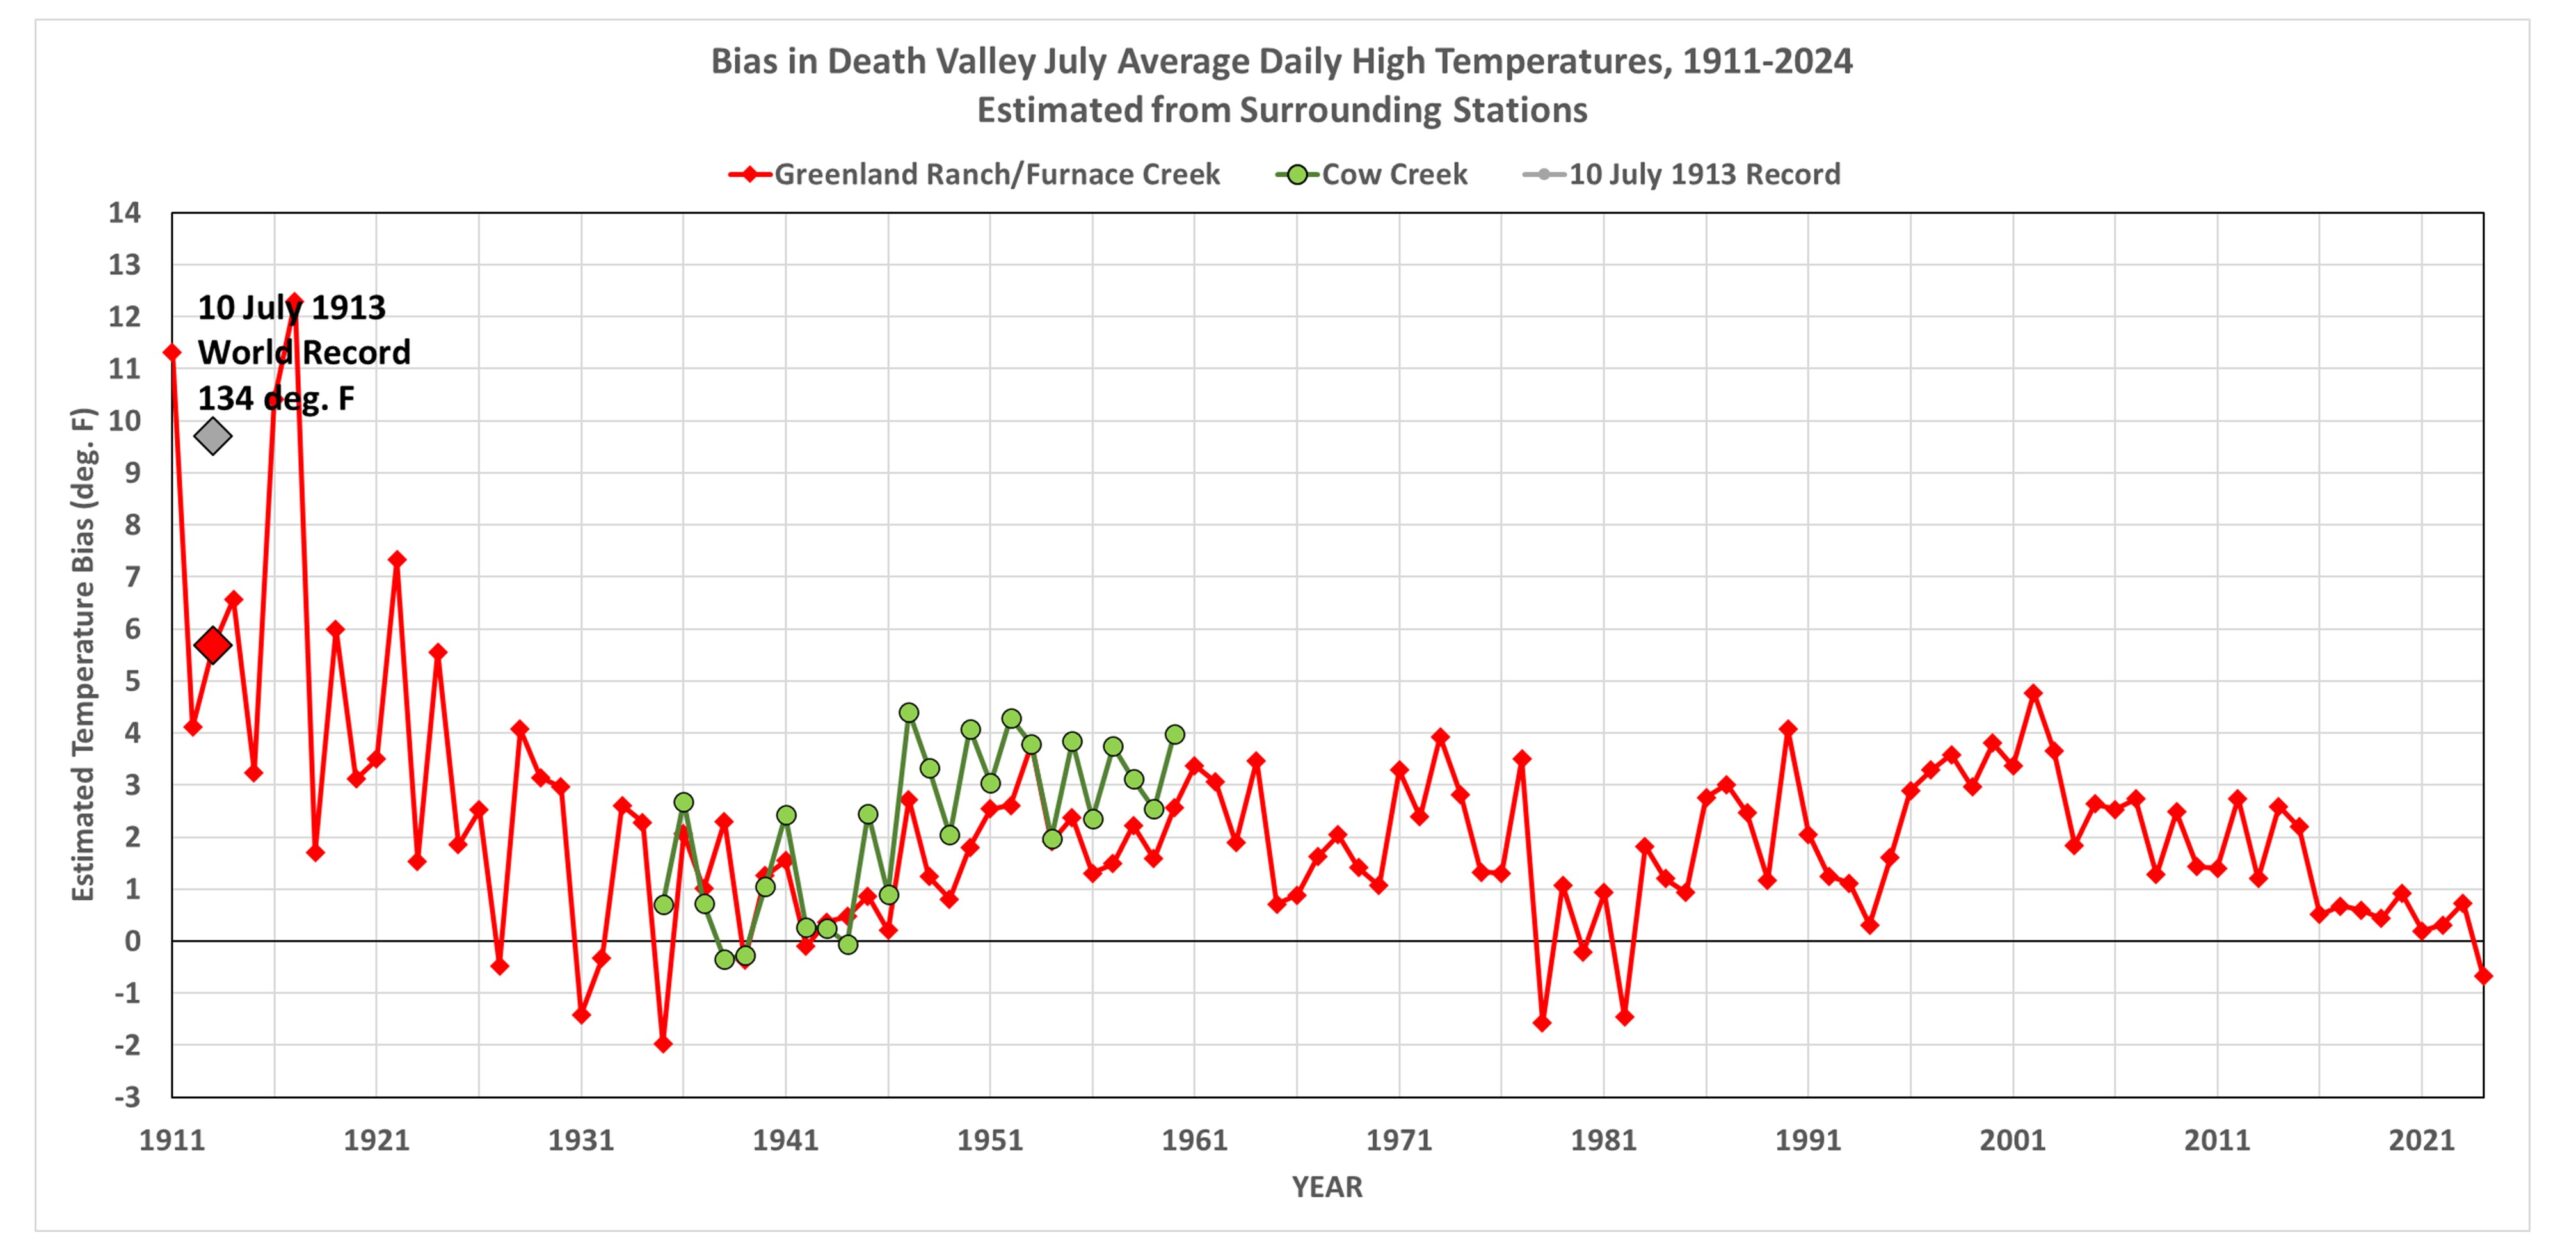
Finally, we can examine the difference between the reported July average temperatures in Death Valley from the GHCN data and the estimates from the surrounding stations (Fig. 3).

Note the substantial warm biases in the temperatures reported at Greenland Ranch in the first 10-15 years after the USWB installed the instrumented shelter. Again, as Bill Reid surmises, the ranch foreman was likely reporting values from a different thermometer that had poor exposure, next to a building. Also shown in green are data from a nearby station (5 miles away, at essentially the same elevation) called Cow Creek. Note that in the most recent decade, the Death Valley temperature estimates from surrounding stations agree with those measured at the current Death Valley N.P. observation site.
[I have not looked at how increasing urban heat island effects would change the details in Fig. 1-3. To the extent that urbanization has made the higher elevation stations warmer with time (I doubt urbanization is an issue at Furnace Creek), the method-estimated estimates will be correspondingly too warm, which will then cause a spurious upward trend in Fig. 2 and would reduce the computed biases seen in Fig. 3 over time, which is what we see.]
CONCLUSION
The bottom line is that I believe there to be sufficient quantitative evidence to say that the 134 deg. F world record hottest temperature, still recognized by the WMO and NWS, is as much as 10 deg. F too warm, likely due to observer error (which might well have been intentional). Again, for those interested in the history of Greenland Ranch (which includes the stories of those who died trying to escape the oppressive summer heat), read the fascinating history uncovered by Bill Reid, starting here.
__________________________
About
 Roy W. Spencer received his Ph.D. in meteorology at the University of Wisconsin-Madison in 1981. Before becoming a Principal Research Scientist at the University of Alabama in Huntsville in 2001, he was a Senior Scientist for Climate Studies at NASA’s Marshall Space Flight Center, where he and Dr. John Christy received NASA’s Exceptional Scientific Achievement Medal for their global temperature monitoring work with satellites. Dr. Spencer’s work with NASA continues as the U.S. Science Team leader for the Advanced Microwave Scanning Radiometer flying on NASA’s Aqua satellite. He has provided congressional testimony several times on the subject of global warming.
Dr. Spencer’s research has been entirely supported by U.S. government agencies: NASA, NOAA, and DOE. He has never been asked by any oil company to perform any kind of service. Not even Exxon-Mobil.
Dr. Spencer’s first popular book on global warming, Climate Confusion (Encounter Books), is now available at Amazon.com and BarnesAndNoble.com.
