
Robert W. Endlich
INTRODUCTION
Author’s Note: This is Part ONE of a multiple post topic. Figure numbers remain consecutive across the four parts of the post.
Part TWO is here.
Part THREE is here.
Part FOUR is here.
Presentation is here.

This story, “Climate Change Making Days Longer,” and the variations on it, were published Summer, 2024 by mainstream media outlets. I mention some of their Alarmist views, as well as some Contrarian views by Heartland, and some views from our skeptical friends in the blogosphere.
I explore this subject, using a wide series of facts, measurements, observations and data, easily looked up, and typically ignored by the Alarmist press.
I cite some of both sides of this story. I widen the discussion by including many more data sources, especially those which include historical and geologic data rather than the “nearsighted” views of the Alarmists. Their world view seems to start the day of their birth, when they graduated from school, or otherwise became aware, in the most recent times.
In short, they are ignorant but try to convince us with blather.
RECENT ARTICLES AND POSTS ON “CLIMATE CHANGE MAKING DAYS LONGER”
On 17 July 2024, this NPR post said,
“Days are getting slightly longer—and it’s due to climate change.”
Here’s a first NPR quote:
“Now, rapidly melting ice at the poles is shifting the planet’s mass, raising the level of the ocean at the equator. Since 1993, global sea levels have risen by 4 inches on average and will likely rise by 2 feet or more by the end of the century, depending on how much humans curb the climate pollution generated from burning fossil fuels.”
I looked up sea level rise measurements from the Atlantic and Pacific oceans. NPR’s claim,
“Since 1993, global sea levels have risen by 4 inches on average.”
This rate works out to be 1/3 foot in 31 years, about a foot a century. I checked these numbers against three measurements in the Atlantic and three more in the Pacific, using Dave Burton’s web site.
In the Atlantic, it is true that sea level rise at the NPR-stated rate is present at the Battery, New York City, and Mayport, FL, but at Portland, ME, the rate is only 0.64 ft/century.
In the Pacific, Sea Level rate of rise per century is 0.73 ft at San Diego, 0.50 ft at San Francisco, and 0.51 at Honolulu, HI.
Seems to me, based on these numbers, that NPR is exaggerating the rate of sea level rise.
The Proceedings of the National Academy of Science (PNAS) piece is titled, “The increasingly dominant role of climate change on length of day variations.” In their Significance paragraph, this quote,
“Modern climate change is unprecedented. In recent decades, it has accelerated the melting of glaciers and polar ice sheets, leading to a rise in sea level.”
Figure 1 below shows the error, arrogance, and ignorance in this PNAS piece.
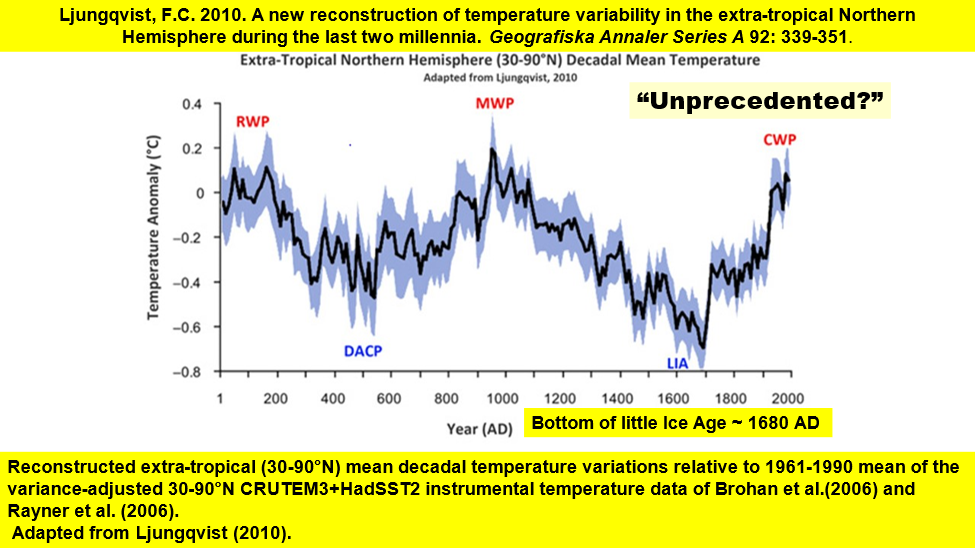
Figure 2 below was taken from Slide 24 of the Presentation Graphics. Don Easterbrook, Emeritus Geology Professor from Western Washington University, expands our time base from 2000 years to about 25,000 years, the time since the Last Glacial Maximum, when the Wisconsin Glaciers dominated most of Canada and a significant portion of the present United States. For the US, think Washington State, and the area north of a line from western Minnesota to Chicago to the middle of New Jersey, Slide 56 from the Presentation Graphics.
Dr Easterbrook analyzed the Temperature time series of those past 25,000 years using the O16/O18 ratio of the oxygen in the water which evaporated from the Gulf Stream, condensed into ice crystals, fell as snow and accumulated on Greenland, was compressed into ice, and was subsequently analyzed in what we now call the GISP2 ice core.
The Time Series of Temperatures is shown on the left of Figure 2, with white index numbers for different time periods in the time series. The index numbers are for periods of time where Easterbrook calculated the rate of change of temperatures per hundred years. On the right of Figure 2, is a bar chart diagram which plots, for each index period, the rate of change of temperature per hundred years, at each time period indicated by the white index number. Red, is for increase in temperature per hundred years, blue for decrease in temperature per hundred years.
At Index Number 7 the rate of temperature change was 14F in 100 years, while PNAS calls the increase in temperature since the Industrial Revolution, about 2 F in 175 years, “unprecedented.”
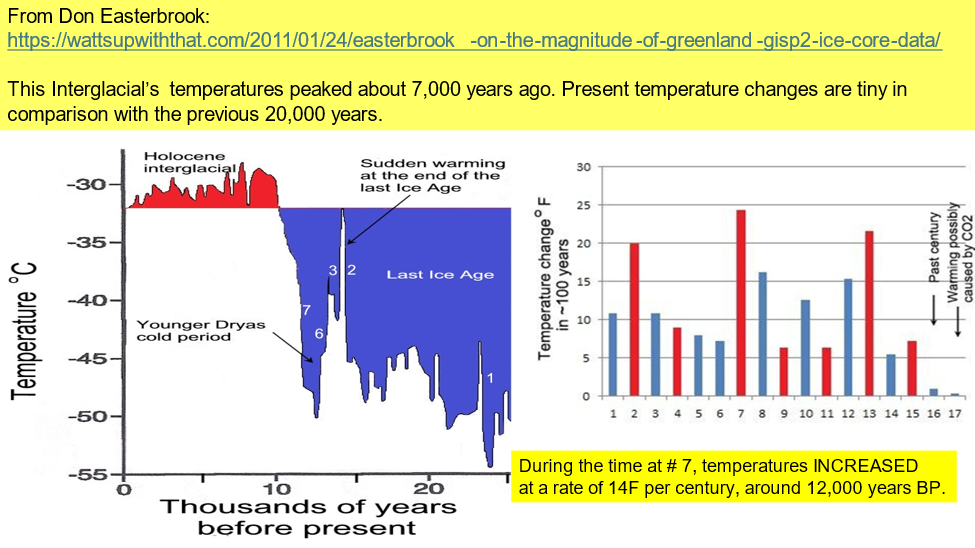
The conclusion that the reader should get from Figure 2 is that not only are the present changes in temperature extraordinarily small, but Alarmists also have no idea of how truly ignorant of climate history they are when they exclaim, “Modern climate change is unprecedented!”
Here’s a second NPR quote I found amusing:
“Now, experts say climate change will need to be factored into those decisions. But melting ice has far more serious consequences for the planet than time. Millions of people face losing their homes as polar ice melts and sea levels keep rising. ‘If you live in a low-lying coastal area, then you’re not concerned about leap seconds,’ <NIST Physicist> Levine says. ‘That’s the least of your worries. You have much more serious problems to deal with.'”
NPR writes as if humans control the Temperature of the Earth and the Level of the Sea, and all that needs to be done is to control human emissions of CO2 to stop the rising of the sea. Former President Obama, in accepting his party’s nomination for President said on 3 June 2008, in soaring rhetoric,
“This was the moment when the rise of the oceans began to slow, and our planet began to heal.”
This may be inspiring political rhetoric to the gullible, but it is pure BS, if you study earth and climate history.
TEMPERATURES, CO2 CONCENTRATIONS, AND SEA LEVEL CHANGES
Below, we consider sea level changes within the last ~8,000 years, then, since the last glacial, the Wisconsin Ice Age, especially the last 25,000 years, and finally, within the last 2.8 million years, the Pleistocene.
Present <CO2> is about 419 Parts Per Million, often 419 PPM. When I was making CO2 measurements at the then Sandia Optical Range for the Air Force Weapons Lab in 1973, <CO2> was about 329 PPM.
In historic times sea levels have been higher, much higher than today with <CO2> 280 Parts Per Million or less. In addition to the above post on WUWT, the class graphics from my course in 2019, “Weather, Climate, and Climate Change—What the Data tell Us” show a dozen examples of higher sea levels with <CO2> less than 280 PPM.
There is evidence that in the last Glacial Maximum so much ice was tied up in continental glaciers that Sea Levels were 400-410 ft lower, or ~120-125 meters lower than today. According to this Bering land bridge theory, the low sea levels enabled the populations of the land bridge to survive in Beringia and their descendants eventually became the First Americans, after sea levels started rising again.
The Pleistocene Epoch, the past ~2.8 million years, has been characterized by a series of major continental glacial advances, interspersed with inter-glacial periods. When I was a student at Rutgers 1959-1962, we learned that there were four major Pleistocene glaciations, nowadays the estimate is nine or ten.
During major continental glacial periods, ice sheets formed from persistent snowpack and moved southward across the continents of North America and Eurasia. (Southern Hemisphere’s data are still inconclusive). When the glaciers retreat, they leave their fingerprints, so to speak, some in the form of terminal moraines, jumbles of rock, soil, vegetation, and other debris. From Britannica:
“A terminal, or end, moraine consists of a ridge-like accumulation of glacial debris pushed forward by the leading glacial snout and dumped at the outermost edge of any given ice advance.”
Ice core data shows that the previous inter-glacial, the Eemian, was 125,000 years ago, but Milankovitch calculated inter-glacials were at 41,000 year intervals, dominated by the obliquity of Earth’s orbital cycles.
“But about 800,000 years ago, the cycle of Ice Ages lengthened to 100,000 years, matching Earth’s eccentricity cycle.”
Puzzlement over the changes from 41,000 years to 100,000 years were, and in some schools of thought, still exists. This puzzlement is an indication of the so-called 100,000 year problem.
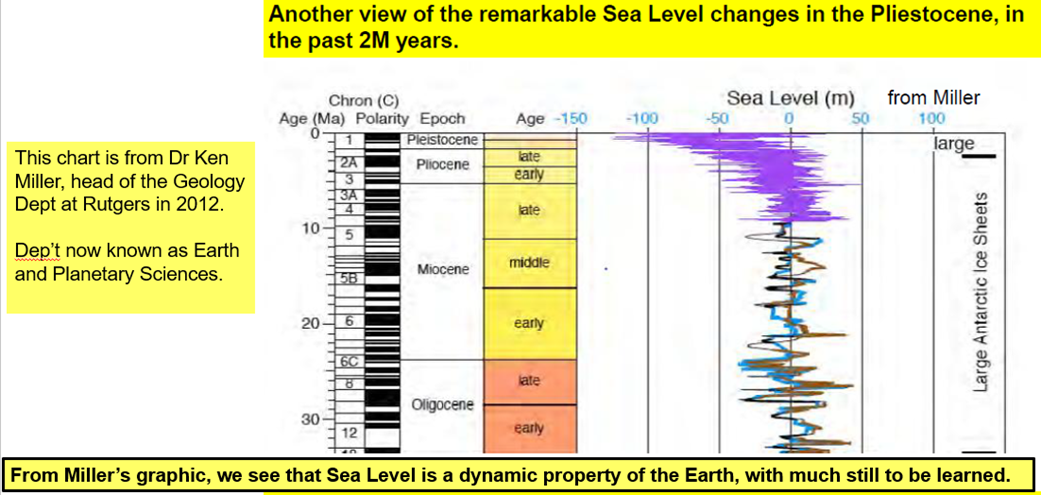
In 2012 I attended the 50th reunion of the Class of 1962 at Rutgers University; I was a Geology Major in those days. In 2012 I had electronic and in-person visits with Dr Ken Miller, Geology Department head, though it is now called Earth and Planetary Sciences Department. One of Dr Miller’s Internet posts contained the graphic below, which shows his sea level historical reconstruction over the past 35 million years.
Let’s consider Dr Miller’s Sea level reconstruction of just the past 2 M to 3 M Years, the Holocene, which shows numerous fluctuations in sea levels to 125 meters lower than today, and some excursions 20 meters higher than today, displayed below, in Figure 3.
IN ANTIQUITY, SEA LEVEL RISE HAS FLOODED SETTLEMENTS BEFORE
Complementing the presentation graphics, there are these two items on how sea level rise in Antiquity flooded Doggerland and Israel.
The natural inundation of Doggerland, a land area which existed between present day England and Denmark, when sea levels were substantially lower than today, is shown in the Presentation Graphics as Slide 9. A video at History Guild shows the flooding of Doggerland as sea level rose, when Earth emerged from the Last Glacial Maximum. Such sea level rise is part of Earth’s natural history, clearly not controlled by humans, as the NPR post seems to say.
Ticia Verveer, in the Times of Israel, on Atlit Yam, A Journey into Israel’s Sunken Past, writes,
“Along Haifa’s coast are the remnants of a Neolithic fishing village that drowned 9,000 years ago by the rising water level. Today, the exceptionally well preserved 40,000 m² site is located approximately 200-400 m offshore on the north bay of Atlit, at a depth of 8-11 m below modern sea level.”
OUR NOTIONS (AND CONVENTIONS) OF TIME, AND HOW WE MEASURE TIME
Our notions of Time come from using First Principles definitions of temporal space, for Day, Month, and Year.
The <12-hour> Day was defined by the rising and setting of the Sun at Equinox. This later was adjusted to be the 24 hours from sunrise to the next sunrise.
The length of time between successive Full Moons…. the Month.
The length of time between successive winter solstices…the Year.
Winter Solstice also marks the time of year of great symbolism and power, marking the return of longer days.
During the reign of the Egyptians, and their use of sundials, <equinox> daytime was 12 hours long, based on this discussion from Scientific American.
The Greek Hipparchus defined the Day as <exactly> 24 hours, which seems to conveniently fit into our notion of integer arithmetic. Hipparchus used ideas from the Babylonians, who in turn used the ideas of the base 12 and base 60 of the Sumerians for standards of measure.
This sets the table, so to speak, for subsequent definitions of 60 minutes in an hour and 60 seconds in a minute.
We should be cautious however, because other elements of time measurement, the month and year, are not invariant, but are functions of time, and do not fit conveniently into integer arithmetic, viz:
Having a month (I learned month evolved from “moonth”) for one revolution of the Moon around the Earth. The Month also did/does not line up into integer number space very well.
Trying to fit 12 integer months into one year just doesn’t fit at all, starting about the time when the days finally begin to get a little longer.
The Year, one revolution of the Earth around the sun, was thought by the Romans to be 355 days long, but that thought, which included fitting a year into <those> integer numbers, was incorrect.
From Wikipedia:
“The Julian calendar was proposed in 46 BC by (and takes its name from) Julius Caesar, as a reform of the earlier Roman Calendar, which was largely a lunisolar one. It took effect on 1 January 45 BC, by his edict. Caesar’s calendar became the predominant calendar in the Roman Empire and subsequently most of the Western world for more than 1,600 years, until 1582 when Pope Gregory XIII promulgated a revised calendar.”
More about years: The old Roman Calendar used the base 10 notion, 10 months in a year. From Google,
“Julius Caesar’s astronomers explained the need for 12 months in a year and the addition of a leap year to synchronize with the seasons.”
Romans also adapted the Egyptian 365 days/year calendar, started the year on 1 Jan instead of 1 March, and had twelve 30- and 31-day months except for February, which had 28 or 29 days, “shortchanged” because it was thought an unlucky month.
Finally…Length of a day defined as 24 equal hours, invariant with time, and nicely fitting integer arithmetic space is fundamentally incorrect. Neither the Month nor Year fits so nicely into integer space, so why should the day be so defined? NPR does not ask this question. It seems to me that NPR is more interested in joining the “climate crisis” bandwagon than critically examining this subject.
This concludes Part ONE. We have found that recent claims that presented temperatures as “unprecedented” are examples of caterwauling of the ignorant. We know this because the quasi-millennial peaks of the present warm period mimic the previous Roman and Medieval Warm Periods. Professor Easterbrook shows that present rates of temperature change are tiny compared to those which occurred in previous centuries. Sea Levels have been well above those at present in the historic past, with less <CO2>, facts noted when observing sea levels determined from historic seashore locations and geologic records.
The next post (Part TWO) in this four-part series shows us that what we learned about the “Solar Constant” of the sun’s power to heat Earth’s surface is not constant at all, among other things.