
Robert W. Endlich
INTRODUCTION

In Part One, I described when, over a fifteen or so year period of my work assignments, I needed current knowledge of the toxicity of chemicals used in military applications. From 1976-1979, the chemicals were Unsymmetrical Dimethyl Hydrazine, and Nitrogen Tetroxide, propellants for the Air Force Titan 2 Missile. Then, 1984-1994, the chemicals were Fluorine, Nitrogen Trifluoride, and Hydrogen Fluoride (HF) [actually its deuterated fluoride isotope cousin (DF)] for the Navy’s MIRACL laser at White Sands Missile Range (WSMR). In those days my colleagues and I respected and trusted the National Academy of Sciences Committee on Toxicology, and by inference the National Academy itself. For me, that period in my work history ended in 1994.
DOUBTING ALLEGED CO2 CLIMATE EFFECT
My beginning of doubt into significant “human-caused, CO2-Fueled Global Warming” arose after James Hansen’s 23 Jun 1988 testimony to the Senate, which was deliberately conducted on what was historically the hottest day of the year in Washington DC. This quote is from Hansen:
“…the global warming is now large enough that we can ascribe with a high degree of confidence a cause and effect relationship to the greenhouse effect.”
This was the testimony which brought “global warming” into common parlance.
The senator who arranged Hansen’s hearing that day used stagecraft to make the hearing room extraordinarily and uncomfortably hot. This is a direct quote:
“As then-Sen. Tim Wirth (D., Colo.), told ABC’s Frontline: ‘We went in the night before and opened all the windows, I will admit, right, so that the air conditioning wasn’t working inside the room … it was really hot.’ “
My interpretation of Hansen’s statement included these thoughts: IF Hansen was correct, AND IF CO2 had become a dominant greenhouse gas, THEN, since CO2 was well-mixed from the surface to 109 km altitude, as I had learned from Prof Hans Panofsky at Penn State, the entire atmosphere, surface to 109 km height would heat as a blister, and the effect should be easily visible in the data I was using on a daily basis to support High Energy Laser test operations at the High Energy Laser Systems Test Facility (HELSTF).
I spent three years as Weather Detachment Commander at Davis-Monthan AFB, Tucson, AZ, 1976-1979, and 4 years of duty at WSMR’s HELSTF, 1984-1988. I told my then-supervisor, Al Barr, in 1988, that if Hansen was right, then the alleged CO2-based atmospheric warming would have enhanced the formation of the atmosphere’s subtropical ridge, the atmospheric structure responsible for the “Sun Belt” in the United States.
So, if Hansen’s claims were true, the monsoon season in New Mexico should have begun to set-in earlier, last longer, and result in rainier summer monsoon seasons. I examined the relevant data and none of these were apparent. Indeed, the effect seemed to be opposite when looking at the Monsoon page of the National Weather Service (NWS) Office in Tucson, in the Monsoon Stats section.
These experiences strengthened my skepticism of Human-Caused CO2-Fueled Global Warming theory.
It was not until much later, on 16 Aug 2019 that I stumbled upon the topic, “Climate at the National Academies,” when perusing the Internet, doing climate and climate change research. The ignorant and demonstrably wrong content shown by the NAS at this location of their web site dashed my previous high opinion of the National Academy of Sciences. I captured the URL and graphics that I found and used them here. Below are my adaptations from those screen captures.
First: “Climate change is happening today.” (bold in the original). This statement shows complete ignorance at the NAS of the most elementary knowledge of the elements of climate, and their history. As I will show below, there are NO EXAMPLES of climate time series elements that show the mean of that element “flat lining.”
The term “Stationarity” is a mathematical property, showing the mean of a particular (in this case climate) element is unchanging over a defined time period. Stationarity just does not exist in climate time series in the real world.
Their statement, “Climate change is happening today” is as vapid as saying, “playing in the water will get you wet.”
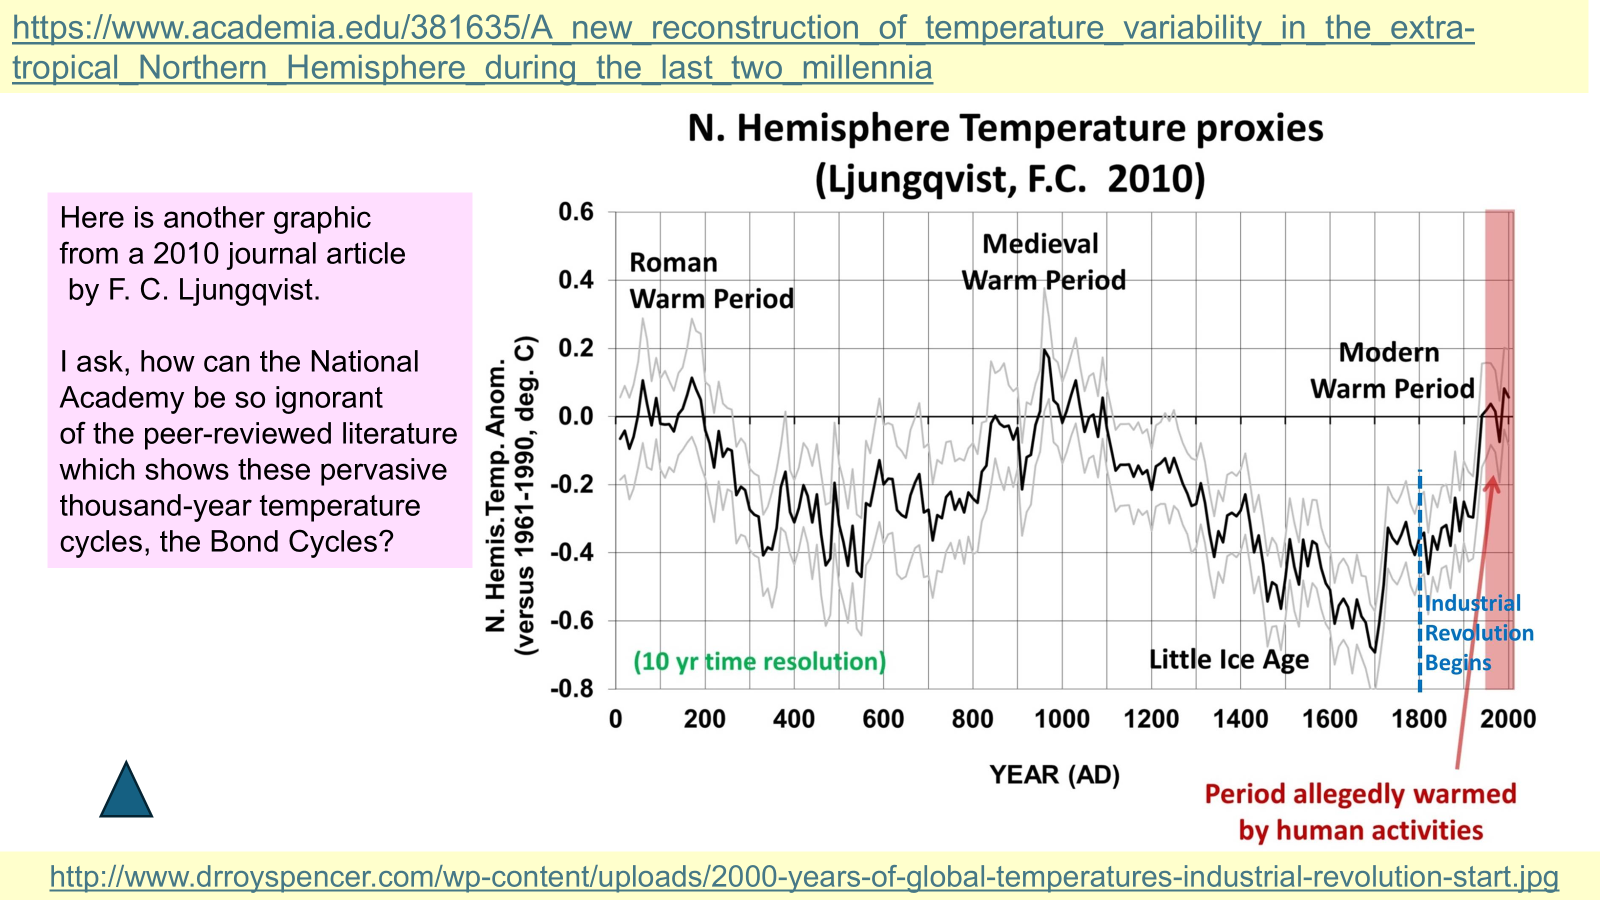
The following graphics show links to the literature, and specific examples of significant temperature time series from that literature, some over thousands of years, demonstrating this. There are the “pervasive millennial-scale climate cycles” published in SCIENCE in 1997, and examples thereafter that NAS had not found when it made the claim, that I found on 16 Aug 2019, “Climate change is happening today.”
A sarcastic comment today might be, “Well, no kidding, Jack!”
That first NAS quote, in it’s entirety is:
“Climate change is happening today. Scientists have known for some time, from multiple lines of evidence, that humans are changing Earth’s climate, primarily through greenhouse gas emissions.”
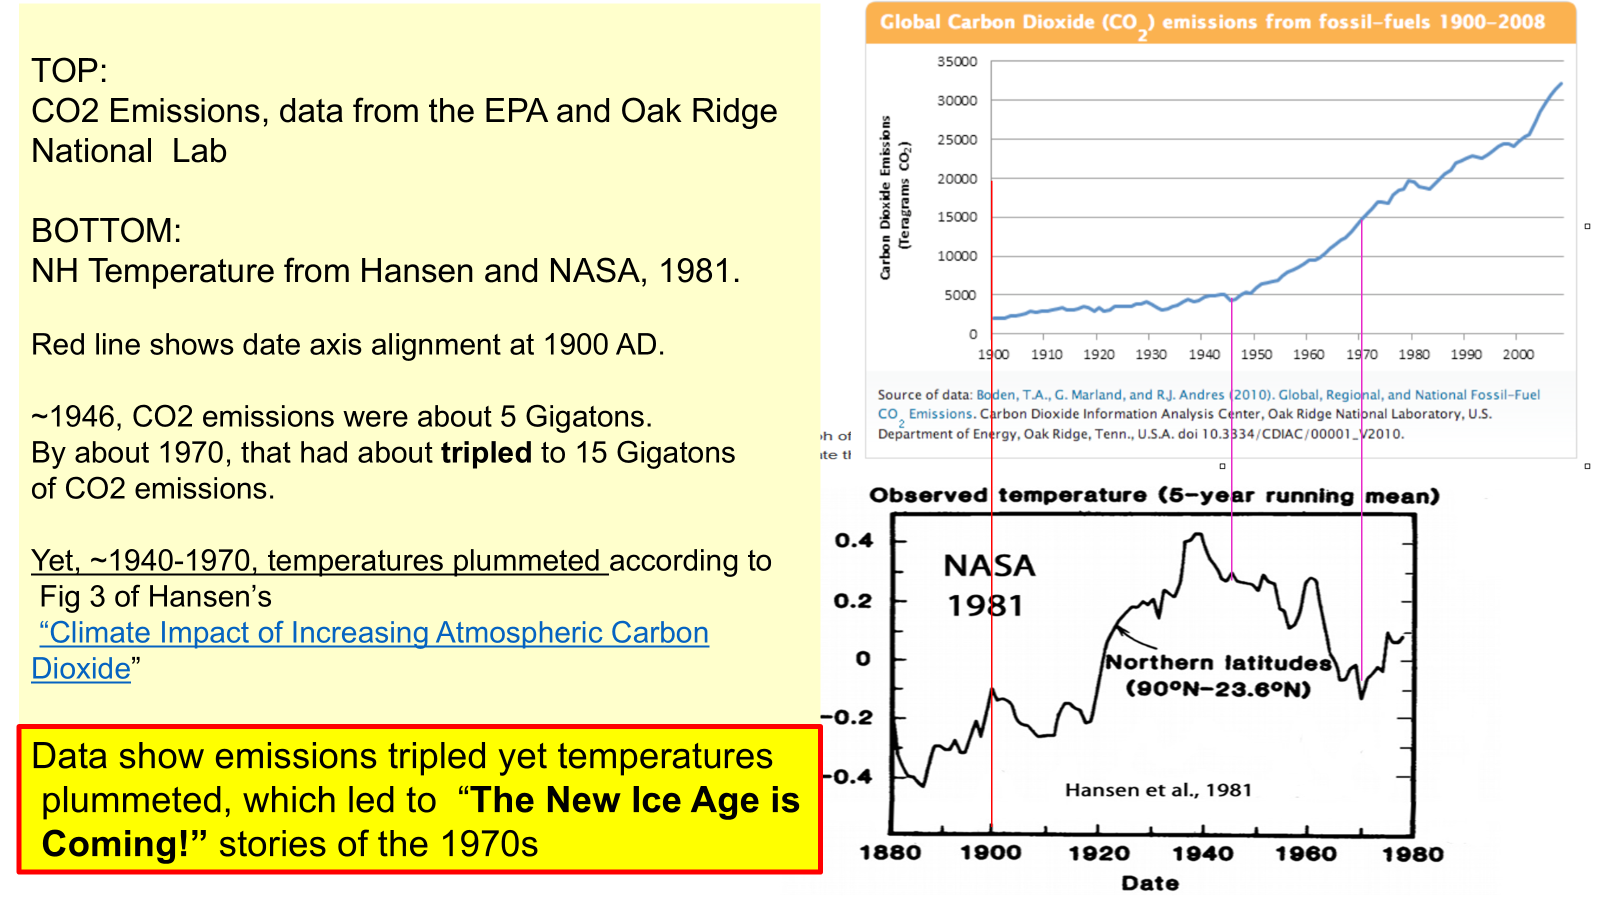
NAS showed no proof that “greenhouse gas emissions” caused this latest increase in global temperatures.
This post directly contradicts the notion that greenhouse gas emissions, specifically, emissions of CO2, caused the latest increase in global temperatures.
I refute that NAS claim with data, directly below:
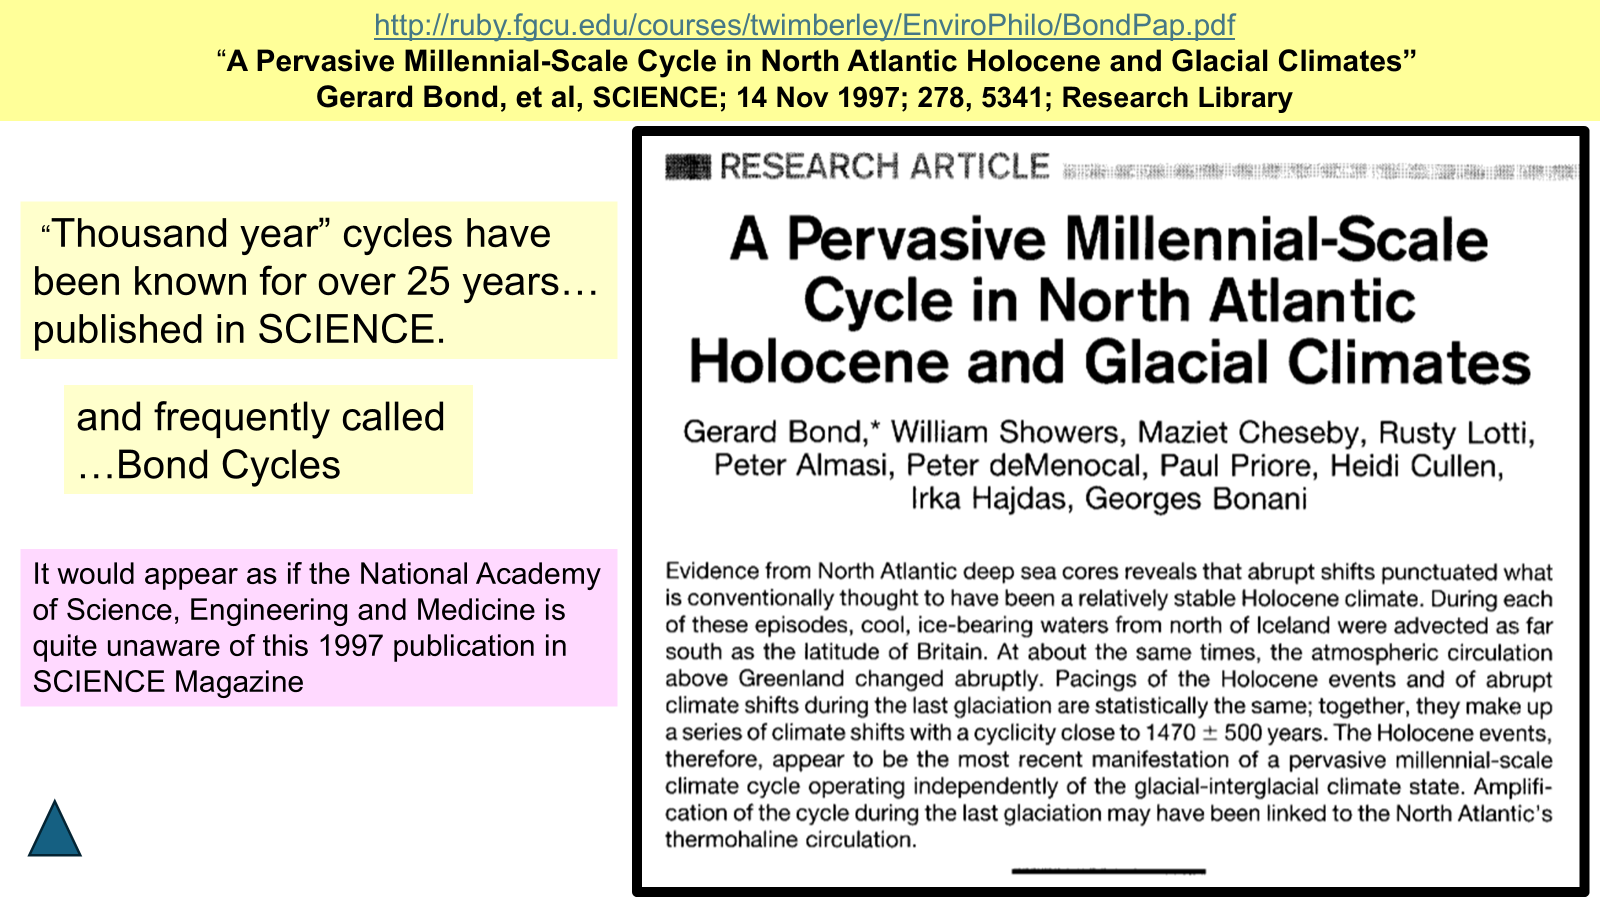
Well over twenty years passed between this publication in SCIENCE, of the existence of those pervasive millennial climate cycles, yet it seems as if the National Academy of Science was totally ignorant of the existence of such cyclic behavior of temperature and associated features of climate, such as glaciation, for example, as it exists in Greenland.
Figure 4, below, is a time series of temperatures from the GISP2 ice core from Greenland, first published by climate alarmist Richard Alley of Penn State.
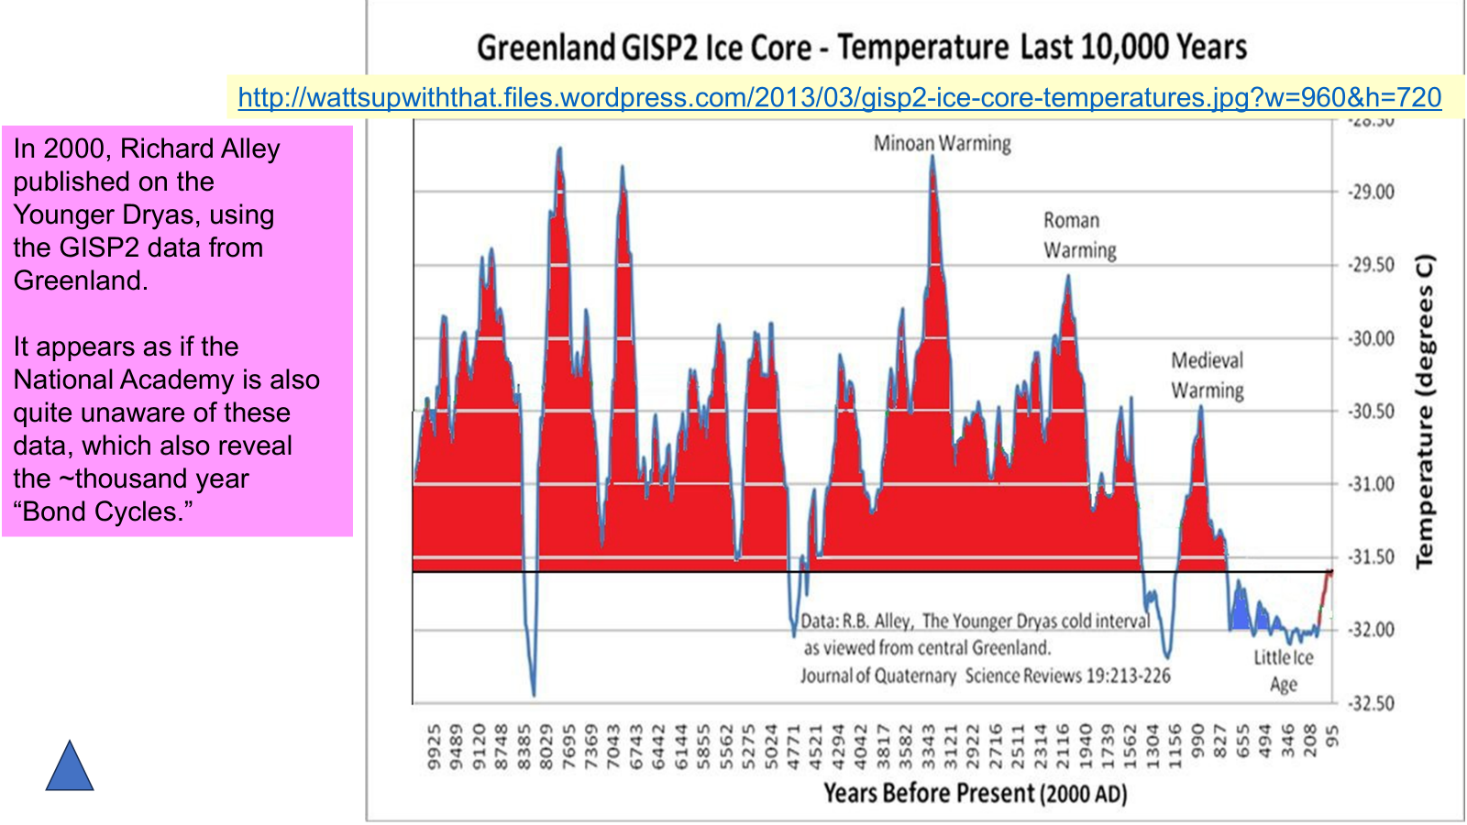
Looking at Figure 4, we can see that dramatic temperature changes are features of the natural climate well before widespread human use of coal, at the beginning of the Industrial Revolution around 1800. So, 1800 would be near but to the right of the “346” year mark in the abscissa, before Year 2000, the extreme right of the time series in Figure 4.
Multiple examples of the “pervasive millennial scale cycle in North Atlantic…Climates,” noted by Bond et al in their SCIENCE article of 1997, are particularly well-developed and shown in Figure 4. Temperature spikes mark the temperature maxima of the Minoan, Roman, and Medieval warm periods, and are so labeled.
Let’s examine that second quote from the NAS,
“The evidence is clear and compelling. Earth’s atmosphere and oceans are warming, the magnitude and frequency of extreme climate and weather events are increasing and sea level is rising along our coasts.”
With respect to, “Earth’s atmosphere and oceans are warming…” Inspection of the red temperature trace in Figure 4, the temperature time series from the GISP2 Ice Cores for the past 9925 years, shows that about half the time the temperature was warming and about half the time it was cooling. Therefore, the statement about atmosphere and oceans warming now is trivial. The NAS statement about “atmosphere and oceans warming” implying warming has a human cause is without foundation in the data presented.
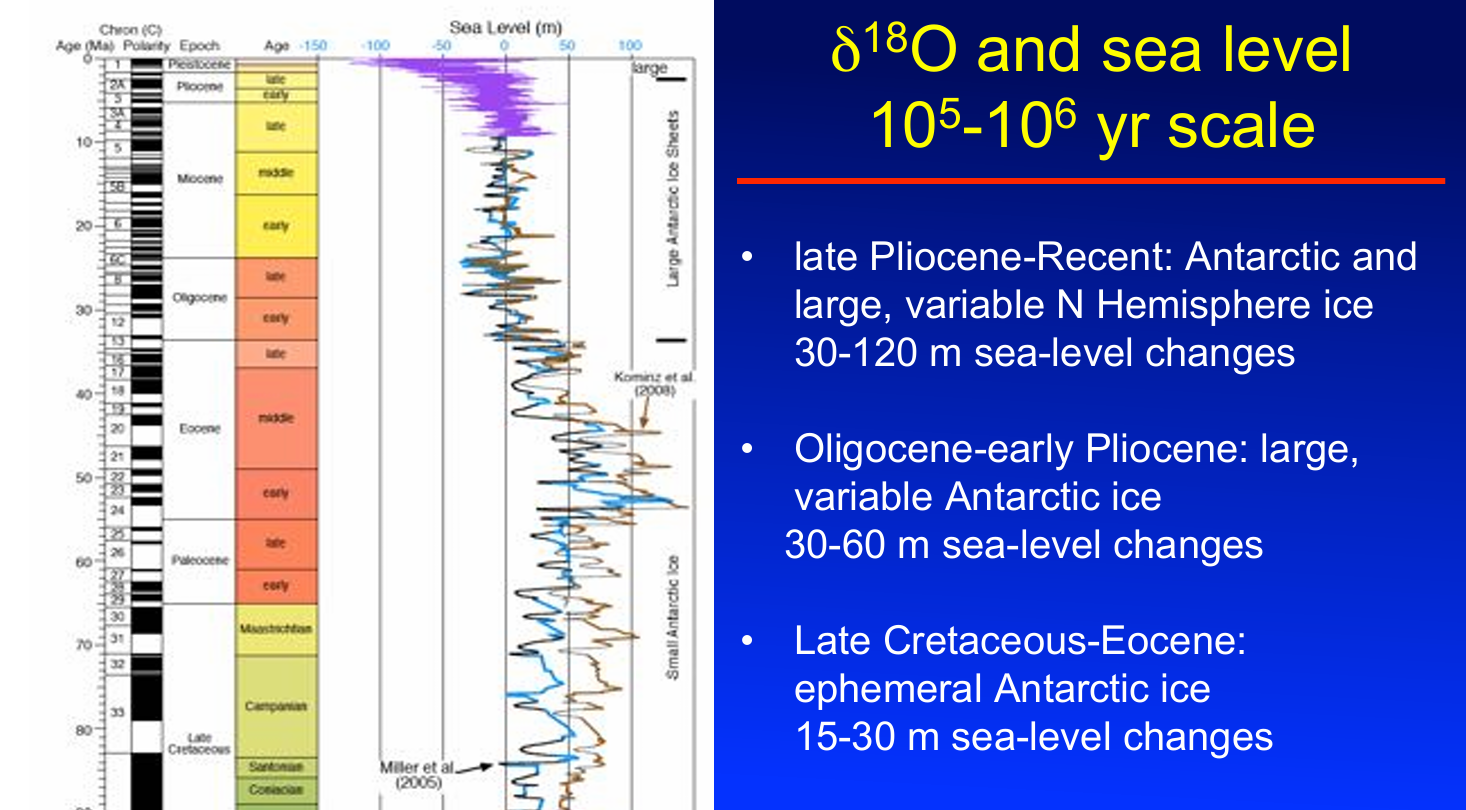
With respect to, “…sea level is rising along our coasts,” from the National Academies’ web site: Below is a plot (Figure 6) containing a time series of sea level from the late Cretaceous, about 80 million years ago, to the present. Note especially the sea level plot of the last 11 million years, in purple. The source is Dr. Ken Miller, from the Earth and Planetary Sciences Dept., at Rutgers. Quoting,
“Late Pliocene – Recent: Antarctic and large, variable N Hemisphere ice 30-120m Sea Level changes.”
Observe from Figure 6: sea level is a dynamic property of Earth. It seems impossible to count the numerous cycles of sea level oscillations in the past 11 million years from Miller’s diagram. Again, the claim “sea level is rising along our coasts,” is trivial. From these data, Sea Level is never in stasis.
https://eps.rutgers.edu/images/MillerSealevel2020.pdf
The profound ignorance of basic Geology, Meteorology and Climate displayed by our own National Academy of Sciences is dismaying.
I contend that the NAS’ membership and membership selection is the problem. Here is a key weakness: NAS does not recognize Earth Sciences as a Class of Sciences or discipline with which it should have expertise. Geology, Meteorology, and Climate are not represented. Because of this, NAS is profoundly ignorant in its Earth Science pronouncements. This helps explain their ignorant pronouncements on Climate.
NAS’ ignorance is not getting better in a hurry.
I’ll summarize this NAS weakness:
“They don’t know what they don’t know.”
MORE ON SEA LEVEL RISE
There is no immediate indication from the data in purple in Figure 6 that the recent increases in <CO2> have had any effect on sea level or the rate of sea level rise. But, to take a closer look, let’s examine the time series of Mean Sea Level measured at The Battery, at the foot of Manhattan in New York City, plotted in Figure 7 below. The data from The Battery are among the longest measured time series of Sea Level in North America, so this location might well be a good place to look for possible CO2 emission effects.
https://www.sealevel.info/MSL_graph.php?id=Battery
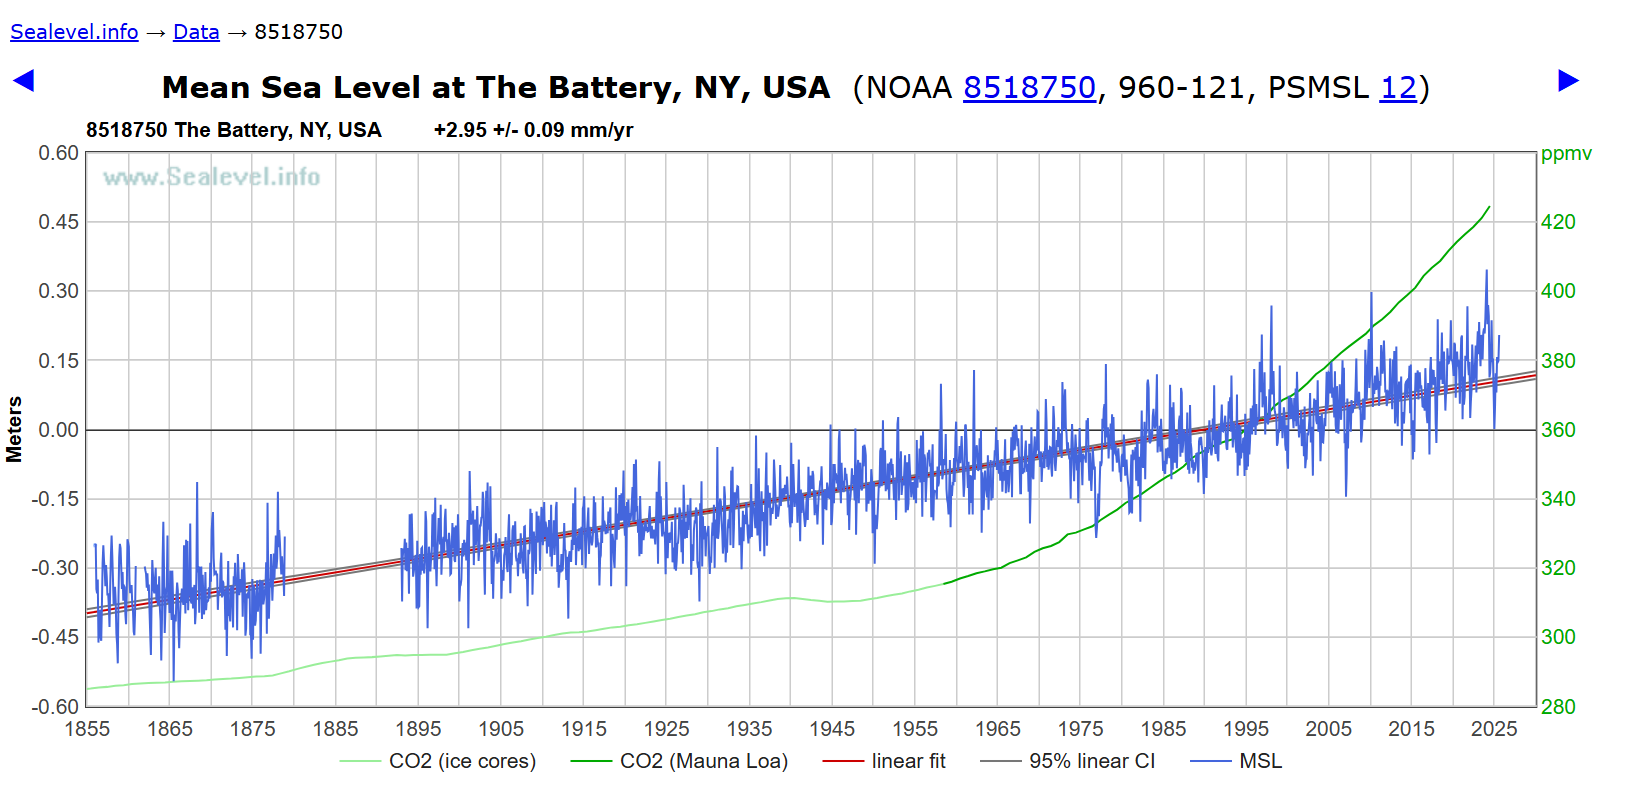
There are no indications from the Sea Level plot in blue in Figure 7, or the concentrations of CO2 from the Ice Cores (light green) or from the Mauna Loa concentrations (dark green) that the increases in <CO2> have had any effect on the rate of sea level rise since 1855, the last 170 years.
NAS CLAIM, “THE MAGNITUDE AND FREQUENCY OF EXTREME CLIMATE AND WEATHER EVENTS IS INCREASING”
Part of NAS’ second quote is,
“the magnitude and frequency of extreme climate and weather events are increasing.”
Below we examine this NAS claim and the many facets of it that show the NAS is just wrong in its assertions. For additional information, our Web Site has a New Visitors topic, on this subject.
We also examined the claim
“heavy rainfall is increasing in intensity and frequency.”
A more complete statement of that claim is,
“Heavy rainfall is increasing in intensity and frequency across the United States and globally and is expected to continue to increase. The largest observed changes in the United States have occurred in the Northeast.”
Our New Visitors Topic 6 examines several aspects of this claim. Among our refutations, the last extreme rainfall record in the US was set in 1979, 43.00 inches of rainfall for the extreme 24-hour rainfall amount. That was over 45 years ago!
The 1-minute rainfall extreme was set in 1956. The 5-minute rainfall extreme was set in 1960. No recent records have recently been set in the USA. This immediately puts in doubt the NAS claims…
“Heavy rainfall is increasing in intensity and frequency across the United States…” .
In the 1990s the National Weather Service modernized meteorological data collection of its sites in the USA. As part of that effort was the installation of the NWS double-shielded the rainfall collection instrumentation. This was a dramatic change from the wind-contaminated measurement methodology used previously, the unshielded 8-inch rain gage.
After modernization, rainfall amounts increased dramatically. This increase happened immediately because rainfall collection improved; the previous limitations of the unshielded 8-inch rain gage were essentially eliminated. The double-shielded set-up slowed the wind so that the rain and snow, which used to blow almost horizontally around the mouth of the 8-inch rain gage, fell vertically in the light winds within the shielded volume, to be collected, not lost to the swirling winds which frequently accompany rainstorms and snowstorms.
Rainfall data from the UK date from 1766 (!), and the data are remarkably complete. The data from the UK show no indication that “heavy rainfall is increasing in intensity and frequency.”
The NAS is clearly out of its depth making such ignorant claims. The data, described above, demonstrate that the NAS clearly does not know what it is talking about.
HURRICANES
Let’s expand on the NAS claim, “the magnitude and frequency of extreme climate and weather events is increasing.”
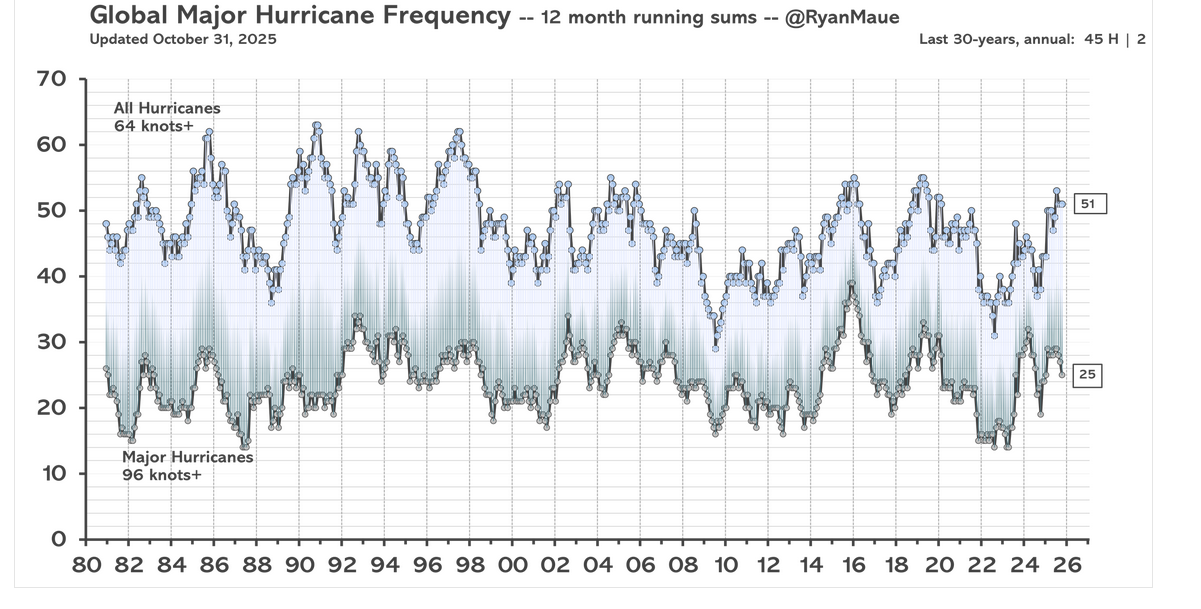
We’ll examine Hurricane and Tropical Storm data published by Ryan Maue, formerly from Florida State University. Maue has examined Hurricane data on a global basis, using the information obtained from weather satellites since 1980, when global coverage of weather satellite data routinely became available. Maue’s web site is https://climatlas.com/tropical/
Figure 8 is from Maue’s web site. Please examine the data carefully. There are interdecadal variations in the frequency of hurricane numbers for which we have no easy explanation. There was a high of hurricane frequency in the 1990s and significant decreases since then. Look at this data plot and the title of his AGU Letter, “Recent historically low global tropical cyclone activity.” The NAS claim, “the magnitude and frequency of extreme climate and weather events is increasing,” is plainly wrong when it comes to hurricanes.
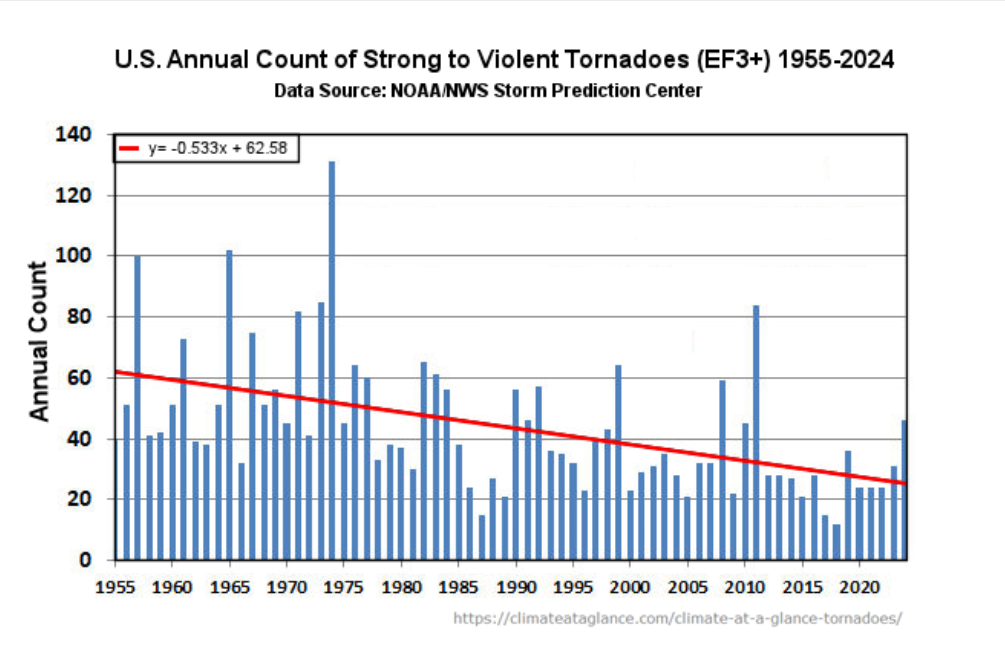
STRONG-TO-VIOLENT TORNADO NUMBERS DECREASING
Next, let’s look at strong to violent tornadoes in the USA. Why this choice?
As population in the US has increased, the areal “footprint” of population has increased, so the chance that residents can see or be affected by a tornado has increased.
Also, the radar sensing technology base has gotten better, especially with the development and fielding of the NEXRAD radar, also known as the WSR-88D, in the 1980s. This means our ability to sense a tornado’s rotating structure, to see the “tornado vortex signature,” on radar, has improved, and this means that we can now sense a larger number of smaller, less intense storms.
In short, better sensing, and with more people, the chance of us being able to see a tornadic storm increases.
But, we really care about the number of strong to violent tornadoes; they are the ones which tear through towns and cities, and even, sometimes schools, killing residents, teachers, and students.
The Heartland Institute is an Illinois-based Think Tank hosting many analysts and thought leaders. Heartland’s web site https://heartland.org/ contains many topics, and yes, several climate topics which help correct the false stories spread by climate alarmists. One such topical site run by Heartland is Climate at a Glance, https://climateataglance.com/
Since we’re talking about Tornadoes, there is a data display graphic at Heartland’s tornado topic, https://climateataglance.com/climate-at-a-glance-tornadoes/ that shows the dramatic recent decrease in the number of strong to violent tornadoes, here:
https://climateataglance.com/climate-at-a-glance-tornadoes/
SUMMARY
We have demonstrated here that this NAS Claim, “the magnitude and frequency of extreme climate and weather events is increasing,” is just wrong. The data on extreme rainfall events, hurricanes and strong-to-extreme tornadoes plainly show that the NAS claim is blatantly incorrect.
How could the NAS make such blazingly wrong comments and claims?
In my opinion, there are these three reasons.
ONE is that NAS members are becoming or, more likely, have become, creatures of the Washington DC Swamp.
TWO, the “go-along to get along” mentality characteristics of their DC neighbors and Government colleagues has seeped into their building and their collective being. The notion that they should actually look up and confirm facts, measurements, observations and data before issuing press releases or posting on the Internet is not “front of mind” in daily activities.
THREE, mentioned earlier, is that there appears to be no specialization in Earth Sciences among NAS’ disciplines:

CONCLUDING REMARKS
Checking observations before making forecasts was built into me from my days of forecasting for Air Force B-52 missions in the 1960s.
Sixty years ago, I was a lieutenant in the Air Force., a young Weather Officer. Some of my experiences were briefing my Air Force Colonels and aircrews taking off in fully fuel-and nuclear-weapons-loaded B-52s, at maximum gross weight, 450,000 pounds, flying 24-hour Airborne Alert, Operation CHROME DOME. Part of my routine involved looking up and checking my forecasts for these missions, since there was little error allowed , especially in computing the take-off performance of these bombers.
Fifty-nine years ago, I was briefing 30-ship, B-52 ARC LIGHT missions flying bombing missions from Guam to targets over South Vietnam, Laos and Cambodia. No Nuclear Weapons then, but the B-52s were often carrying 108 of the 500-lb High Explosive bombs. For takeoff, my temperature and pressure altitude forecasts were again important, because Andersen’s Runway 06 takeoff was downhill for the first 3000 ft, then the last 8200 ft was uphill.
So, these experiences in the Air Force, checking all available data BEFORE presenting my data to the aircrews and supervisors of these crews was built into my work discipline from decades ago. So, I suggest here that the NAS might need to look up some of the readily-available information on the climate elements of which they write, and double check their work before pressing the SEND key on their machines.