and claims their power was juiced by “Human-Caused Climate Change”
Robert W. Endlich
Author’s note: This post is based upon the presentation graphics, on-line here, for the 19 October 2024 meeting.
PRELUDE: THE 2024 HURRICANE SEASON BEFORE HELENE
The 2024 Atlantic Hurricane season got off to a late start; Tropical Storm Alberto did not form until 19 June, the latest named storm since 2014. Then, 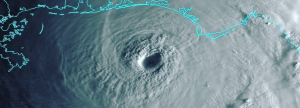 Hurricane Beryl was a long-lasting (around 14 days) system; she began in the Cape Verde Islands region, tracked past Jamaica, crossed Yucatan, entered Texas near Matagorda and weakened, with her remnants getting to the eastern Great Lakes region, before dissipating, 11 Jul 2024.
From Wikipedia,
“Activity then quieted down across the basin for most of July after Beryl dissipated, with no new tropical cyclones forming due to the presence of the Saharan air layer (SAL) across much of the Atlantic.”
Tropical activity seemingly resumed, then paused for
“an unusual lull in activity in late August and early September.”
Here’s how Wikipedia describes subsequent developments:
“On September 24, Hurricane Helene formed over the western Caribbean before moving toward the Big Bend region of Florida. It made landfall there on September 26, at Category 4 strength, before moving inland and dissipating over central Appalachia…. On October 5, Hurricane Milton formed in the Gulf of Mexico and explosively intensified into the second Category 5 hurricane of the season, becoming the most intense Atlantic hurricane since Wilma in 2005, by barometric pressure…”
This post examines the notions that human-caused, CO2-fueled global warming was responsible for the strong power of both Hurricanes Helene and Milton which accounted for extensive damage and a large loss of human life, with Helene responsible for 228 dead, and for Milton, 35 dead.
WEATHER ATTRIBUTION: NEAR-REAL-TIME BLAME INDUSTRY
Roger Pielke, Jr., writing on Substack, describes a new variation of global warming alarmism, what he calls, “Weather Attribution Alchemy.” This group of Alarmists engage in “event attribution,” in which, for weather events in progress, the “Weather Attribution Industry” issues press releases attributing a certain amount of the event in progress to human causes. The underlying reasons for “increasing the immediacy” of such releases originally was done “with the courts in mind.” Another activist is quoted as saying, the reason for these stories is to convey this message: “Dangerous Climate Change is here now!” <bold in the original>
A PEEK AT SOME HISTORIC DATA
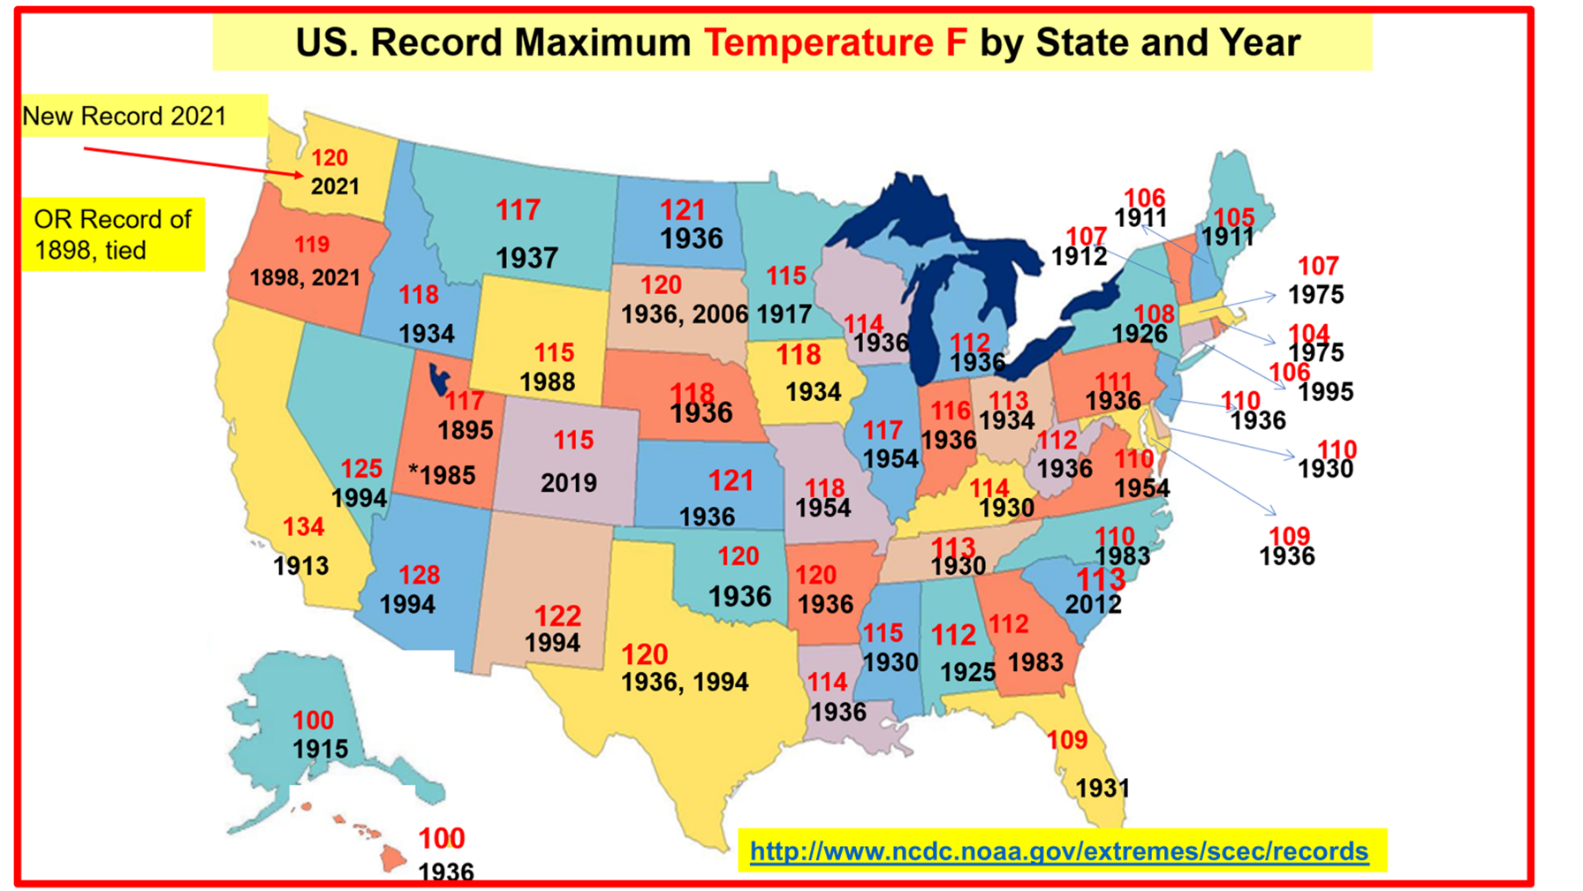
Actually, if you look at the data, there were a lot more record extreme maximum temperature records set in the USA during the Dust Bowl years of the 1930s. The International Panel on Climate Change, the IPCC, says that the strong increases of CO2 emissions which began in the 1950s, the post-WW2 economic boom, started the present warming of the climate.
And, if you look at Figure 2 below, most extreme maximum temperatures were set in the years before the mid-20th century beginning of the surge in CO2 emissions, directly contradicting the IPCC’s claims.
Figure 2 shows a map of the 50 States of the USA and the extreme maximum temperature, in red, and the year that extreme maximum temperature was set, in black. This graphic, based on NOAA’s own temperature extremes data base, directly confounds and contradicts the Climate Attribution Industry’s notion that increasing <CO2>is leading to increasingly warmer temperatures.
Note well, the peak in the number of the 50 states when the extreme maximum temperature was in the 1930s, when <CO2> was ~307 PPM. Today <CO2> is about 419 PPM. Notice that fewer states reached their extreme maximum temperatures in the 2000s.
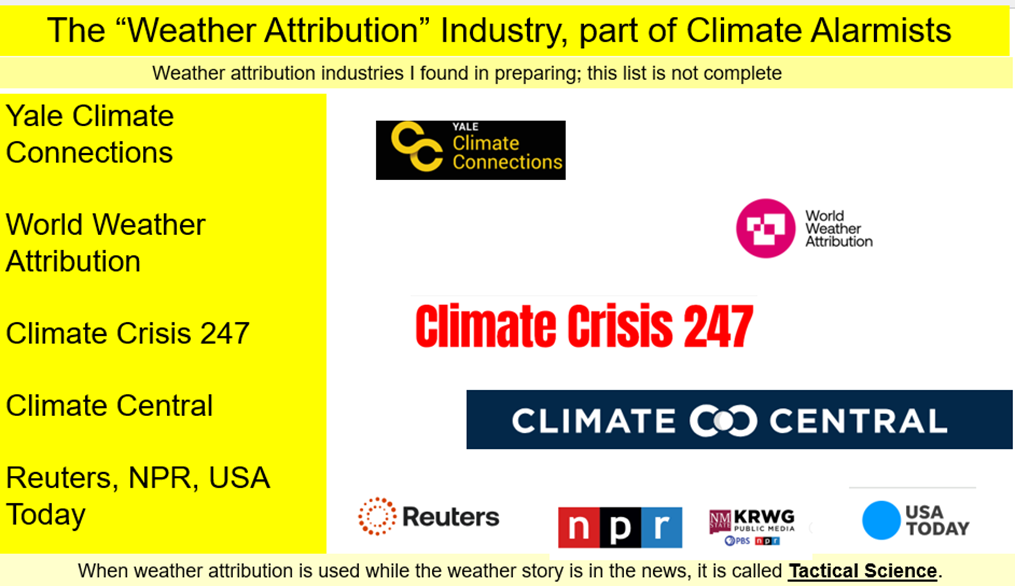
One splendid example of the Weather Attribution Industry’s output is this claim, from Yale Climate Connections, that the unusually warm water temperatures in the Gulf of Mexico in September 2024 was caused by humans.
TWO REASONS TO DOUBT HUMAN-CAUSATION
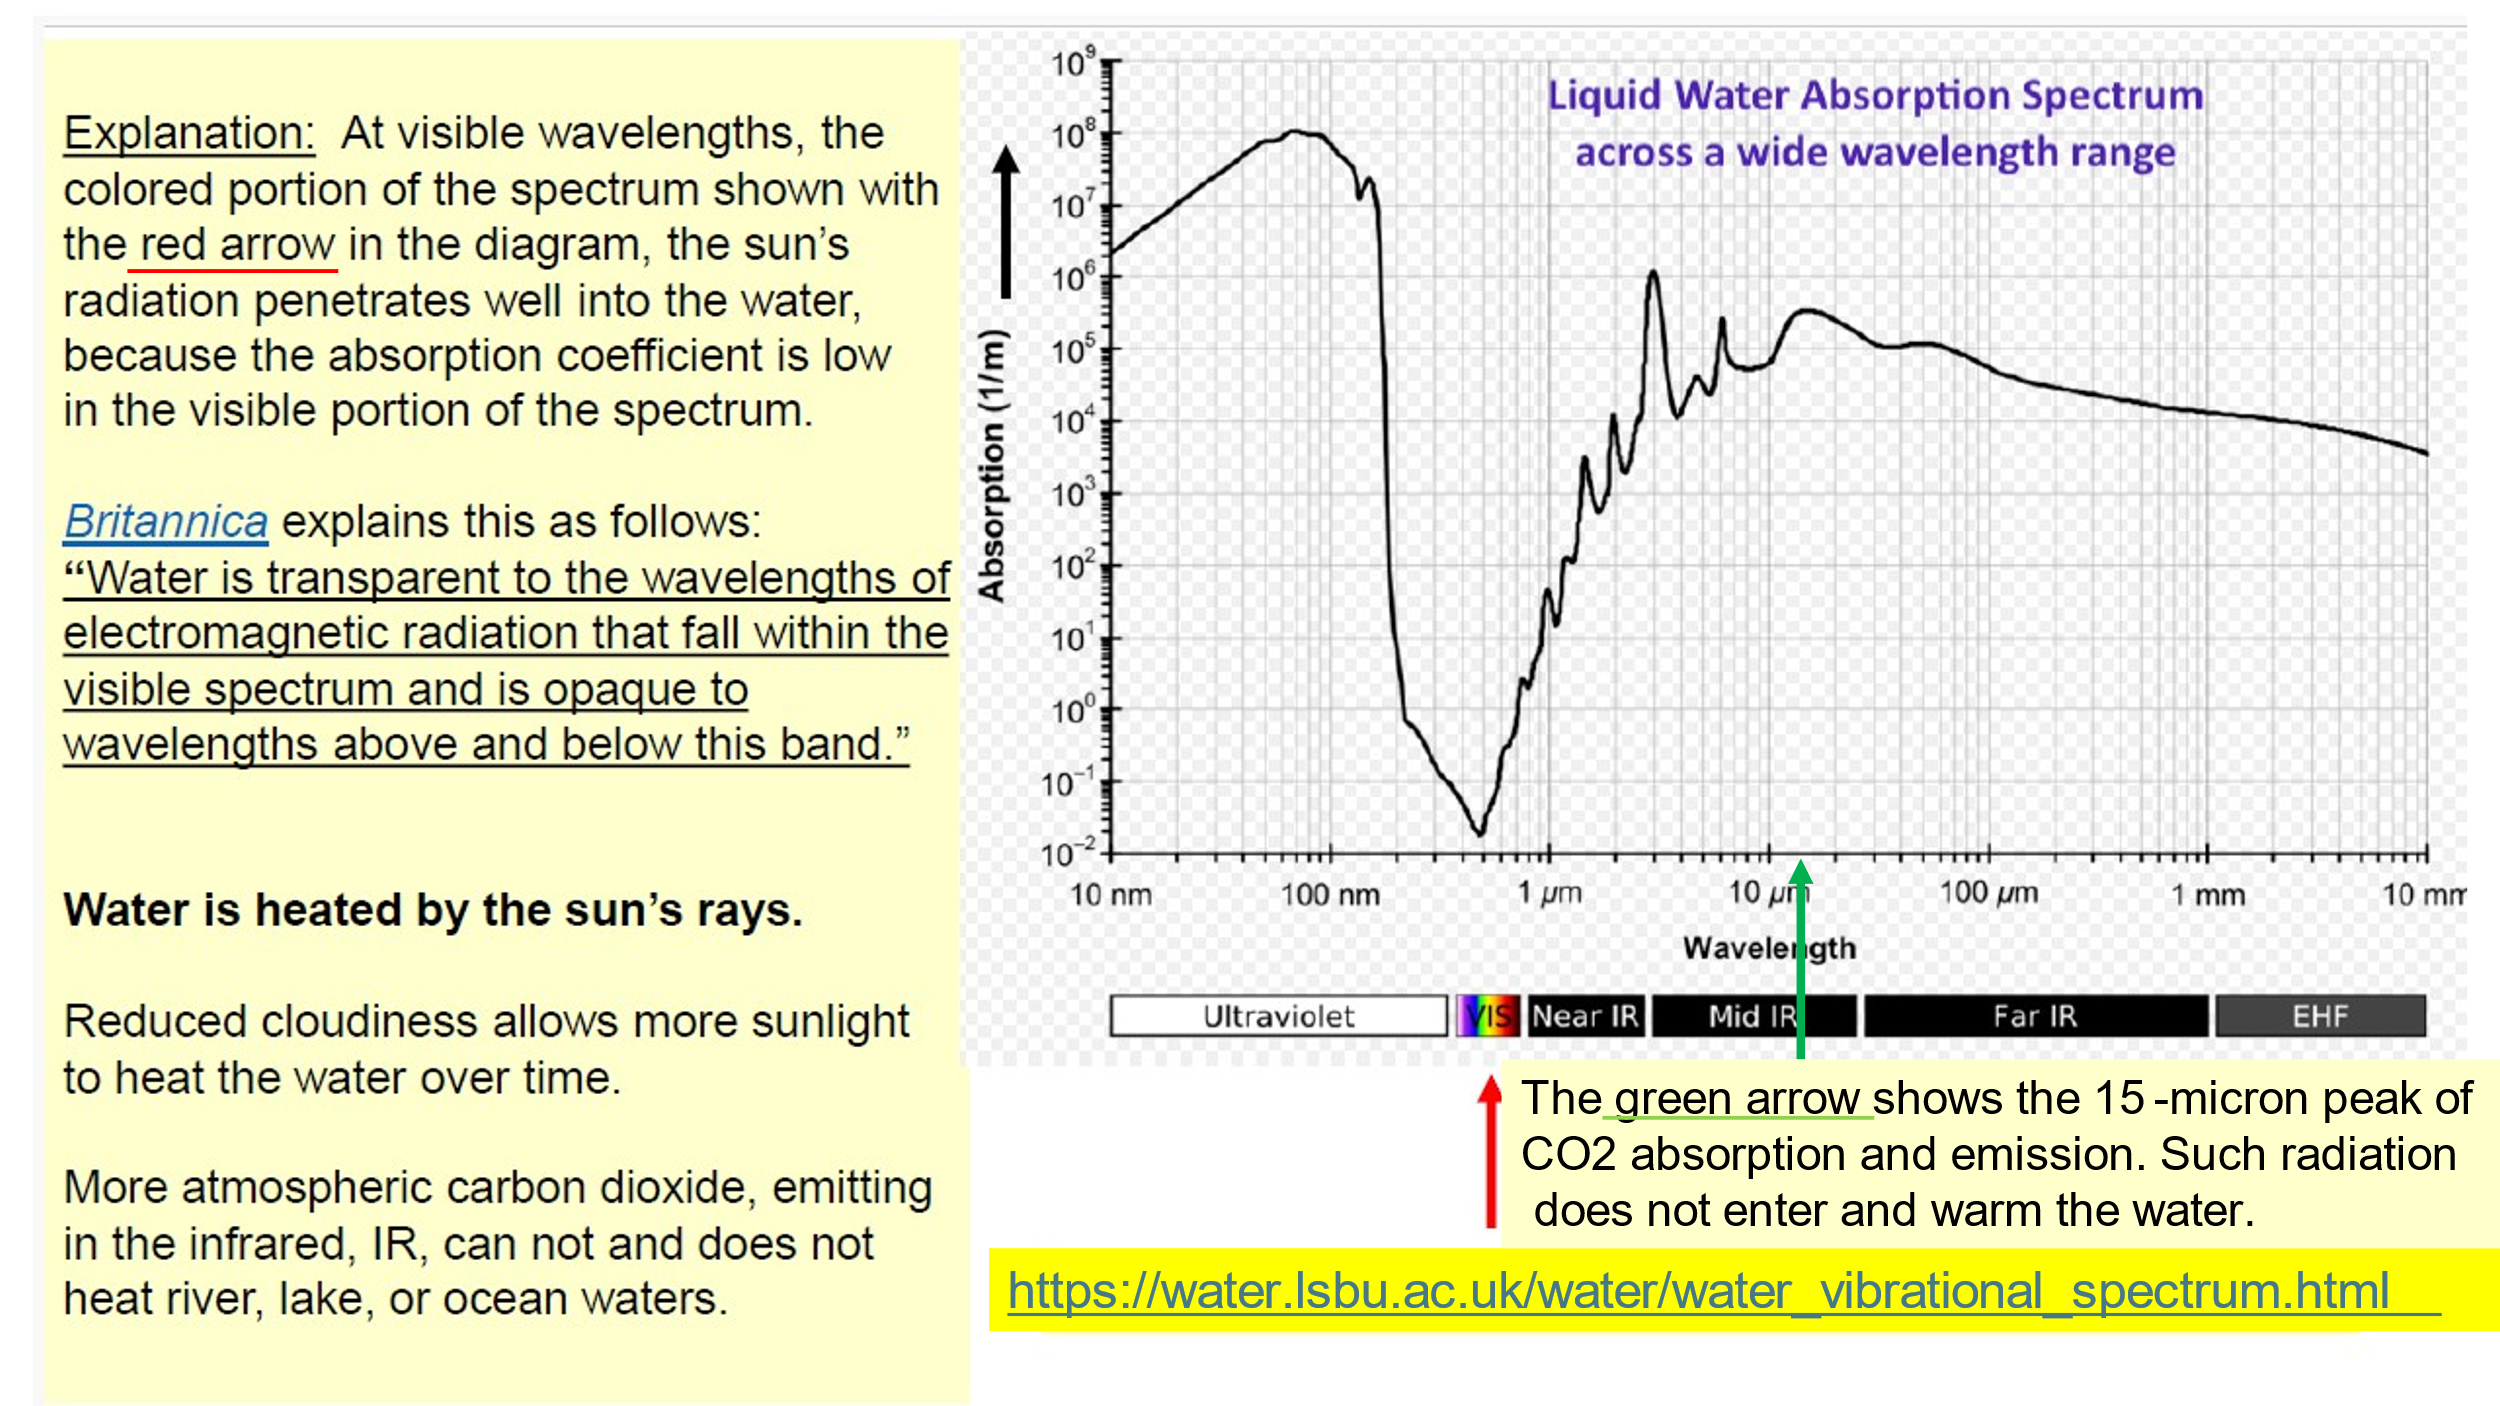
If you look at the physics of the penetration of solar radiation into water, including sea water, it is the visible radiation from the sun that warms water. It is clearly NOT increasing concentrations of atmospheric CO2 which emits in the infrared, which radiation stops at the water surface and does not enter the water.
Figure 3 below, taken from the presentation graphics, shows clearly that the claim by Yale Climate Connections and their partner in crime against the truth, Climate Central, are patently not true. The truth of this matter, plainly found in the physical science world, is the visible light from the sun heats the ocean water, not invisible heat radiation in the infrared, as is emitted by CO2.
There is another important fact from the physical science world that Yale Climate Connections misses directly in play here, global cloud cover changes.
In 2019, Pokrovsky, using data from the International Satellite Cloud Climatology Project, the ISCCP, showed that cloud cover decreased from 68% in 1986 to 64% by 2000 the lesser number of which continues to at least 2010.
The presentation graphics contain the data from Pokrovsky which show that as the years progressed from 1986 to 2000, cloud cover decreased, shown in Figure 4 below.
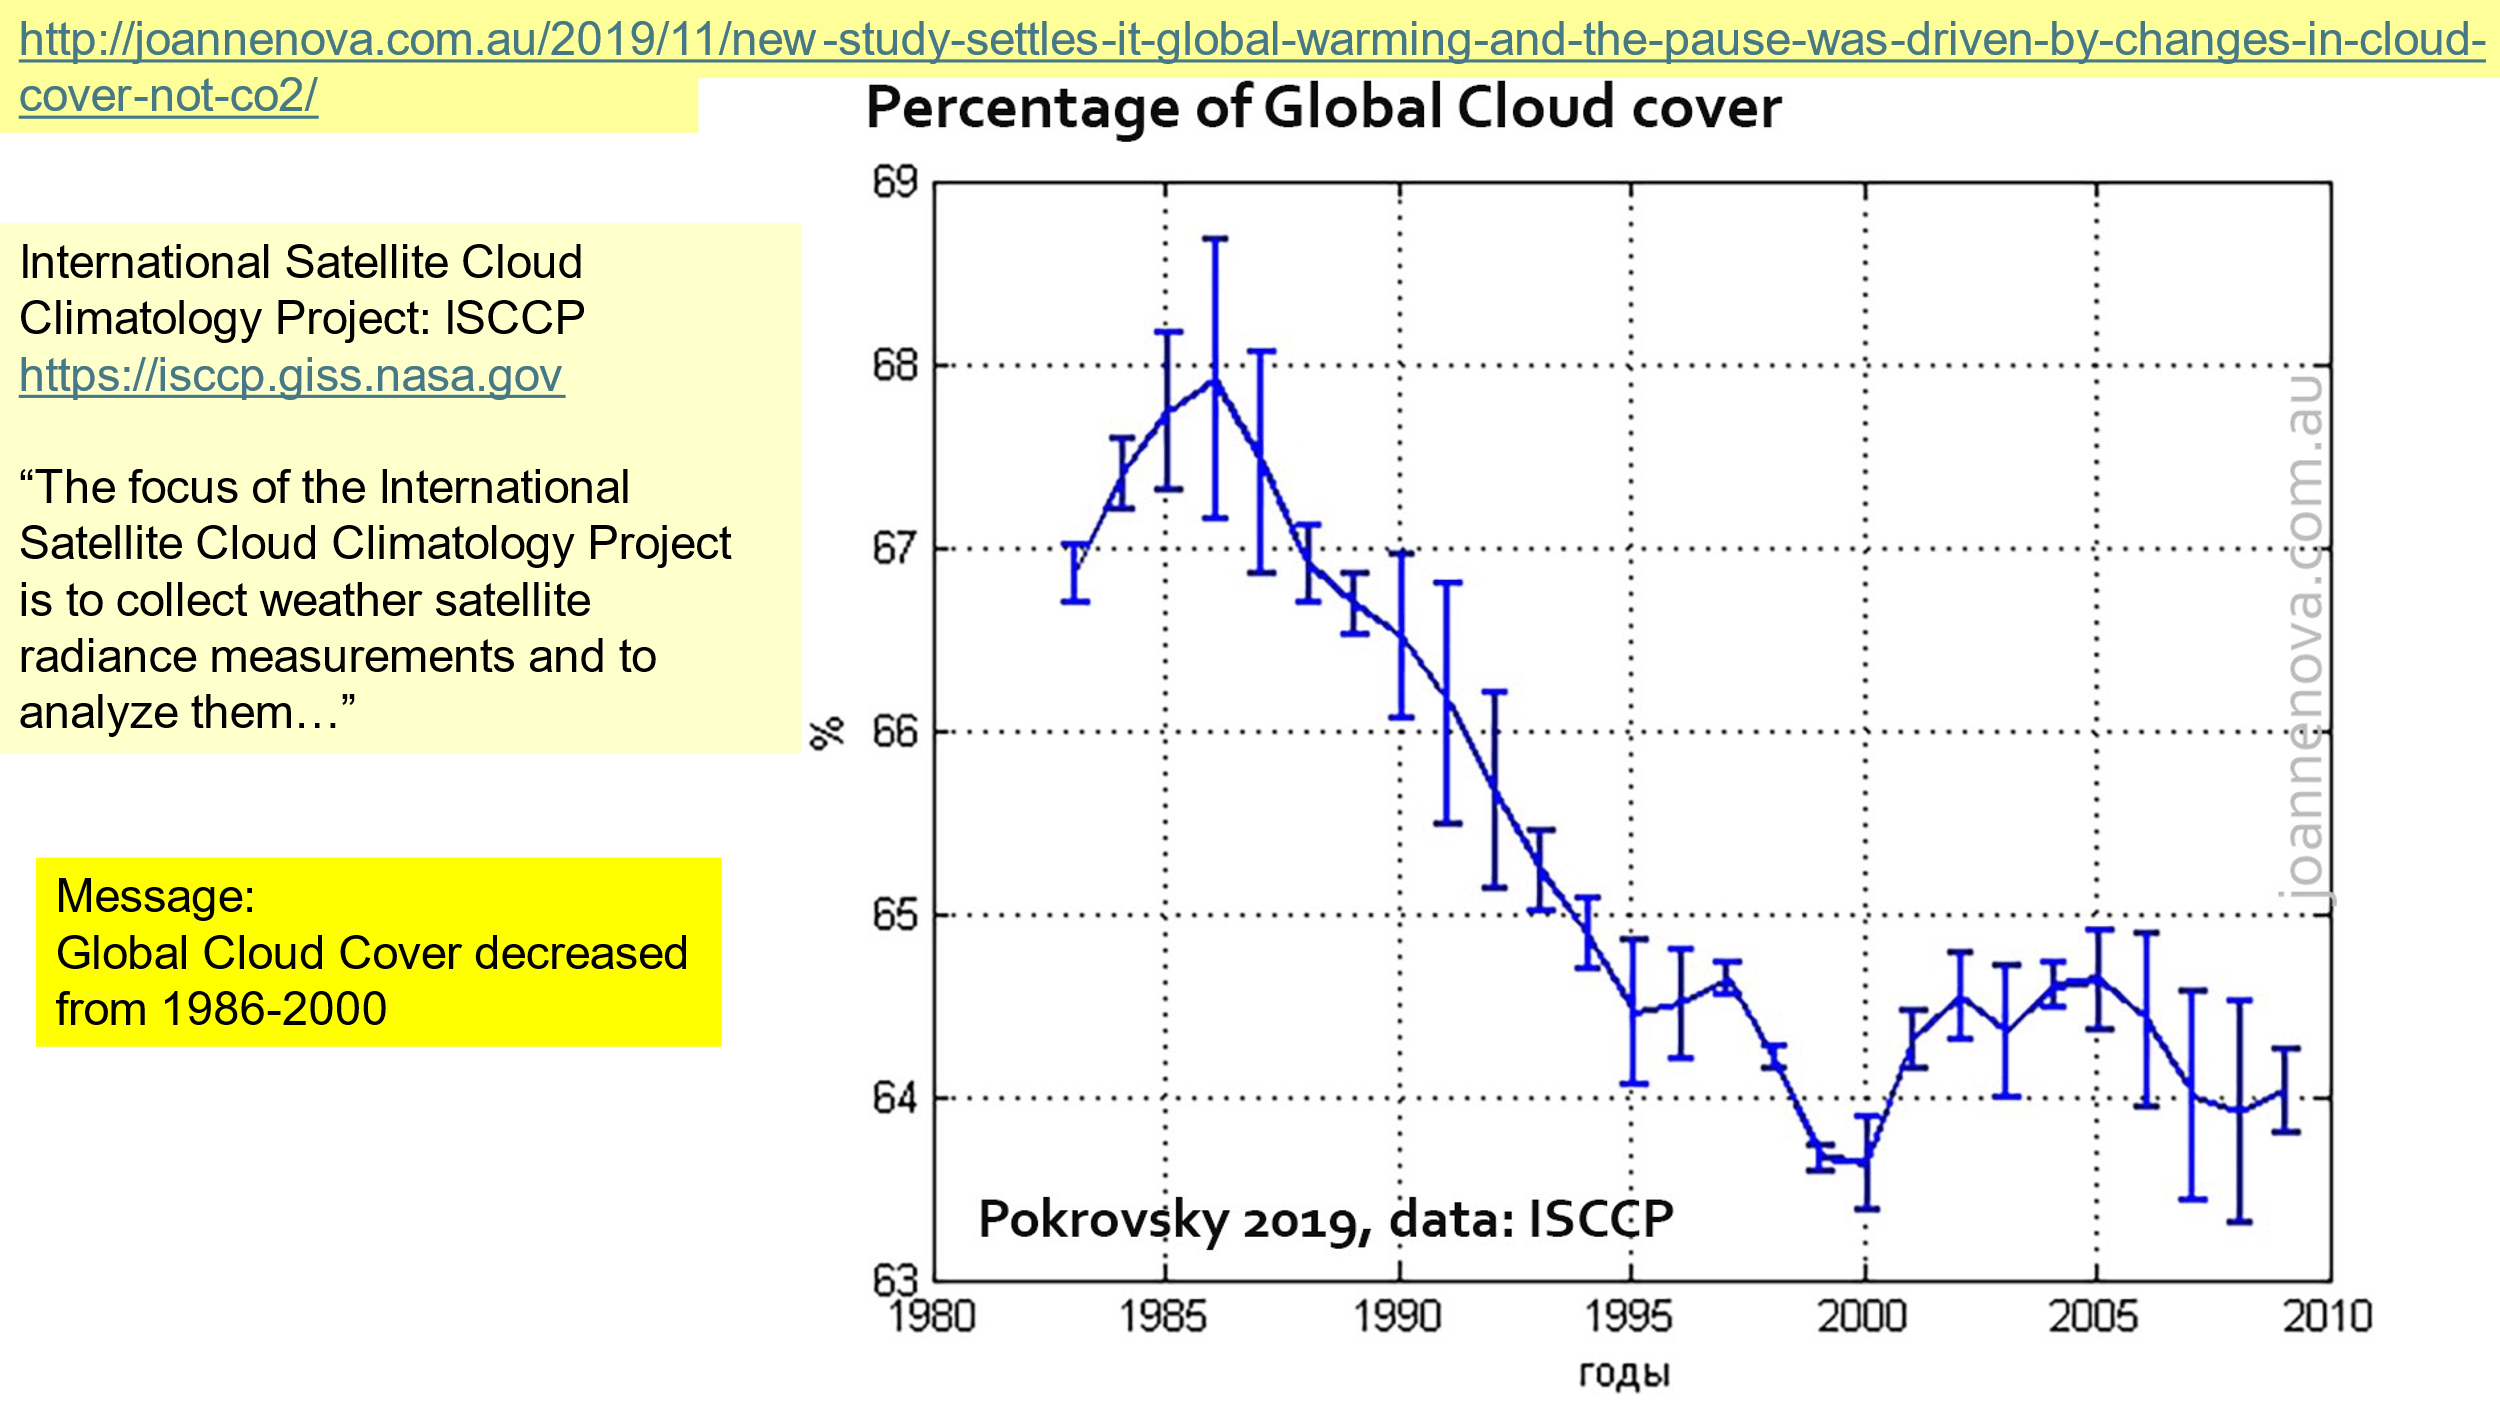
And, not surprisingly, as the cloud cover decreases, earth surface temperatures increase.
STORMS: THEY HELP MOVE HEAT ENERGY TOWARD THE POLES
From our studies of atmospheric motions, it is clear that the atmosphere helps export heat from the tropics poleward. In the Atlantic Basin, both the Gulf Stream in the ocean, and the atmosphere above the Atlantic help export heat from the tropics.
Think about it. With all the sun’s energy deposited in the Tropics, they are NOT heating up much at all, so it is plain that the heat must be efficiently moved poleward. How is that done? The Gulf Stream does its part, but Hurricanes in the Atlantic basin also help.
Figure 5 shows this, it comes from the graphics from my Course, “Weather, Climate, and Climate Change—What the Data tell Us,“ from 1 Oct 2019.
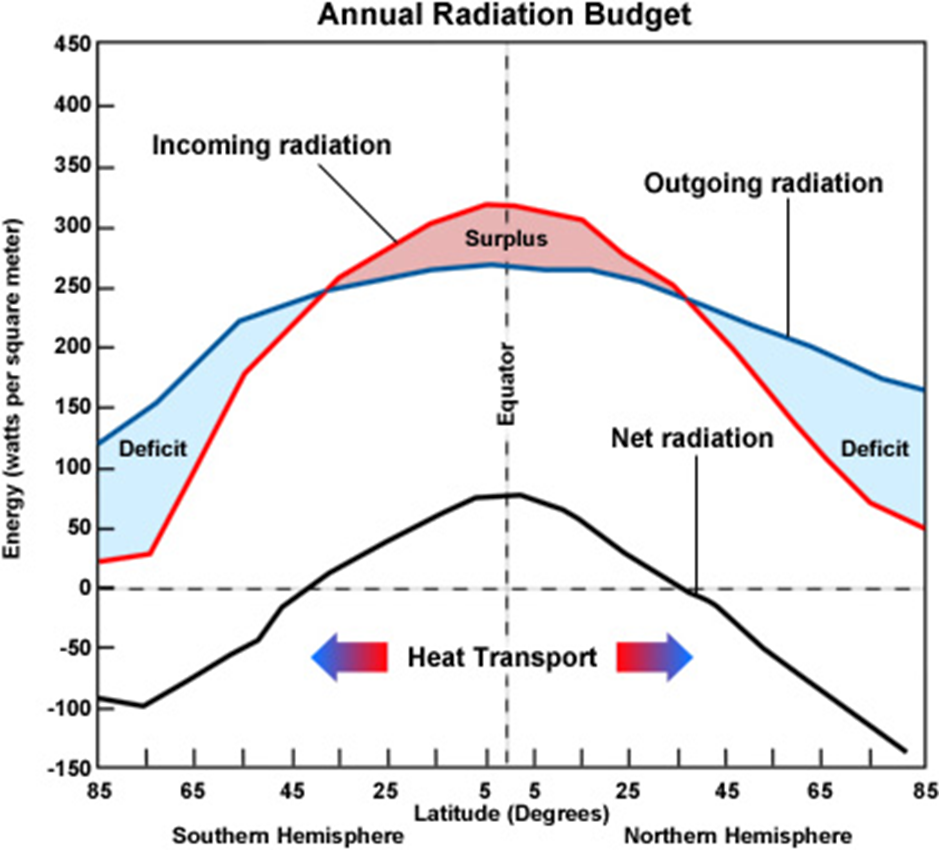
So, yes, there were dramatically warm surface water temperatures in the Gulf of Mexico during the times Helene and then Milton formed late summer, 2024. We’ve seen that the 2024 hurricane season got off to a late start. This was exacerbated by dust in the atmosphere from the Sahara Air Layer. These factors, sunlight heats sea water, and reduced cloud cover, especially from the Sahara Air Layer in Summer 2024, clearly and distinctly explain the very warm Gulf of Mexico surface water temperatures late summer 2024.
Hurricanes Helene and Milton formed to help export that excess heat poleward, human emissions of CO2 had nothing to do with this. Sorry, Climate Central and Yale Climate Connections, storms like these have happened many times before, and will happen again.
How do I make these statements? What proof do I have?
VERY STRONG HURRICANES FROM THE PAST
Let’s look at the Great Hurricane of 1780, which devastated Barbados, Martinique, St Lucia and other Caribbean Islands. It was described as “the deadliest hurricane of all time” in the Atlantic Basin. Wikipedia says, “between 22,000 and 27,501 people died.”
Now let’s look at my claim, “storms like these have happened many times before…”
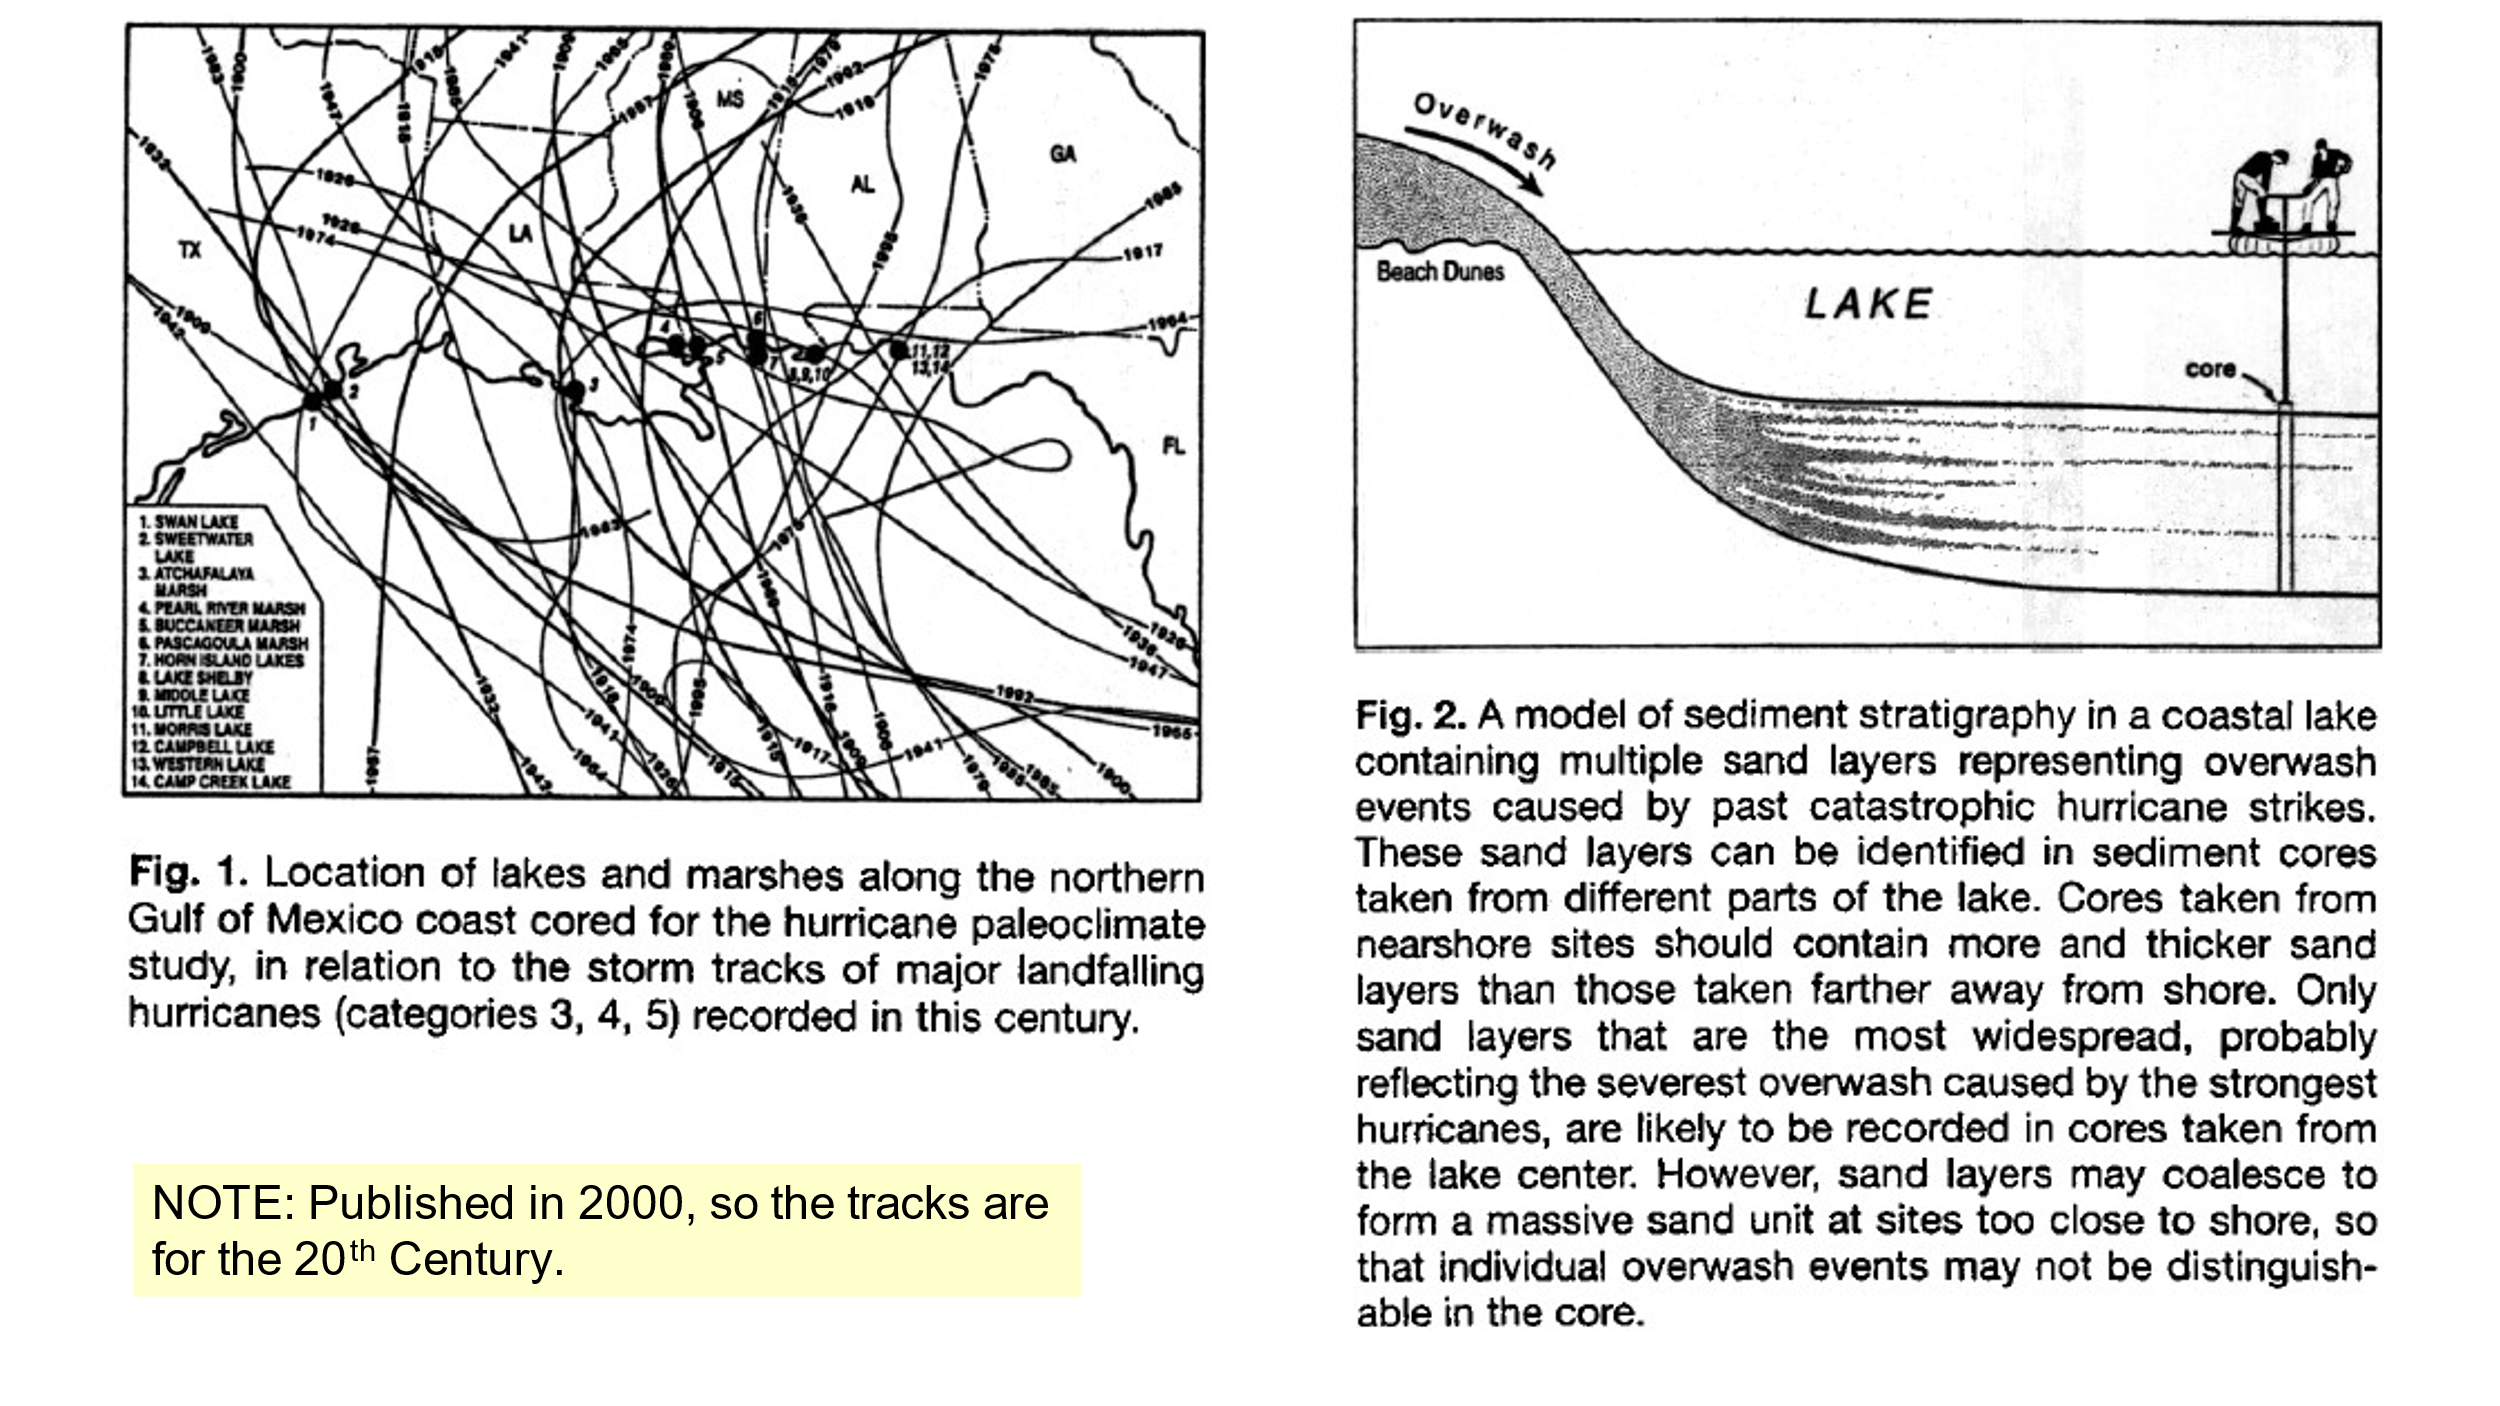
There are data from overwash from Very Strong Hurricanes in the historic past on the Gulf Coast which show these very strong storms occurred in the past, with a lot less atmospheric CO2.
The next two graphics came from Liu and Fearn, who studied and published, “Holocene History of Catastrophic Hurricane Landfalls along the Gulf of Mexico Coast Reconstructed from Coastal Lake and Marsh Sediments.”
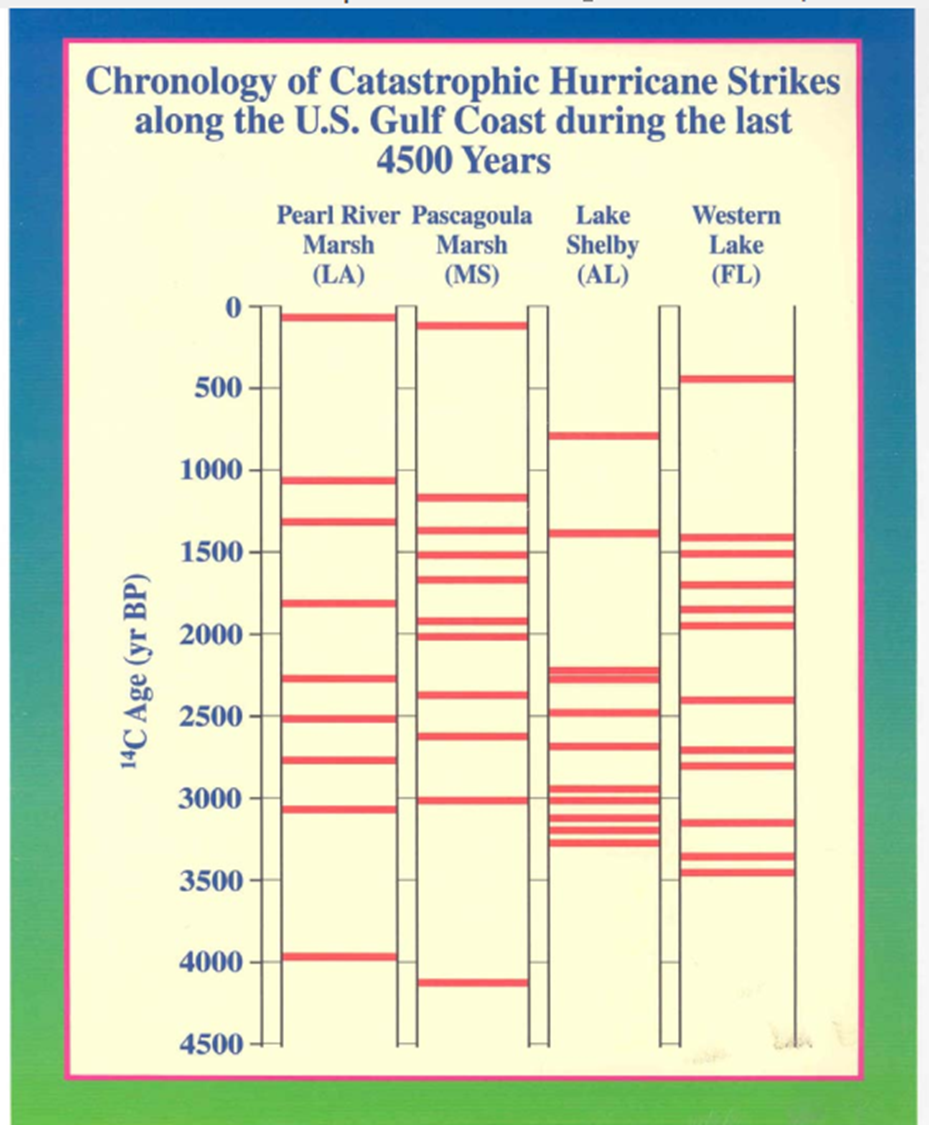
Below is Figure 7, from Liu and Fearn, showing the results of their study of the sediments. The ordinate is time for each of the coastal lakes determined from radiocarbon dating using Carbon 14. From Left to right, from west to east, as if facing northward, Pearl River Marsh, LA; Pascagoula Marsh, MS; Shelby Lake, AL; and Western Lake FL. The data show a distinct maximum of Very Strong Hurricane-generated overwash-produced coarse sediment layers from 1000 years before present (BP) to 3500 years BP, well before human-caused increases in CO2 could have caused increases in hurricane strength in the Gulf of Mexico.
CONCLUDING REMARKS
I have shown that alarmist claims that the strength of the two hurricanes that affected the southeastern US in September and October 2024, Hurricanes Helene and Milton, occurred as a result of natural factors. These hurricanes were not influenced by human-caused increases in CO2.
In recent years, a new industry, the “Weather Attribution Industry” has come into being. That industry, explained by Roger Pielke, Jr., writing in Substack, has a goal of increasing the immediacy of the notion that human production of CO2 is causing stronger storms, higher rainfall amounts, and other adverse effects from storms in progress. The use of this methodology, called Tactical Science, while the event is in the news, has at least two purposes, to attribute blame, “with the courts in mind,” and to bring to the forefront this notion, “Dangerous Climate Change is here Now!”
At least two alarmist organizations, Climate Central and Yale Climate Connections, blamed the strength of 2024’s Hurricanes Helene and Milton, on warm water in the Gulf of Mexico resulting from Human-Caused CO2-Fueled Climate Change, which “amplifies extreme weather.”
It is true that the extremely warm waters in the Gulf of Mexico caused these hurricanes to gain strength rapidly. But the warm waters resulted from a late start to the 2024 hurricane season, which allowed more sunshine on the Gulf waters. I showed that it is sunlight that heats water, not more radiation from the earth’s atmospheric CO2. Cloud cover decreased significantly from 1986-2010 as shown by Pokrovsky, using data from the ISCCP. A Sahara Air Layer inhibited cloud formation allowing even more sunlight to heat the Atlantic and Gulf waters than with average weather conditions.
Data from the sediment from lakes bordering the Gulf of Mexico from Louisiana to Florida was examined using radiocarbon dating techniques. Sediment cores from these lakes revealed coarse sand layers attributed to overwash from very strong hurricanes, which revealed a maximum in the concentration of these coarse sand layers from 1000 to 3500 Years BP. Naturally-occurring Very Strong Hurricanes have been a feature of hurricanes from the Gulf of Mexico for thousands of years.
These hurricanes have left their fingerprints, so to speak, in the sediment deposited on lakes bordering the Gulf of Mexico. Very Strong Hurricanes are a fact of life in this part of the USA. Such hurricanes occurred in 2024; no help from human-caused CO2 emissions is necessary to explain the strengths of Hurricanes Helene and Milton.
