
Robert W. Endlich
INTRODUCTION
On 3 May 2026, United Flight 169, a Boeing 767-400 ER (Extended Range) flew its scheduled transatlantic flight from Venice, Italy’s, Marco Polo International Airport (ICAO code LIPZ) to Newark Liberty International Airport (ICAO code KEWR) and, on landing approach, struck a highway light stanchion on the New Jersey Turnpike (part of I-95) during its final approach.
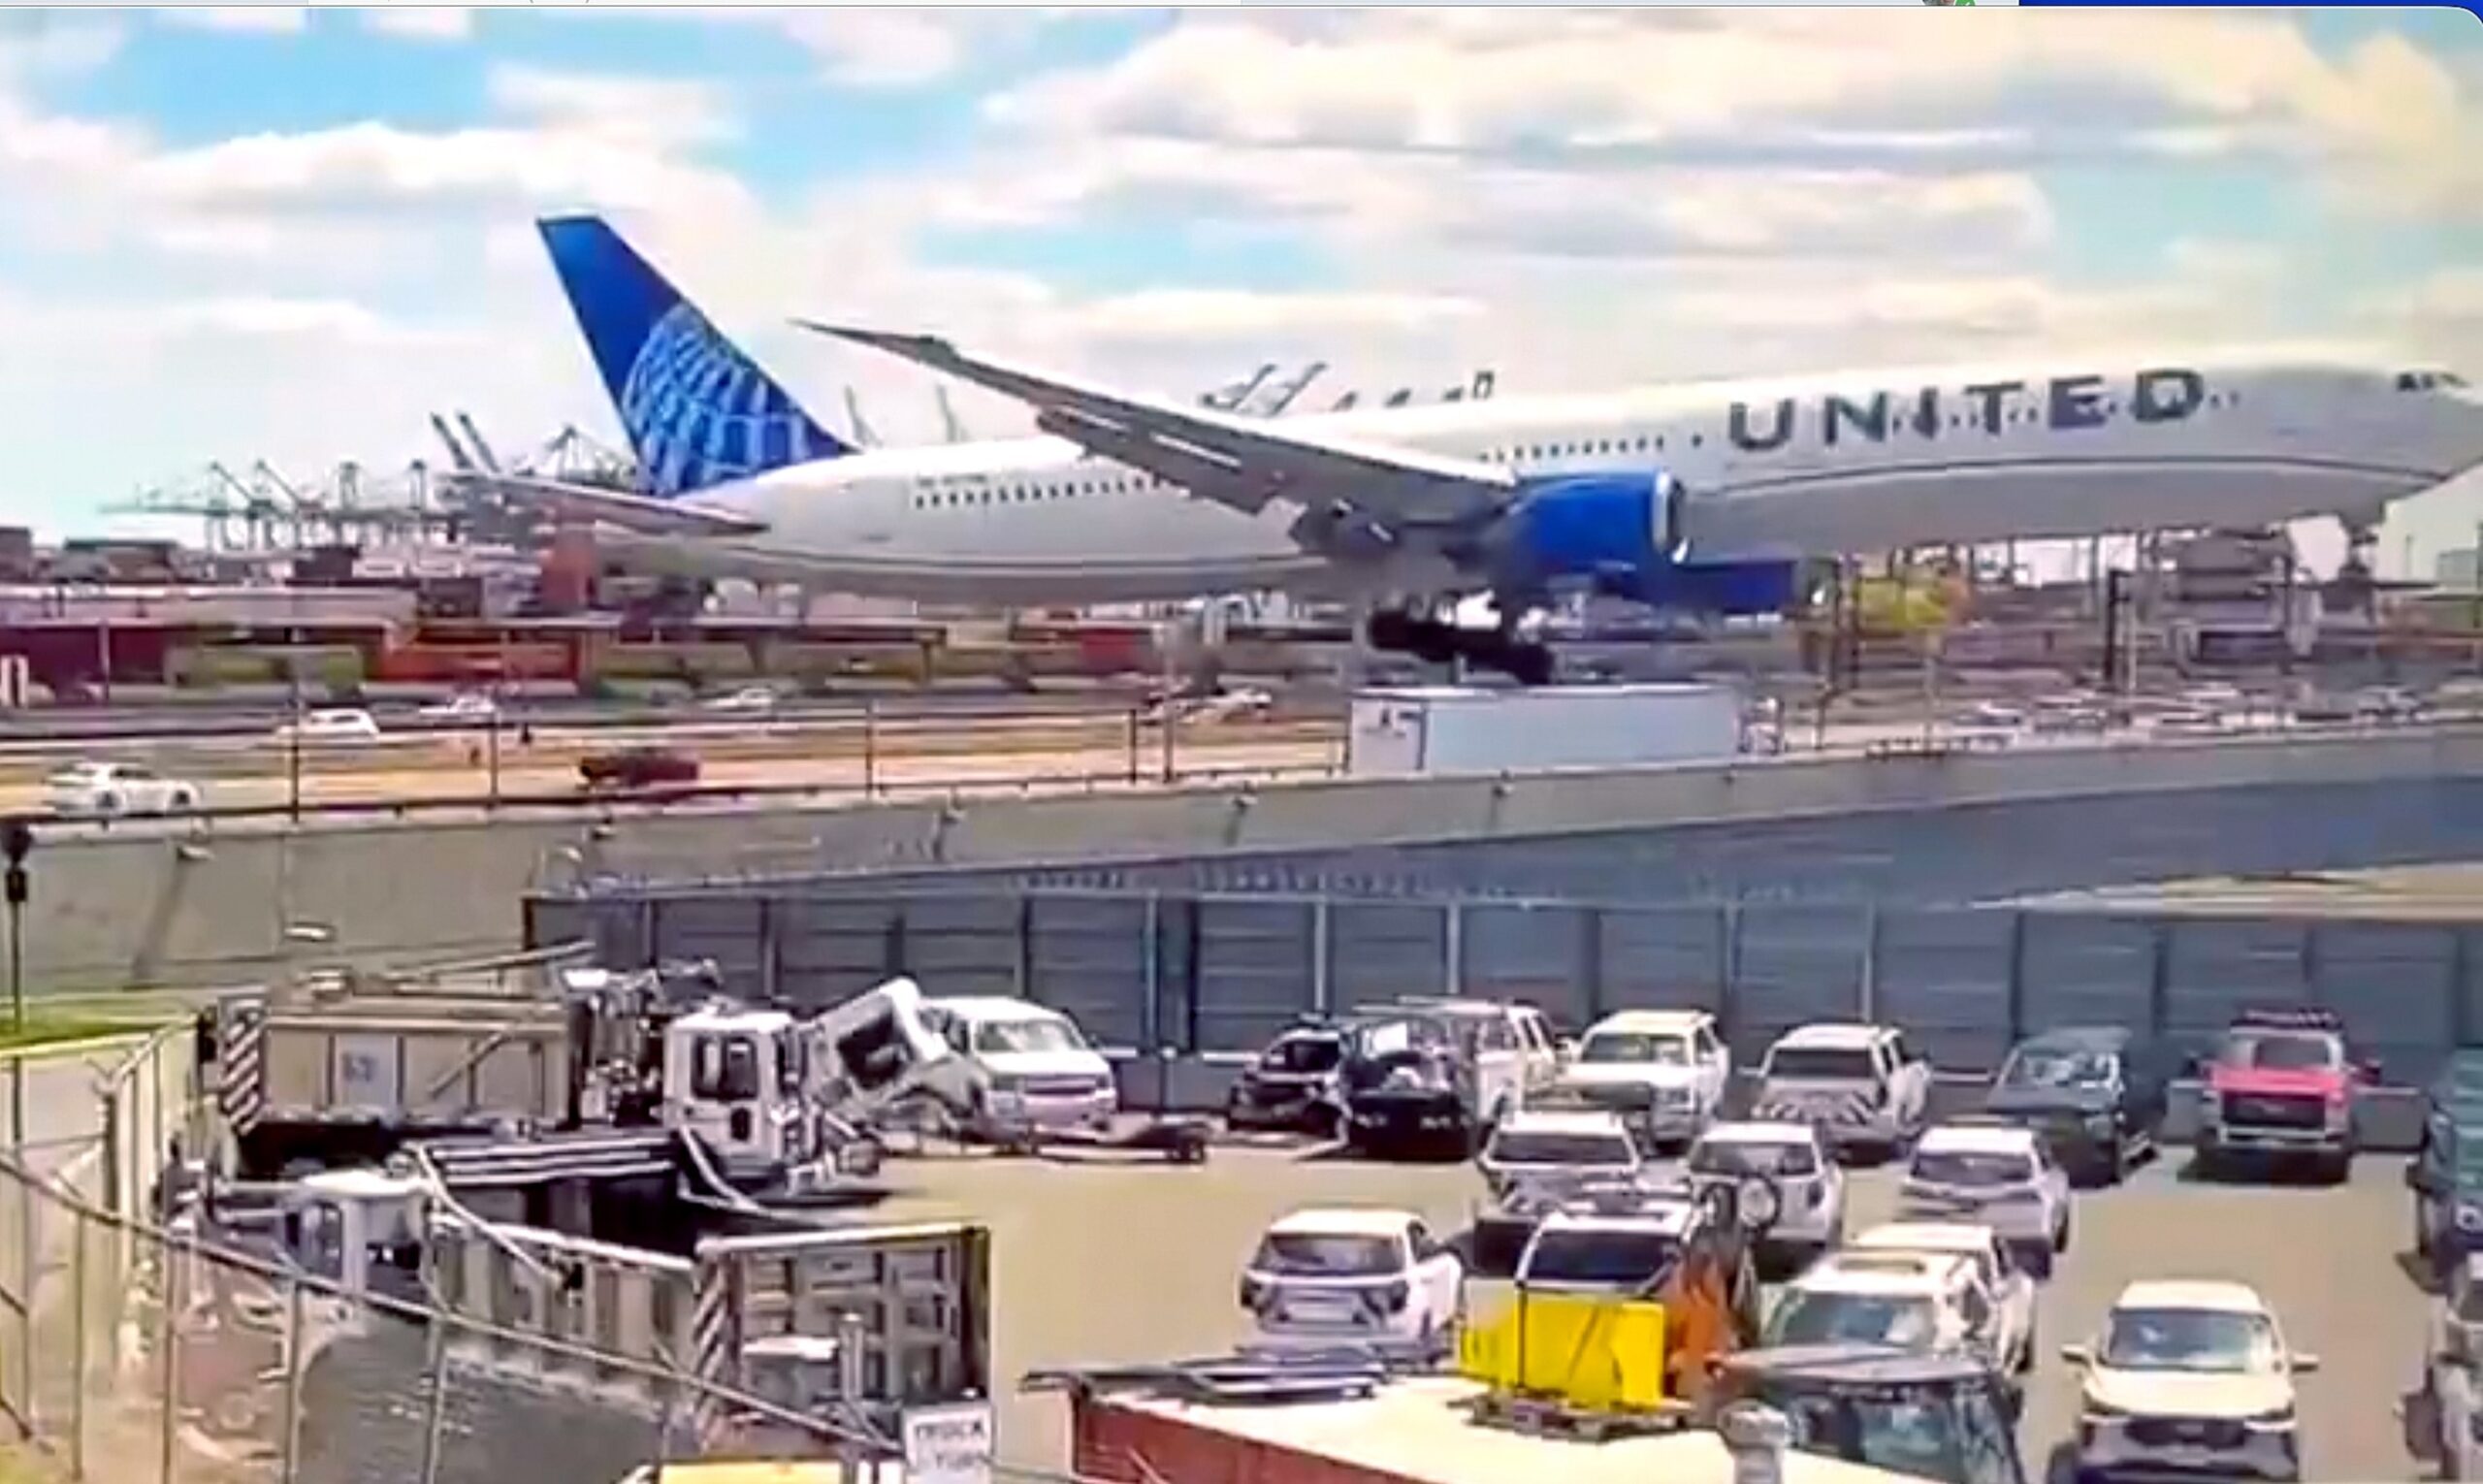
There are claims Flight 169 also directly struck a semi-trailer operated by Bakers Express, driving on exit 14C of the Turnpike at the time, and was directly under the final approach path of Flight 169. In any event, damage to the aircraft was not discovered until half an hour after landing, when it was parked at the passenger gate at Newark Liberty Airport.
After the damage to the aircraft was discovered, pictures were taken, videos were produced, and this incident was in the national and international news and subsequently was a feature of the aviation safety blogosphere. I have used several of these sources, my own research, and my aviation-related experience as the basis for this post and a presentation to CASF.
BOTTOM LINE UP FRONT
I believe the reason the Pilot Flying United Flight 169 accidentally hit a light pole and may have grazed a semi-trailer on the New Jersey Turnpike (I-95), is because Flight 169 encountered exceptionally strong sinking air while crossing from over Newark Bay to over solid land, on final approach to Runway 29, Newark Airport.
Among contributing factors in this accident: combination of short Runway 29 length, only 6501 ft. long, and subsequent pressure to land “on the numbers” near the threshold of Runway 29, the overwater path of this RNAV (Area Navigation) circling right-hand approach to Newark, abnormal position of the PAPI (Precision Approach Path Indicator) lights, located in a non-standard location, on the right side of the runway, and importantly, strong convective overturning of the air with strong lifting and sinking air, as the aircraft entered the dry airmass over solid land, and finally, lack of sufficient information to warn of strong downdrafts, a few moments and a few thousands of feet short of Newark’s Runway 29 touchdown point.
We will get into the several reasons why I make this statement.
I grew up in New Jersey; as a kid, we frequently visited my Dad’s parents who then lived on Fifth Street, Newark, and we often drove by Newark Airport. When I was seventeen years old, my Dad helped me get a summer job in his company, the Prudential Insurance Company, Newark, NJ, and Summer of 1957 I commuted from the Jersey Shore to Newark and back, taking a then-Jersey Central Lines commuter train which passed along the railroad tracks next to Newark Airport, every workday.
After high school, I went to Rutgers, in New Brunswick, NJ, graduating with a Bachelor’s in Geology in 1962. Early in 1963, I joined the Air Force, and later in 1963, the Air Force sent me to Texas A&M for a year to complete a Basic Meteorology course of study, and I subsequently began a 21-year USAF career as a Weather Officer.
Later, I had an 18-year stint as Meteorologist in the Army Atmospheric Sciences Laboratory, with 10 more years at New Mexico State University working on Army Task Orders as a Contract Meteorologist.
Along the way, from 1970-2001, I became a sailplane pilot accumulating 500 hours in 500 flights, learning to find natural sources of lift to keep the sailplane aloft, and avoiding areas of strong sinking air; hereafter I will just call it sink.
These experiences, plus my duty as the Weather Officer Member of the Air Force Accident Investigation Board investigating an EC-121R which crashed on takeoff into a thunderstorm in Thailand in 1969, allow me to provide additional information on this landing accident at Newark.
SAILPLANE PILOT
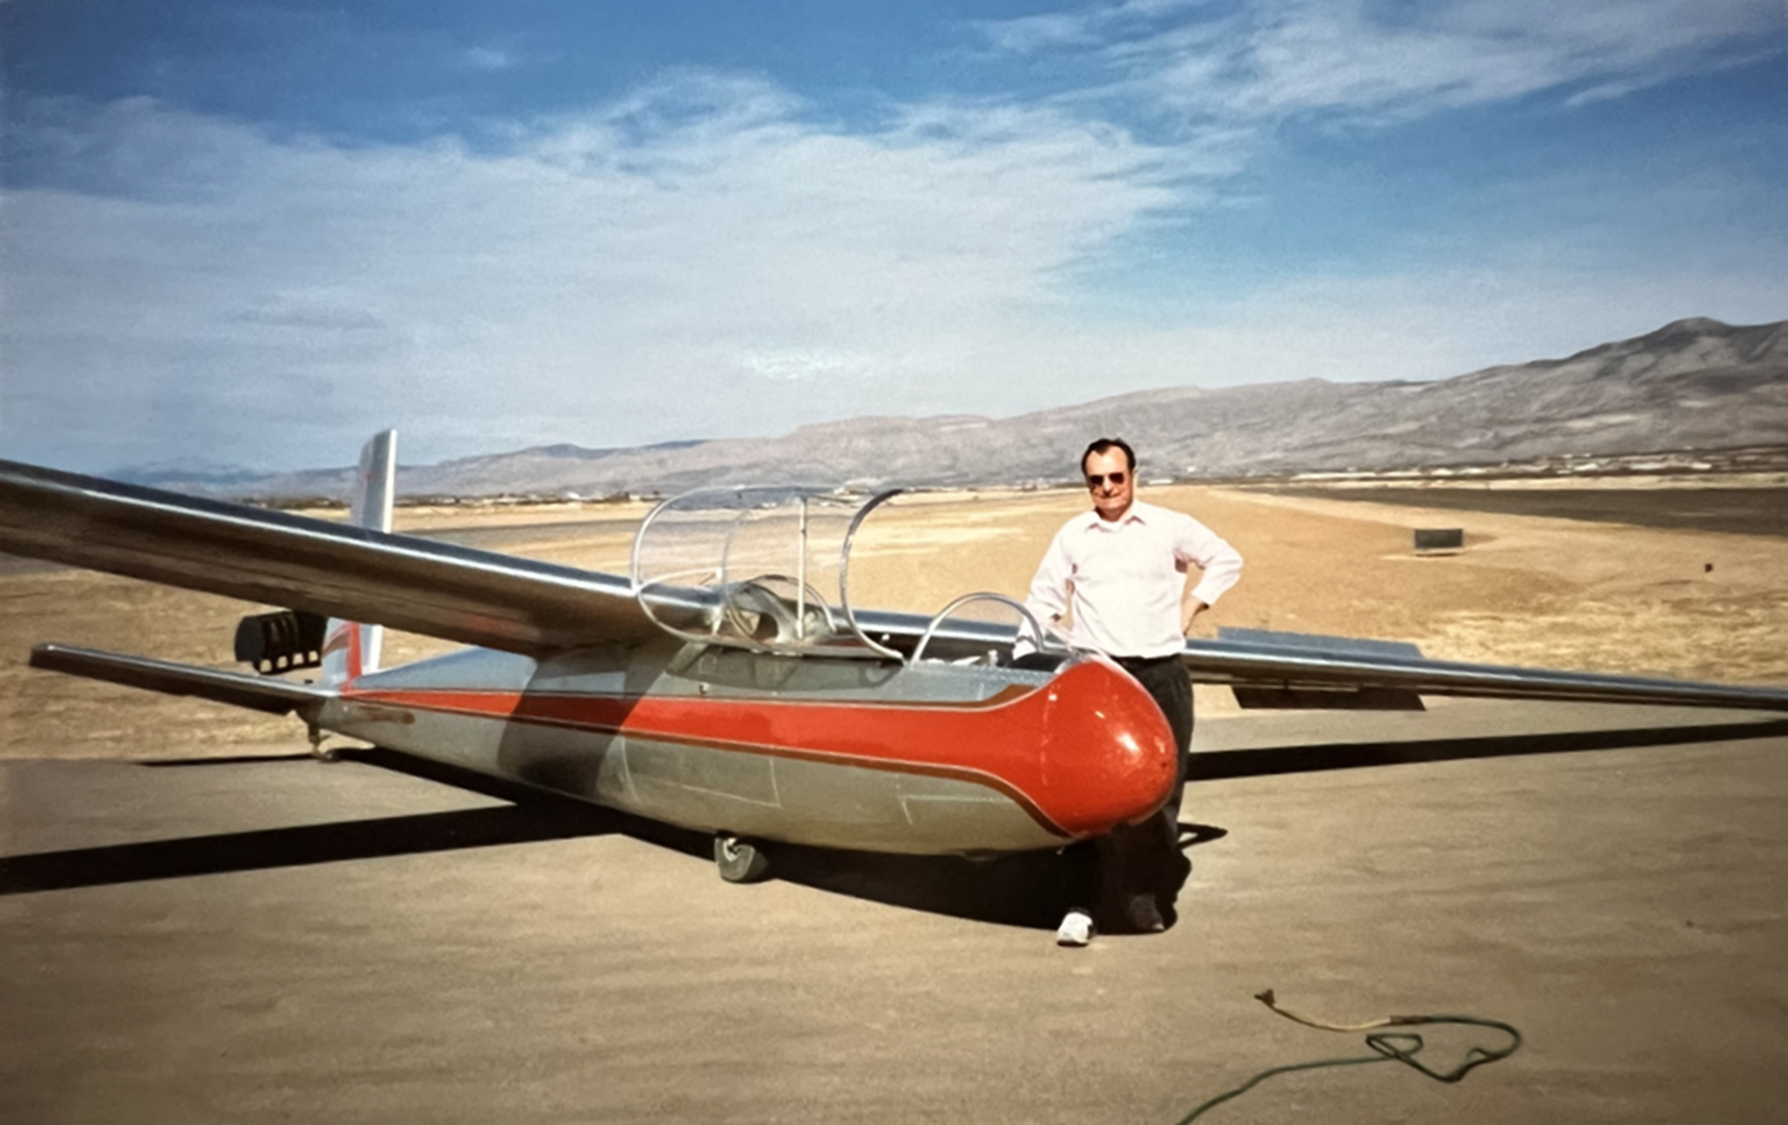
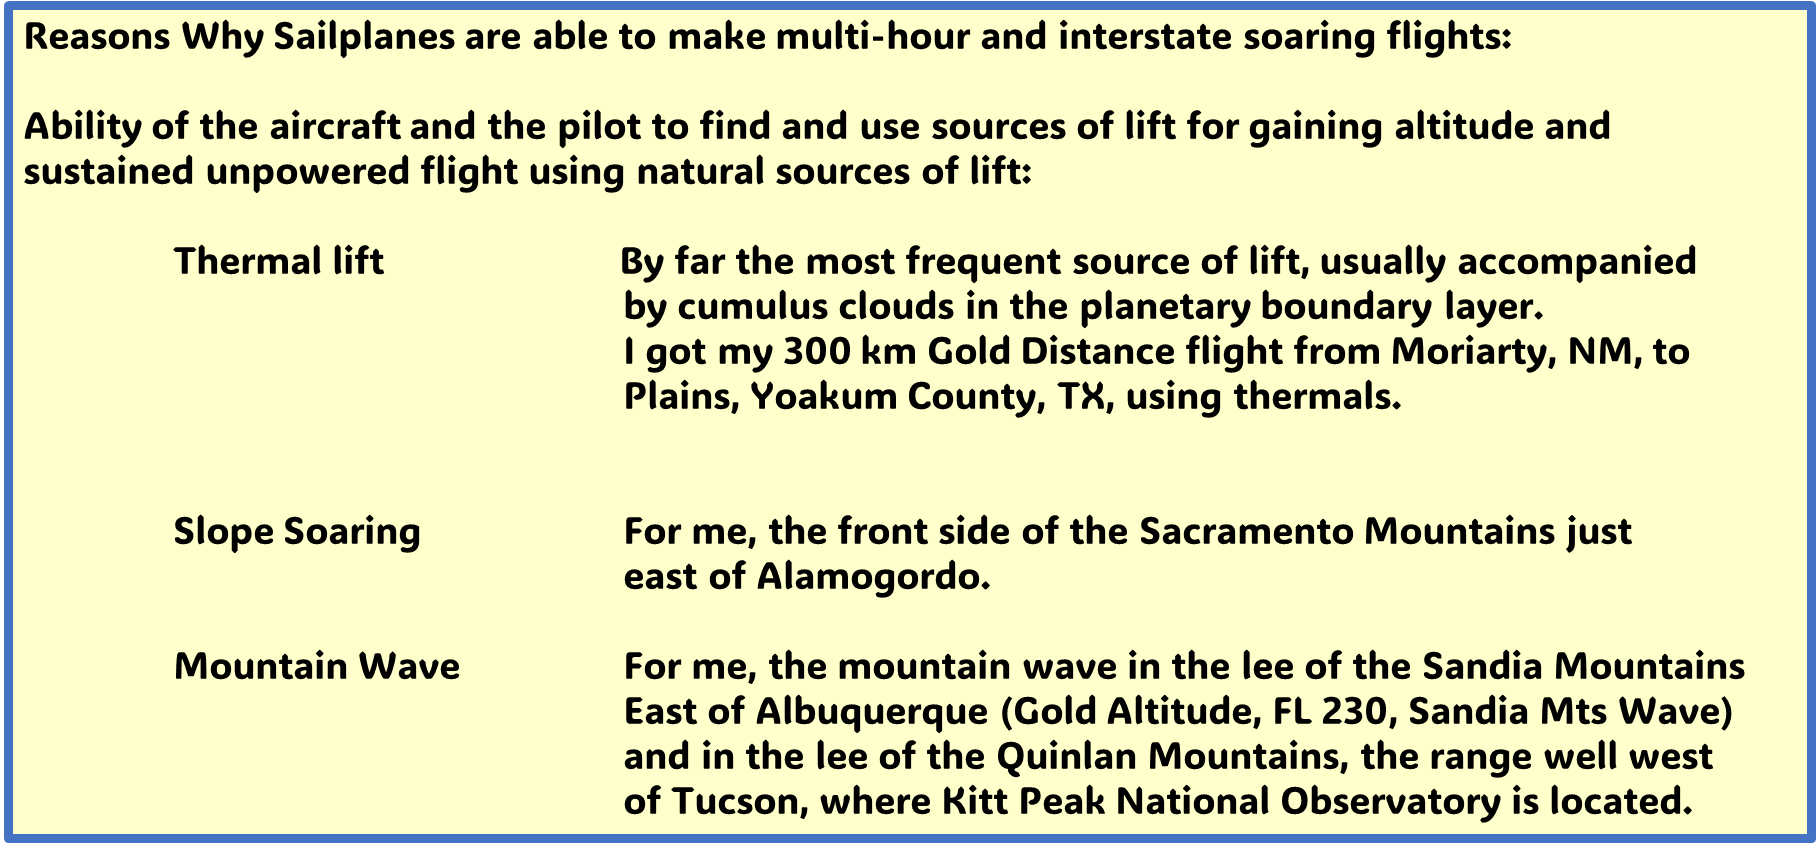
Except when on tow, sailplanes are always flying without benefit of engine power, which allows the utilitarian tasks of powered aircraft. As a result, engaging in flight without benefit of engine power, many sailplane pilots become adept at “reading the sky,” to enable them to remain aloft for extended times, and at times, to fly extended distances. Also, conditions allowing, sailplanes can achieve extraordinary altitudes unavailable to light plane pilots.
My experiences as Weather Officer, Meteorologist, and licensed sailplane pilot have led me to the conclusion that as United Flight 169 turned onto final approach of Runway 29 at Newark, the aircraft encountered strong sink, and, without the ability to see the PAPI (Precision Approach Path Indicator) lights over an extended distance, such as might have been visible with a long straight-in approach, the existence of that strong sinking air was unknown to United Flight 169’s Pilot Flying.
My opinion is that the existence of that strong sink was the most important factor in Flight 169’s low altitude crossing of the New Jersey Turnpike and striking the light stanchion, just before touchdown.
NEWARK LIBERTY INTERNATIONAL AIRPORT AND VICINITY
Newark’s Liberty International Airport is one of three major airports serving the New York-New Jersey Metropolitan area. The other two are John F. Kennedy International Airport, and LaGuardia Airport.
These three major airports serve this area because of the huge population, over 20 million people in the Tri-State area. This area has grown over the last four centuries because of the promise to many immigrants of a new life in the New World, first in the British Colonies, then, after Independence, in the United States. But there is a component of this population growth which occurred because of the area’s unique geography.
The drowned mouth of the Hudson River provided easy access to a huge, protected, deep-water natural harbor, the geography of which further accelerated the historic growth, which now includes these three major airports. There is a flip side to this geography because some of the approaches to the runways are over the waterways which are part of this metro area, which becomes important in the six or so weeks nearest the summer solstice, such as when I wrote this in May 2026.
During those days, and most especially in the hours closest to and soon after local noon, when the sunlight shines on the surface, water surface temperatures change little over the course of a day, while over dry land, the situation is very different. Over land, dry ground itself heats up considerably, (think of walking barefoot from the beach to a paved parking lot in the heat of a summer’s day) and air right over the ground heats directly by contact. Shortly thereafter, that warmer, and now less dense air rises, to be replaced by cooler air, a process that continues for hours, creating thermals, which are well-developed updrafts. Thermals frequently are the source of those puffy fair-weather cumulus clouds which often mark presence of active updrafts.
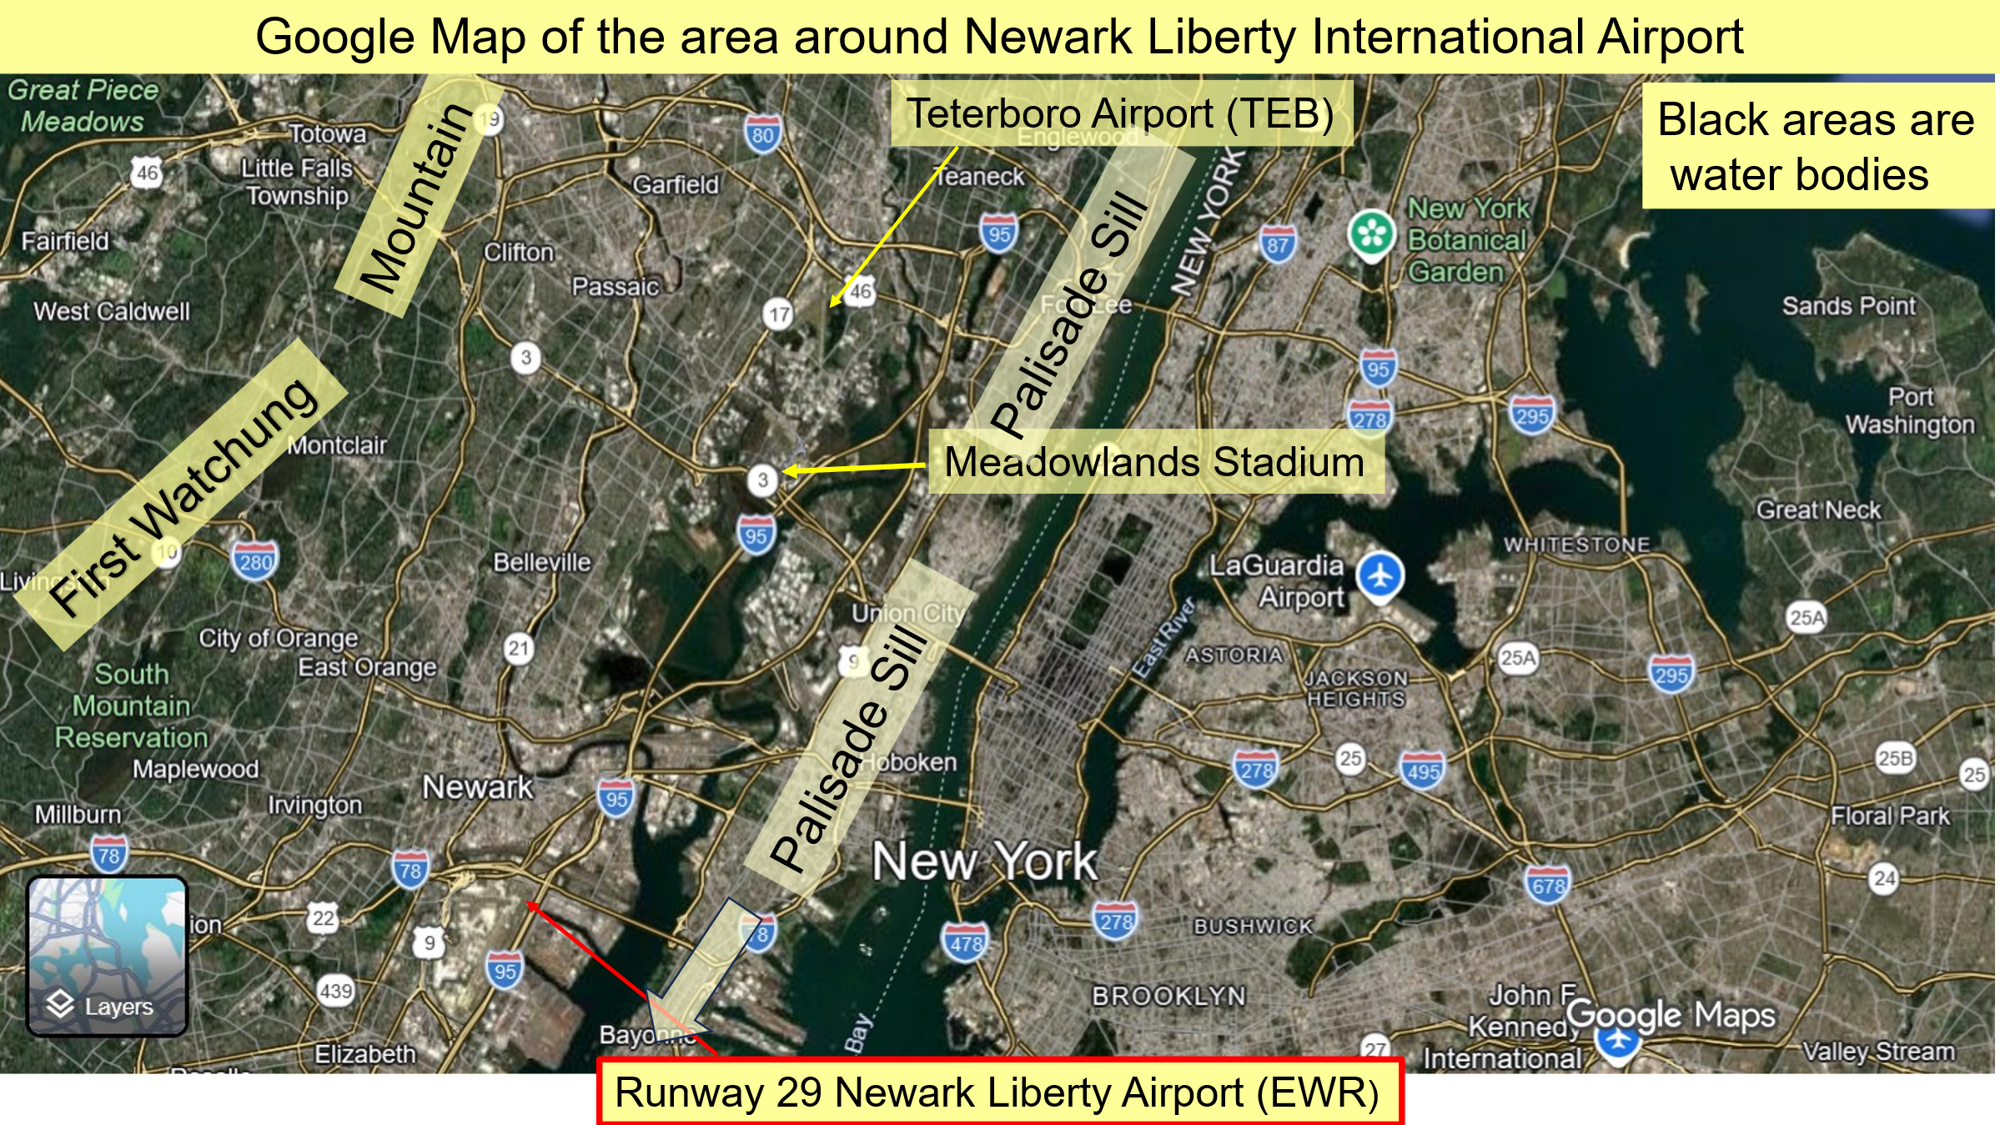
Figure 3 below shows an annotated map of the area around Newark Liberty International Airport; the red arrow at the bottom points to the approach end of Newark’s Runway 29. Note in particular the label, “Black areas are water bodies.” Just to the right from Brooklyn and extending north and east is New York’s Long Island; the blue dots with airplane logos are the locations of the previously mentioned other Metropolitan Airports, LaGuardia Airport and John F Kennedy International Airport, both immediately adjacent to the water. On the left side, over New Jersey, notice the location of the General Aviation airport, Teterboro Airport, and to its south, Meadowlands Stadium. Above these points and extending to Newark Airport is the general path of that RNAV approach to Newark Runway 29, mentioned earlier, passing overhead of the Passaic River and the Hackensack Rivers of northern New Jersey, and New Jersey’s Meadowlands, salt-water swampy areas which contain plentiful water, marshes, and reeds.
PAPI (PRECISION APPROACH PATH INDICATOR) LIGHTS
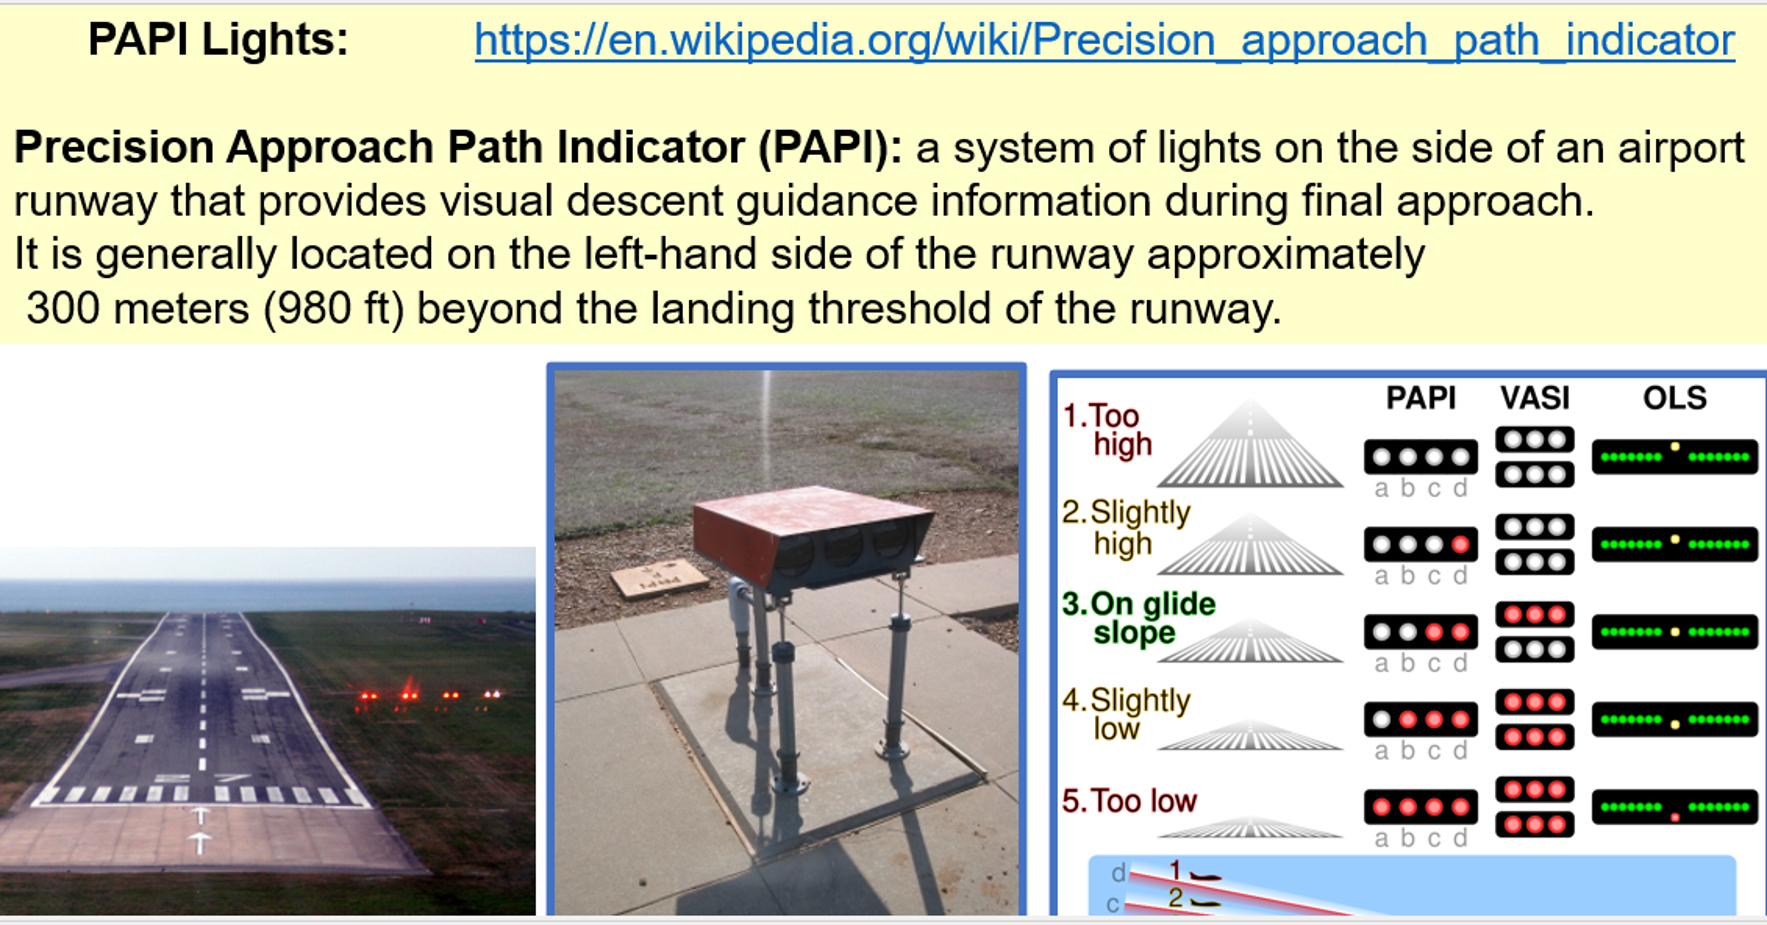
The Precision Approach Path Indicator (PAPI) is a system of lights on the side of an airport runway that provides, weather permitting, visual descent guidance information during final approach.
Figure 4 below contains a diagram showing a series of PAPI lights installed alongside a runway, another image of a single PAPI light transmitter, and, on the right, PAPI, VASI (Variable Approach Slope Indicator) and OLS, (Optical Lighting System) light-based systems. These visual aids positioned along an aircraft runway can help guide a pilot flying a “non-precision,” (not guided by continuous radio contact with an Air Traffic Controller) “visual” final approach down the nominal 3-degree final approach slope to the Runway Touchdown Point.
RNAV APPROACH TO RUNWAY 29 AT NEWARK
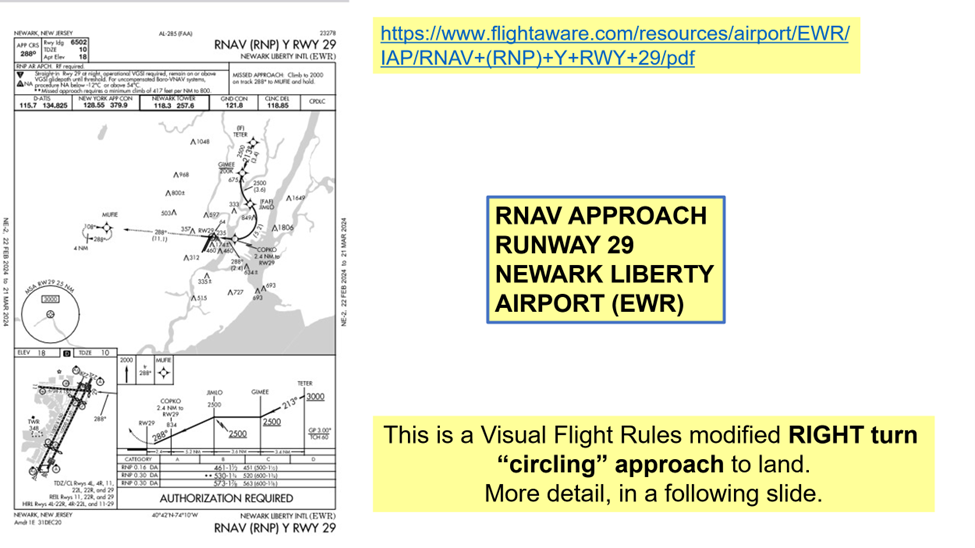
Figure 5 below shows the published approach plate for the RNAV approach to Runway 29 at Newark Liberty Airport. The top part is the map portion, showing the trace across the ground to be flown by aircraft on that approach, while the bottom part shows the descent steps to be flown by the aircraft during that approach. During the approach to Runway 29, the aircraft crosses point JIMLO at, but not below 2500 Ft MSL, which is the Final Approach Fix (FAF) for the RNAV approach, 7.6 miles from the touchdown point. The desired touchdown point is 1000 ft beyond the east end of Runway 29.
Appropriate figures for the last 2-1/2 minutes of Flight 169’s approach are: airspeed decreasing, from 180 kt (nautical miles/hour), or almost 3.5 miles/min, to about 140 kt or 2.7 miles/min and a descent rate averaging ~1000 ft/minute for those last 2500 ft.
ADS-B AND ADSB-EXCHANGE
Automatic Dependent Surveillance–Broadcast (ADS-B) is an aviation surveillance technology and form of “electronic conspicuity” in which an aircraft determines its position via satellite navigation or other sensors and, periodically and frequently, broadcasts by “ADS-B Out” its position and other related data, enabling that aircraft to be tracked. Commercial and private aircraft, some military aircraft, Air Traffic Control facilities and others use ADS-B. The information can be received by ground-based systems using “ADS-B In”, including Air Traffic Control. ADS-B does not require an interrogation signal from the ground or from other aircraft to activate its transmissions, such as with transponders. ADS-B In can also receive point-to-point by other nearby ADS-B-equipped aircraft to provide traffic situational awareness and support self- separation.
ADSB-EXCHANGE is a digital service enabling the ability to interrogate, plot, map, display in tabular form, and use other information regarding ADS-B-equipped aircraft for any number of data products. Examples of map-based and tabular display products from ADS-B Exchange, for United Flight 169 on 3 May 2026 are shown in the two following graphics, Figure 6 and Figure 7.
PLOTTED GRAPHICS OF UNITED FLIGHT 169 RNAV APPROACH TO NEWARK LIBERTY AIRPORT 3 MAY 2026.
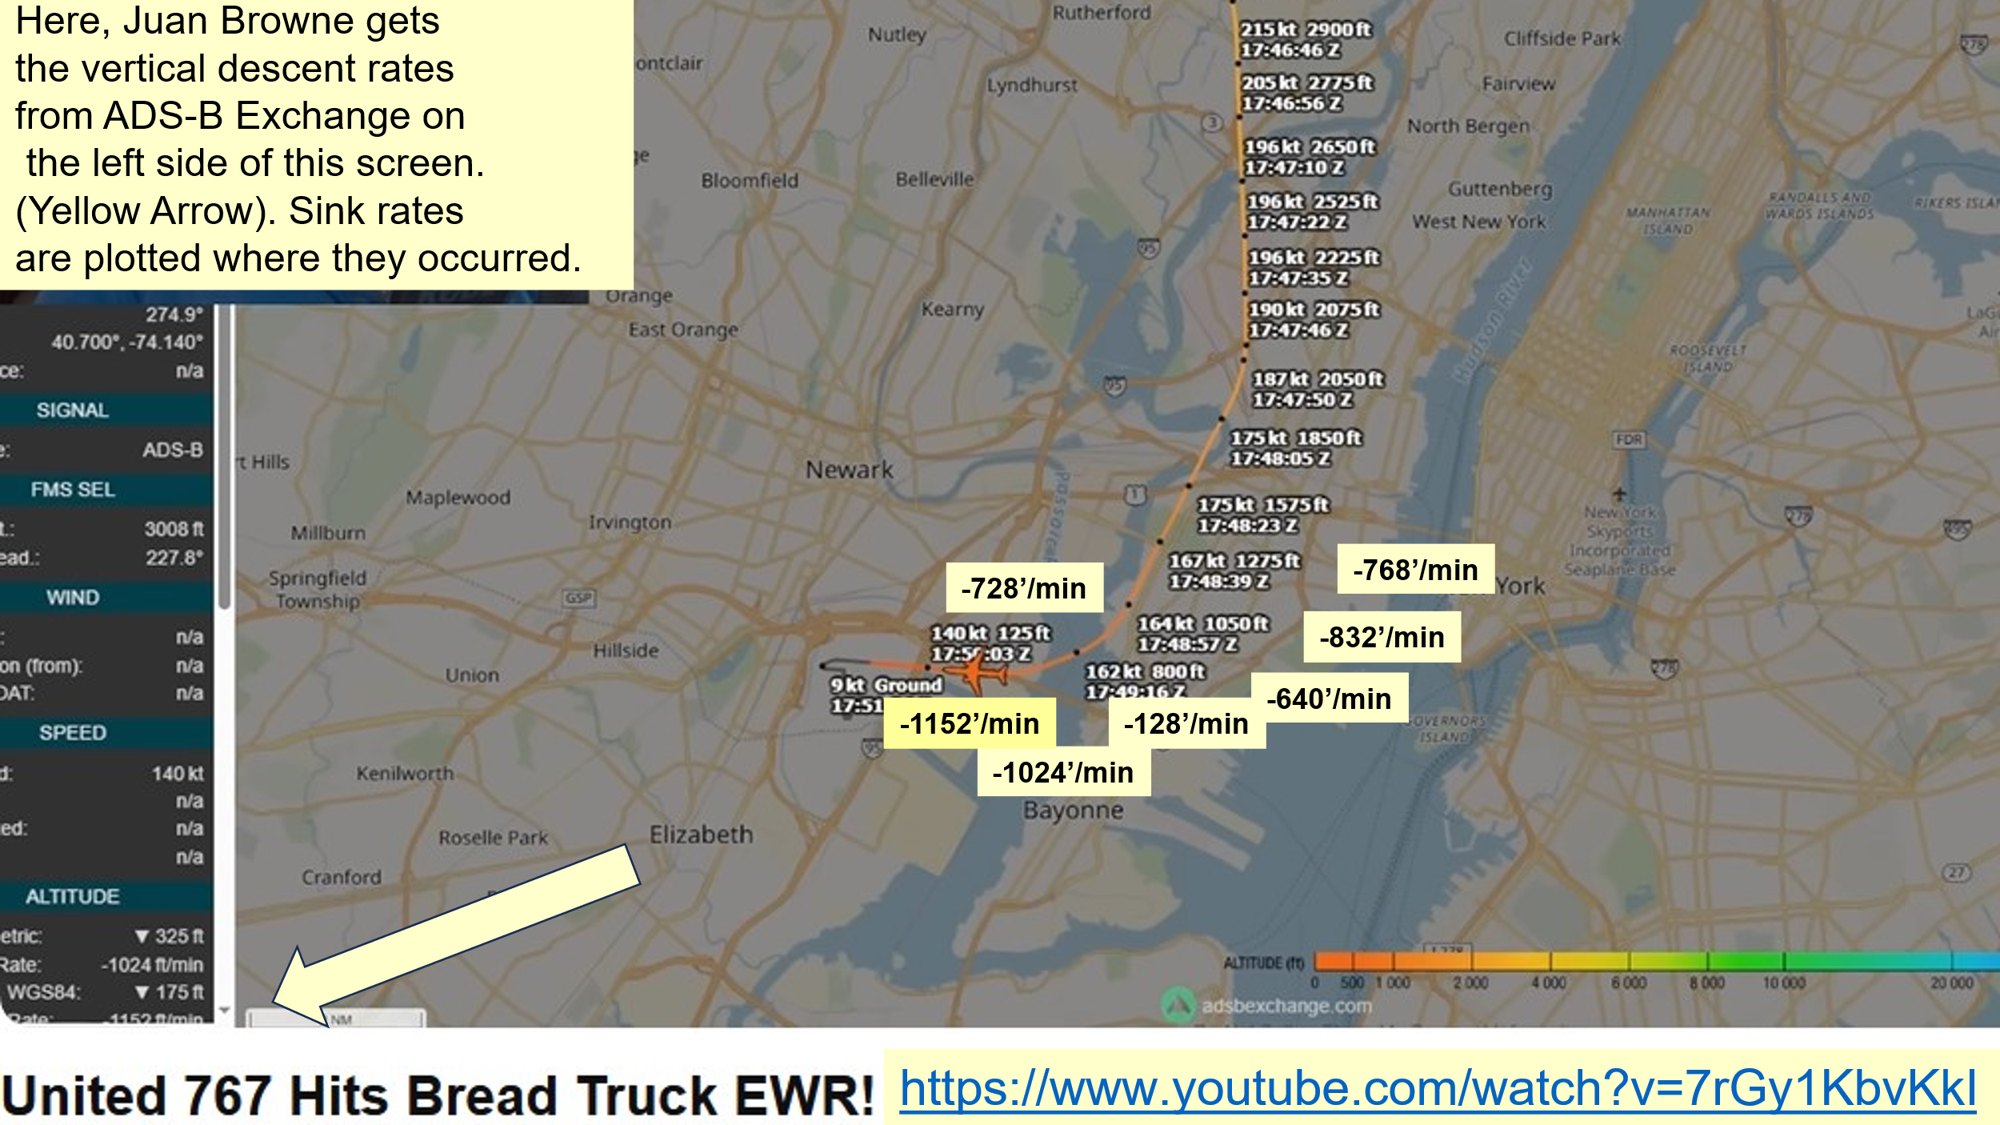
Experienced pilot Juan Browne, on this video, described the descent of United 169 in a series of screenshots he obtained from ADS-B Exchange. Figure 6 below, taken from that video, shows the map display from ADS-B Exchange and the track of United 169 during the descent, starting between Teterboro Airport and Meadowlands Stadium. The top or first point plotted was at 17:46:46Z, or Zulu time, which is Coordinated Universal Time, the time base used in aircraft, spacecraft and other operational situations. I assume each ADS-B broadcast location for United Flight 169 is denoted by a separate black dot on the orange trace. At the first, or top, time plotted on this display, Flight 169 was at 2900 Ft, and the aircraft speed was 215 knots.
On the left side of Figure 6 there is a readout of United 169’s ADS-B broadcast in a tabular display.
I looked up the location of the ADSB antenna on a B767-400 ER, it is on the centerline of the bottom of the fuselage, ~60 ft above the surface when the wheels are on the ground. So, for the last airborne point plotted in Figure 5, 17:50:03Z, 140 knots and 125 ft altitude, the landing gear would be about <125 ft-60>ft, or ~65 ft above the New Jersey Turnpike.
At this point it is useful to also remember that when a B767-400 ER is sitting on the runway, the ADS-B system aboard the aircraft shows its altitude to be about 60 ft.
During Juan Browne’s video, he read off the rate of descent of Flight 169 from the ADS- B tabular display on the left side of the screenshot in the lower left corner, near the point of the large yellow arrow. In this graphic, the tabular display showed Flight 169 descending 1152 ft per minute, nearing the Turnpike, 175 ft altitude. The approach plate in Figure 5 says the elevation of the touchdown point is 10 ft MSL, while the highest point on the airfield is 18 ft MSL.
The sequence of yellow boxes contains the sequence of descent rates that Juan Browne reads off during his video at https://www.youtube.com/watch?v=7rGy1KbvKkI.
The black dot ahead of the orange aircraft icon apparently represents the location of Flight 169 and appears to show when flight 169 was very close to, above and just east the New Jersey Turnpike, at 17:50:03Z, it was flying at 140 knots and at 125 ft altitude, but its landing gear would be <125 ft-60ft> or 65 ft above ground level.
Here, Juan Browne gets the vertical descent rates from ADS-B Exchange on the left side of this screen. (Yellow Arrow). Sink rates are plotted where they occurred.
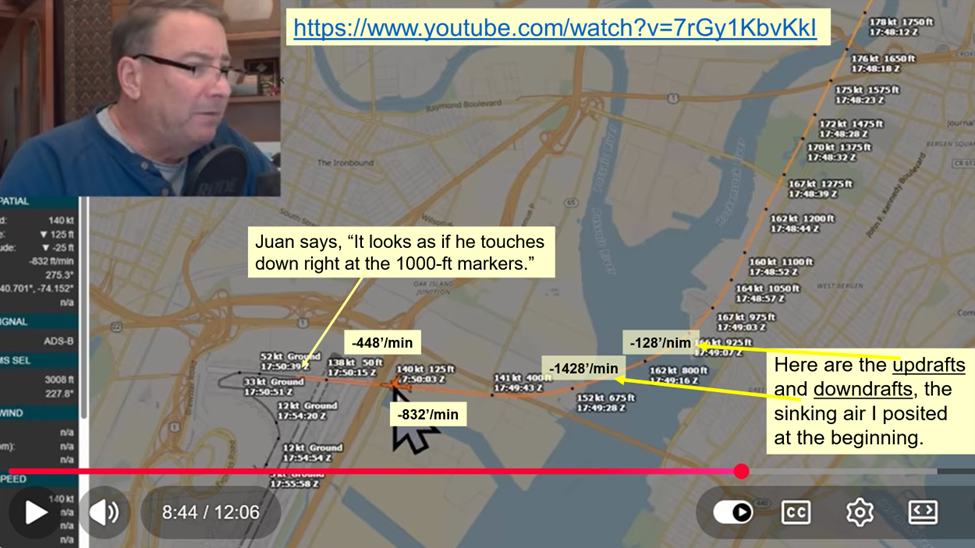
The next graphic, Figure 7, below, shows a closer-up view from Juan Browne’s video, with a slightly different data set, as Flight 169 approached Runway 29 on final approach, landing, and after roll-out. As in Figure 6 above, I have plotted the several rates of sink that Juan Browne called out as he was narrating the approach he saw on the ADS-B exchange data he was playing in the video. Notice as Flight 169 crosses over Upper Newark Bay, the changes in rates of sink, from -128 ft/minute to –1428 ft/minute, a difference of 1300 ft per minute! There is some chance these strong changes in vertical speeds are a result of the aircraft’s response to control input by the Pilot Flying. However, I think these changes in vertical speed more likely indicate the strong overturning of the air as the aircraft flew through thermals generated over land from the strong solar heating of the ground, and the resulting strong nearby sink.
Whether or not these changes in vertical speed are a result of crew input or the strength of up and down drafts will be ascertained by the NTSB’s investigation of the Flight Data Recorder and the Cockpit Voice Recorder.
To me, the most important piece of information up to now is obtained by examining the ADS-B data sequence as Flight 169 is flying to the South-Southwest, parallel to the Hackensack River, descending and slowing, and then turning towards Newark’s Runway 29.
At 17:48:12Z he was flying at 178kt, at 17:48:52Z his speed was down to 160 kt, but at 17:49:03Z his speed increased to 167kt, and his descent rate, nominally about -1000ft/min changed to -128 ft/min. A few seconds later, his descent rate dropped to -1428 Ft/min and at 17:49:28Z his airspeed had fallen to 152 kt.
This gain in airspeed when flying into lift, and a fall in airspeed when flying out of lift and into sink matches my experience when thermal soaring in strong lift and sink conditions, and I think these changes in airspeed, as well as the sudden change in descent rate by 1300 ft/min within a few seconds, are exactly the markers of the aircraft entering an airmass with strong sink. To me, these data tend to prove my “entered strong sink on final approach” contention at the beginning of this post as the reason why Flight 169 was so low on short final.
There is a final element of the ADS-B altitude data plotted in Figures 6 and 7 to mention here and the subsequently calculated rates of descent during this approach. I have used the data as it is displayed on the map and in the tabular display to the left side of each of these two figures. The times, locations, and airspeeds seem rock solid. I do not know the error bars or error budgets for the altitudes which are rounded to the nearest 5 feet. I did not find any discussion on ADS-B altitude or altitude error bars in the research I conducted for the presentation and this post.
SURFACE WEATHER OBSERVATIONS FROM NEWARK AIRPORT
I got the sequence of the 3 May 2026 surface weather observations, plotted in Figure 8, taken at Newark Liberty International Airport, from this video, a video made by Dan Millican in his Taking Off video series.
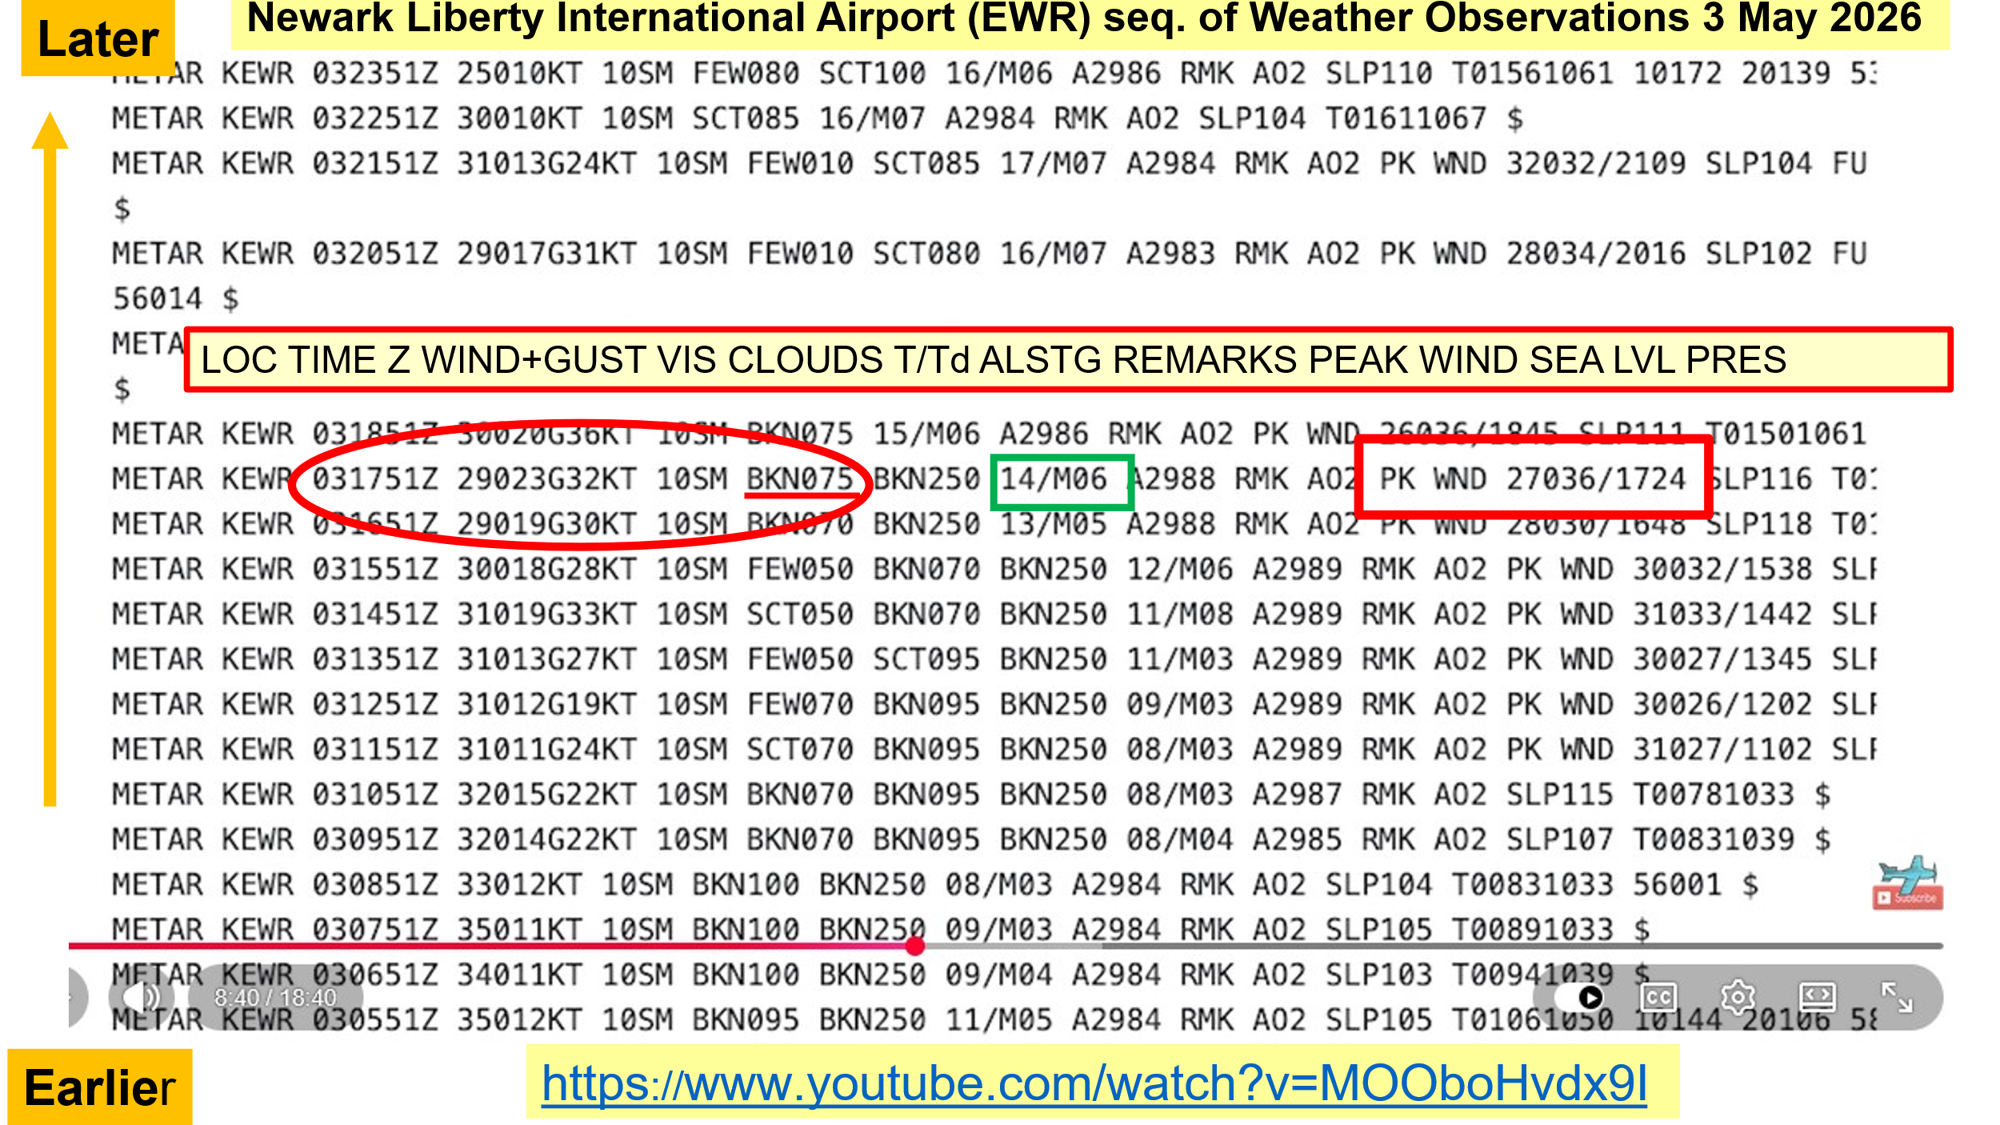
The pertinent observation, closest in time to Flight 169’s landing, is the one highlighted with the red oval.
LOC is the location of the observation, Newark Liberty International Airport, ICAO code KEWR.
The observation time, 031751Z means the observation time was 3 May 2026 at 1751Z.
The wind group, 29023G32, means the wind was from 290 Degrees Magnetic, or right down Runway 29 at 23 knots, gusting to 32 Knots. Well to the right on that line, in the red box, is the note that the peak wind over the past hour was from 270 magnetic at 36 knots, and that gust occurred at 1724Z.
The 10SM group means that there was no obstruction to visibility, such as snow or fog, so the prevailing visibility was reported at 10 statute miles.
In another life I supported the High Energy Laser Systems Test Facility at White Sands Missile Range, as Team Chief for measuring atmospheric effects on the lasers tested there, and just by using images from the color surveillance cameras in Figure 8 and Figure 9 below, and my flying experiences, I can tell that the surface visibility probably was at least 90 miles, perhaps even more, but there are no visibility markers, such as mountain peaks at distance, that could be used by weather observers at Newark Airport.
The cloud group part of the observation, “075BKN 250 BKN” says there was a Broken Cloud Ceiling layer of clouds at 7500 ft above the ground, with another broken cloud layer, cirrus clouds, at 25,000 ft above the ground.
The group 14/M06 means the surface Temperature was 14C and the Dewpoint Temperature was -6C. In English units this would be Temperature, 52F, Dewpoint Temperature, 21F.
The Altimeter Setting was 29.88 inches of mercury.
The sea level pressure group SLP116 means the sea level pressure was 1011.6 millibars.
There are several elements of this observation with which I disagree, some with which I disagree strongly. As we will see below, there were only scattered cumulus clouds that day; they even have their own name, “fair weather cumulus,” in Latin, cumulus humilus.
When there is strong surface heating of the surface by the sun, which clearly occurred this day, the height at which a buoyant “parcel” of air would reach saturation, given measured-at-the-surface Temperature of 14C and Dewpoint of -6C, was 8000 ft above the ground and is seen at https://casf.me/wp-content/uploads/2026/05/PDF A- Likely-Weather-Factor-in-the-3-May-2026-United-Flight-169-Accident-at- Newark_Saved-16-May-2026.pdf slide 49.
That graphic is a Skew-T Log P diagram, a thermodynamic diagram, sometimes called “graph paper for meteorologists.” One use of the “Skew-T” diagram is to calculate the “Lifting Condensation Level,” the height of the base of cumulus clouds for that day.
In this specific case, it is the height, at observation time, at which water vapor in that parcel of air, as measured at the surface, at temperature 14C and dew point of -6C, which, when lifted adiabatically, would cool to saturation, condense into droplets, and be shown by the appearance of the water droplets condensing from the water vapor in the air, at the cloud base.
I contend that the cloud observation should have been 8000 scattered (no cloud ceiling, clearly not 7500 broken) and clearly there was not a broken elevated cirrus cloud layer above, at 25,000 ft above ground level, as the METAR report states.
Figure 9 below is an image from a video from “Captain Steeeve” reporting on this accident and available on the internet at https://www.youtube.com/watch?v=IZE88BsKwqA. I used this video and screenshot in https://casf.me/wp-content/uploads/2026/05/PDF A-Likely-Weather-Factor-in-the-3- May-2026-United-Flight-169-Accident-at-Newark_Saved-16-May-2026.pdf where it is Slide 52. Now would be an excellent time to read the caption for this slide.
First, the clouds are fair weather cumulus and clearly are scattered with maybe 2/8ths or 3/8ths coverage. There is no cloud ceiling as would appear if there were 6/8ths or 7/8ths cloud coverage at that height above the ground. There are no cirrus clouds in the sky, even though the observation says “25,000 broken” another, much higher layer of cirrus cloud cover. The flat bottoms of many of the cumulus clouds indicate strong thermal lift. Just from looking at this sky and the cloud cover, it would be a good day for soaring in the thermals under those flat-bottom cumulus clouds. There are huge areas of blue sky, indicated by the orange arrows, which sailplane pilots call “Blue Holes.” More about Blue Holes later.
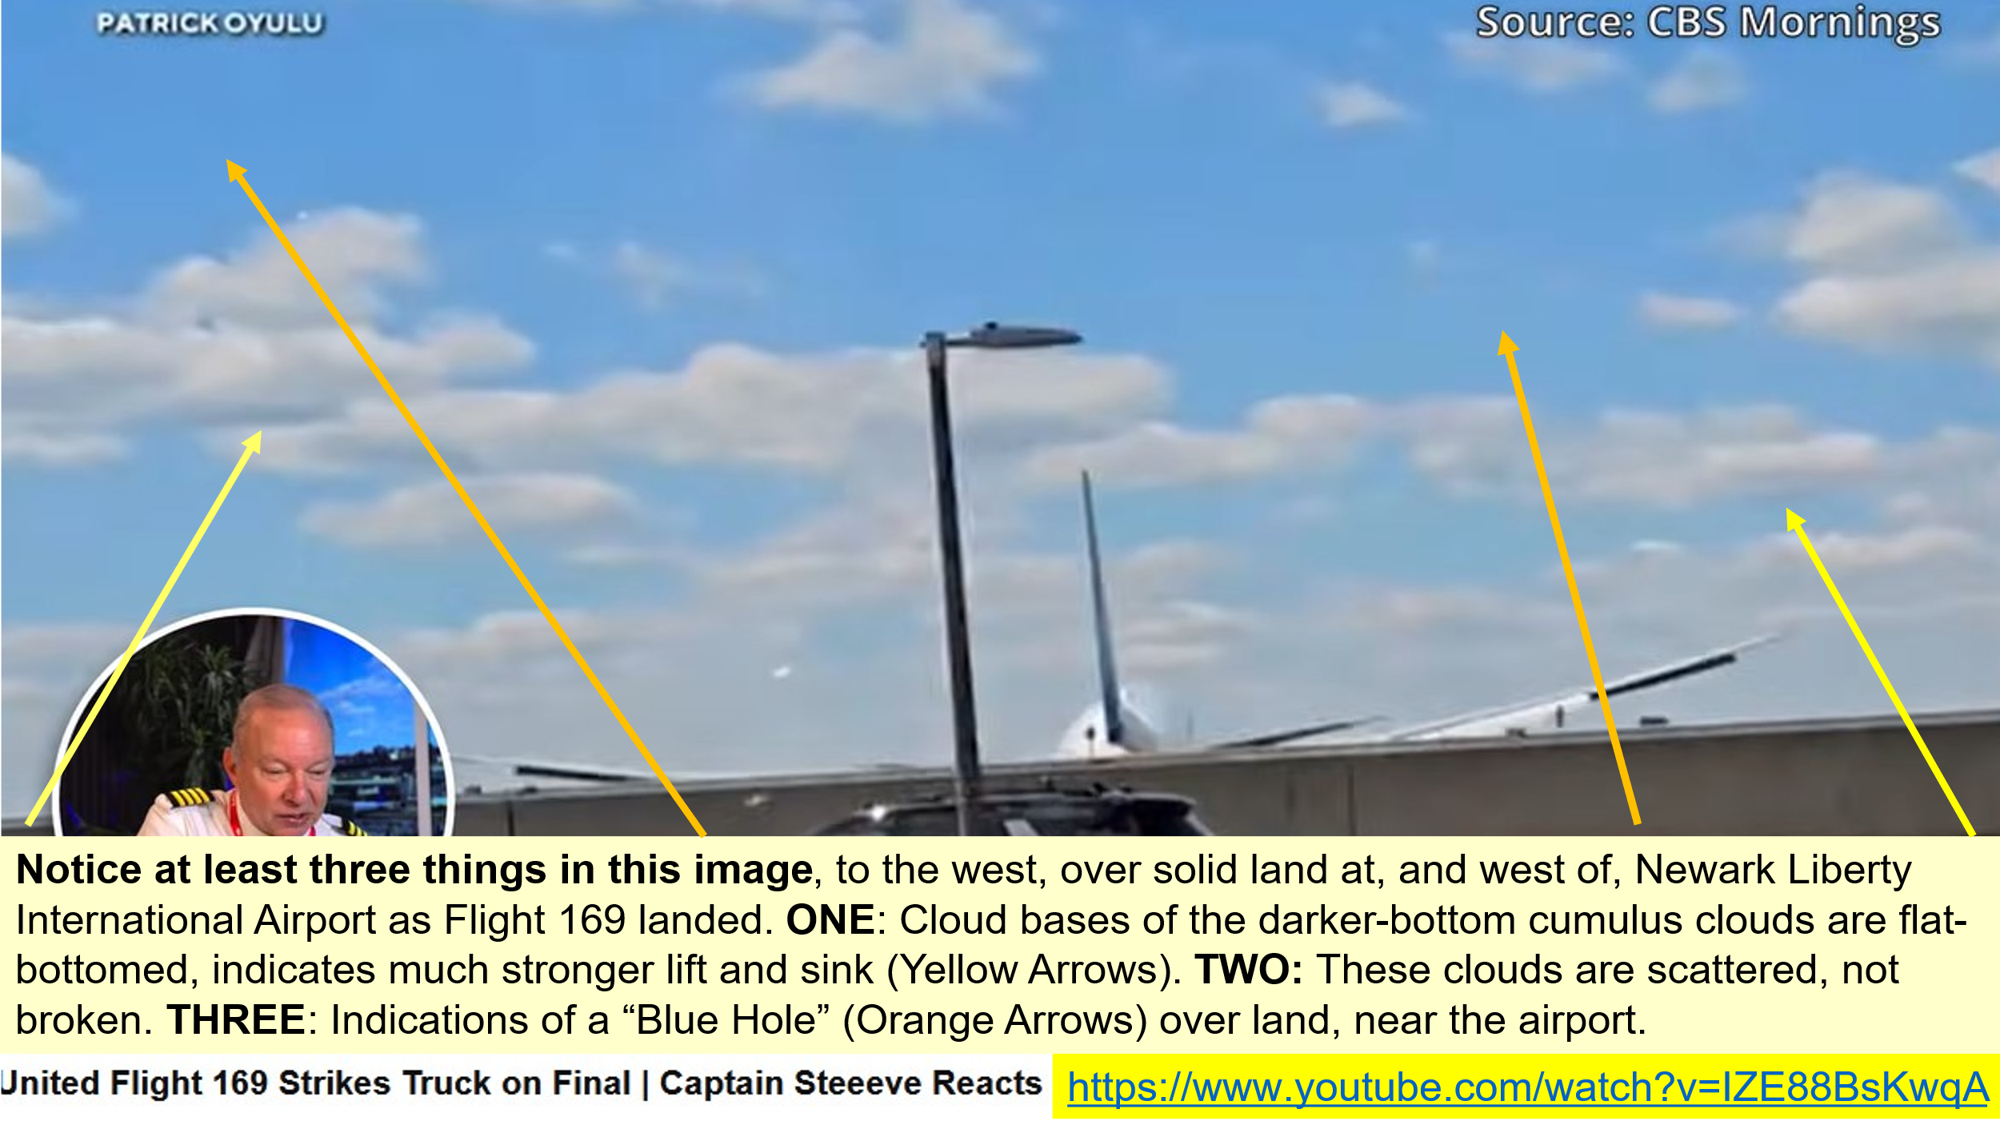
Since the cloud view in Figure 9 shows only one direction, to the west, as Flight 169 was landing on Runway 29, a view in another direction on the same day, about the same time, would strengthen the points made here.
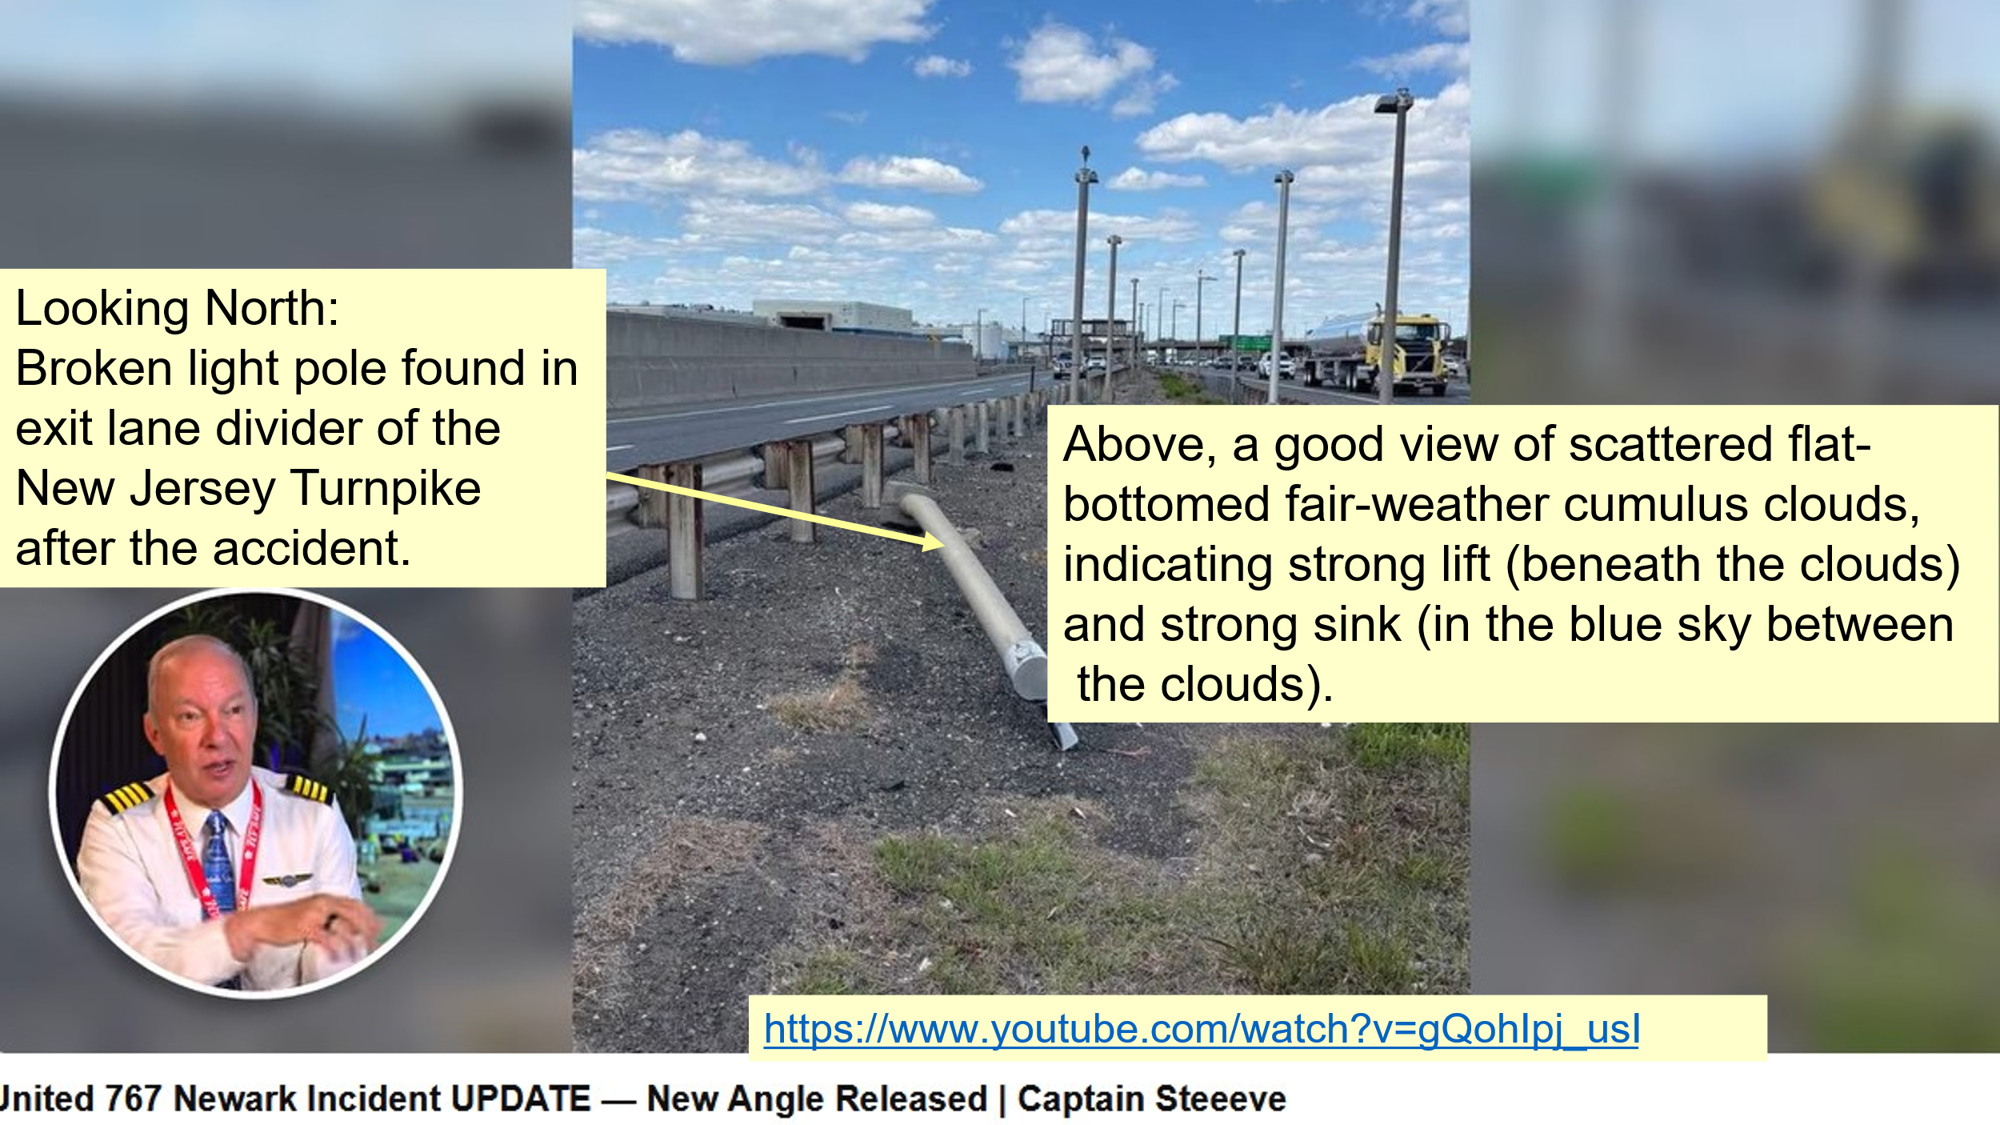
We have another such view; it is in Figure 10, below, a view to the north from the exit divider on the New Jersey Turnpike just under the final approach path of Newark’s Runway 29.
The main point of the screenshot, from the video, is to show the broken off light stanchion in the exit divider on the New Jersey Turnpike, the stanchion broken off by Flight 169 as it landed.
But for the purposes here, I want to emphasize the bright blue sky, the single layer of clouds, the fair-weather cumulus clouds at the 8000 ft Above Ground Level, and their extent, which was only scattered, maybe 2/8ths cloud coverage.
When the sky has a single layer of clouds, such as displayed in both Figure 9 and Figure 10, overhead there is plentiful blue sky. But as one looks from the zenith more towards the horizon, the foreshortening effect of looking at the sides of the clouds makes it appear that there is more cloud cover towards the horizon.
A better estimate of the cloud cover would be to understand that the darkest part of a cloud under these conditions is the cloud base. Especially in this image, Figure 10, the sides of the clouds are illuminated directly from the sun. The point here is that a better indication of cloud cover is to look only at the parts of the cloud having darker color and estimate cloud cover looking only at these darker shade elements, looking only at the cloud bases, not the brightly lit sides of clouds.
POSSIBLE BLUE HOLE OVER THE FINAL APPROACH ZONE
I mentioned a phenomenon known in flying, and especially the soaring communities as a Blue Hole. Here is my definition:
“Blue Hole: In flying, especially soaring, a Blue Hole is a location along an intended flight path where a field of cumulus clouds disappears, frequently an indicator of an air mass without convection, or without strong enough convection to enable soaring flight.”
Blue Holes are typically areas of strong sink. A Blue Hole might be caused by a previous day’s rainfall, where the surface is still wet and that surface has not warmed enough for cumulus to form, or, the nature of the surface might have changed, such as from dry, fallow land to cultivated and irrigated farmland.
Both Figure 9 and Figure 10 seem to show that rather than a cloud ceiling of cumulus clouds at 7500 ft, there was possibly a Blue Hole developing (Presentation Slides 58-65). This is another indication of widespread sinking air, some the strong sink that helped push United Flight 169 enough below the glidepath that it hit that light stanchion on the New Jersey Turnpike.
CONCLUSION
The explanation and reasoning here, using information readily available, demonstrates that there was likely a significant weather factor, that developed as United Flight 169 was landing at Newark Liberty International Airport on the afternoon of 3 May 2026. Just as the aircraft turned to the final approach heading, it entered an area of sink so strong that the aircraft descended below its intended flight path, striking a light stanchion and causing damage to vehicles below and damage to the fuselage of the aircraft.