“Climate Change means New York City’s flooding is ‘new normal,’ Governor says.”
Robert W. Endlich
An extract of this 30 Sep 2023 story by Reuters summarizes what we need to know about Gov. Hochul’s claim:
“Torrential downpours that caused flash flooding in New York City on Friday reflect a ‘new normal’ due to the effects of climate change, New York Governor Kathy Hochul warned on Saturday, as the city began drying out after one of its wettest days ever.”
“Almost eight inches of rain fell in some parts of the most populous U.S. city, enough to enable a sea lion at the Central Park Zoo to swim briefly out of the confines of her pool enclosure.”

My interpretation: When a politician mentions “climate change,” that politician means “Human-Caused, CO2-fueled Global Warming,” and the presumption that humans can therefore control the temperature of the earth and the level of the sea by controlling us, and our use of petroleum-based fuels.
But humans do not and cannot now change the temperature of earth, or the level of the sea.
So, why do I call this…
“Another BS Claim from another New York Politician?”
Because two years ago, I wrote about post-Hurricane Ida’s flooding rains in the New York City area, when then NYC Mayor Bill de Blasio complained about “poor weather projections” when, in fact, the National Weather Service provided 3 days warning of 10-14 inches of rain as Hurricane Ida and her remnants were forecast to bring very heavy rains to the NYC area.
In 2021 now former mayor de Blasio also whined,
“This kind of radical change in weather is beyond the understanding, beyond the reach of our typical measuring tools. Things are happening that our projections can’t track with accuracy or consistency, which means we have to assume the worst in a way we never had before.”
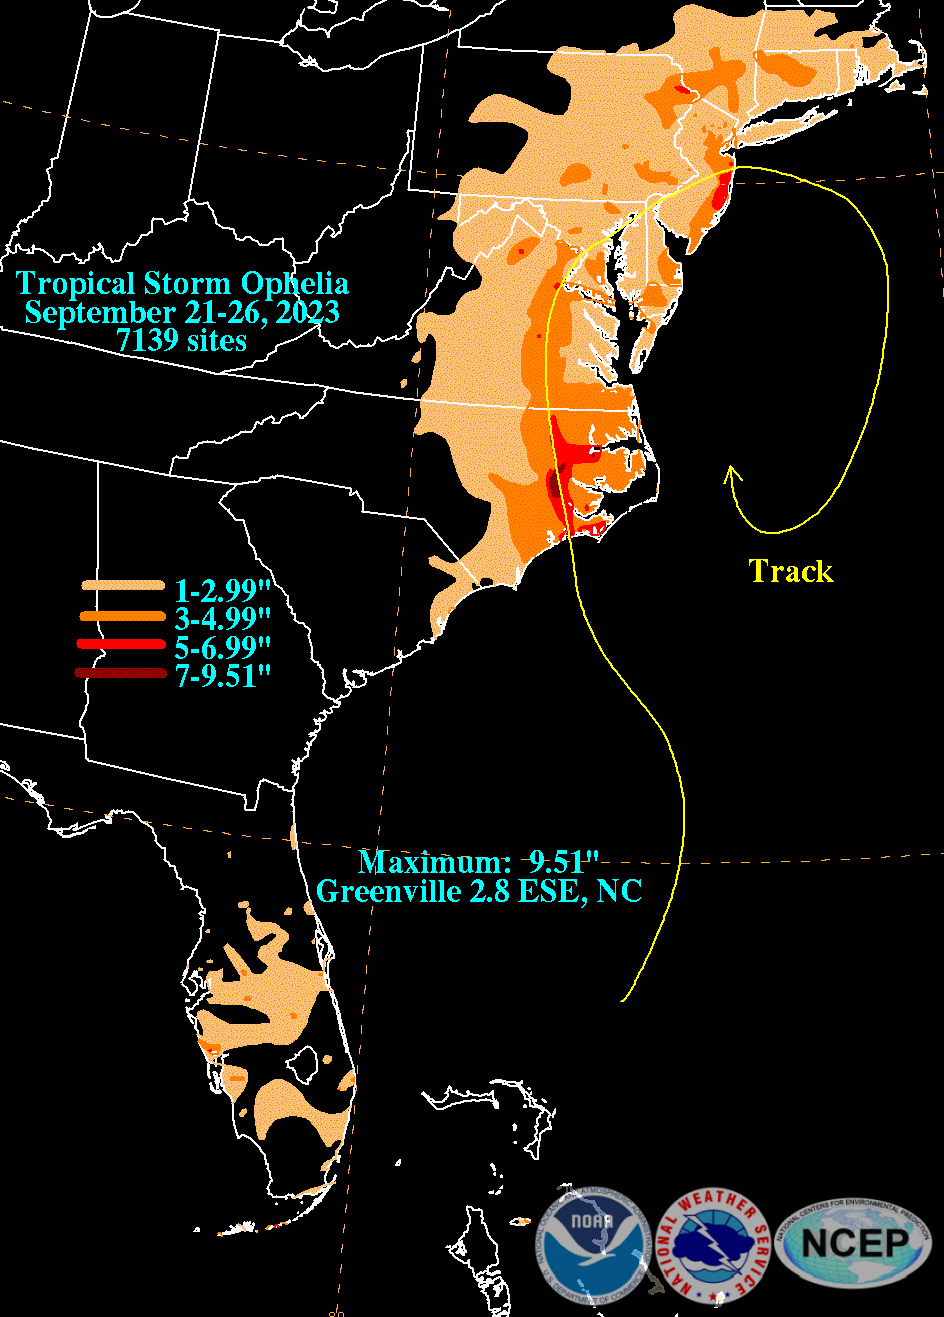
Yes, there recently was heavy rainfall accompanied by local flooding in the New York City area, on 29 September 2023. This was not especially new news for residents of the “Tri-State Area” of New York, New Jersey, and Connecticut, since the weekend before, Tropical Storm Ophelia had doused much of the area with extensive rainfall.
Ophelia and her remnants moved in a loop pattern, coming onshore in coastal North Carolina 22 September, then moving into New Jersey by 23 September, and then moving offshore, following the yellow track shown in Figure 1 below.
The summary below is a useful description:
“<By 25 October>, its remnant circulation moved eastward off the New Jersey coast, as rains from the system swept northward into New England. The remnants of Ophelia were absorbed by another offshore low-pressure area a few days later. This <new> Low Pressure ended up causing severe floods in New York City on the Evening of September 29.”

I looked up background materials about Kathy Hochul; she received a BA in Political Science from Syracuse in 1980, and a JD from Catholic University. I could not find out what “hard Science” requirements, if any, were required for her Bachelor’s, but it is evident she is now all politician, and whatever ability she might have had to look up readily available weather and climate statistics for New York seemingly was lost decades ago.
There is no truth in her claims when we look these records up, as we will soon see.
WHAT THE DATA TELL US
Here are some data to make this point:
At the end of September every year water temperatures just offshore New York City, at Sandy Hook, NJ, are almost the highest of the year.
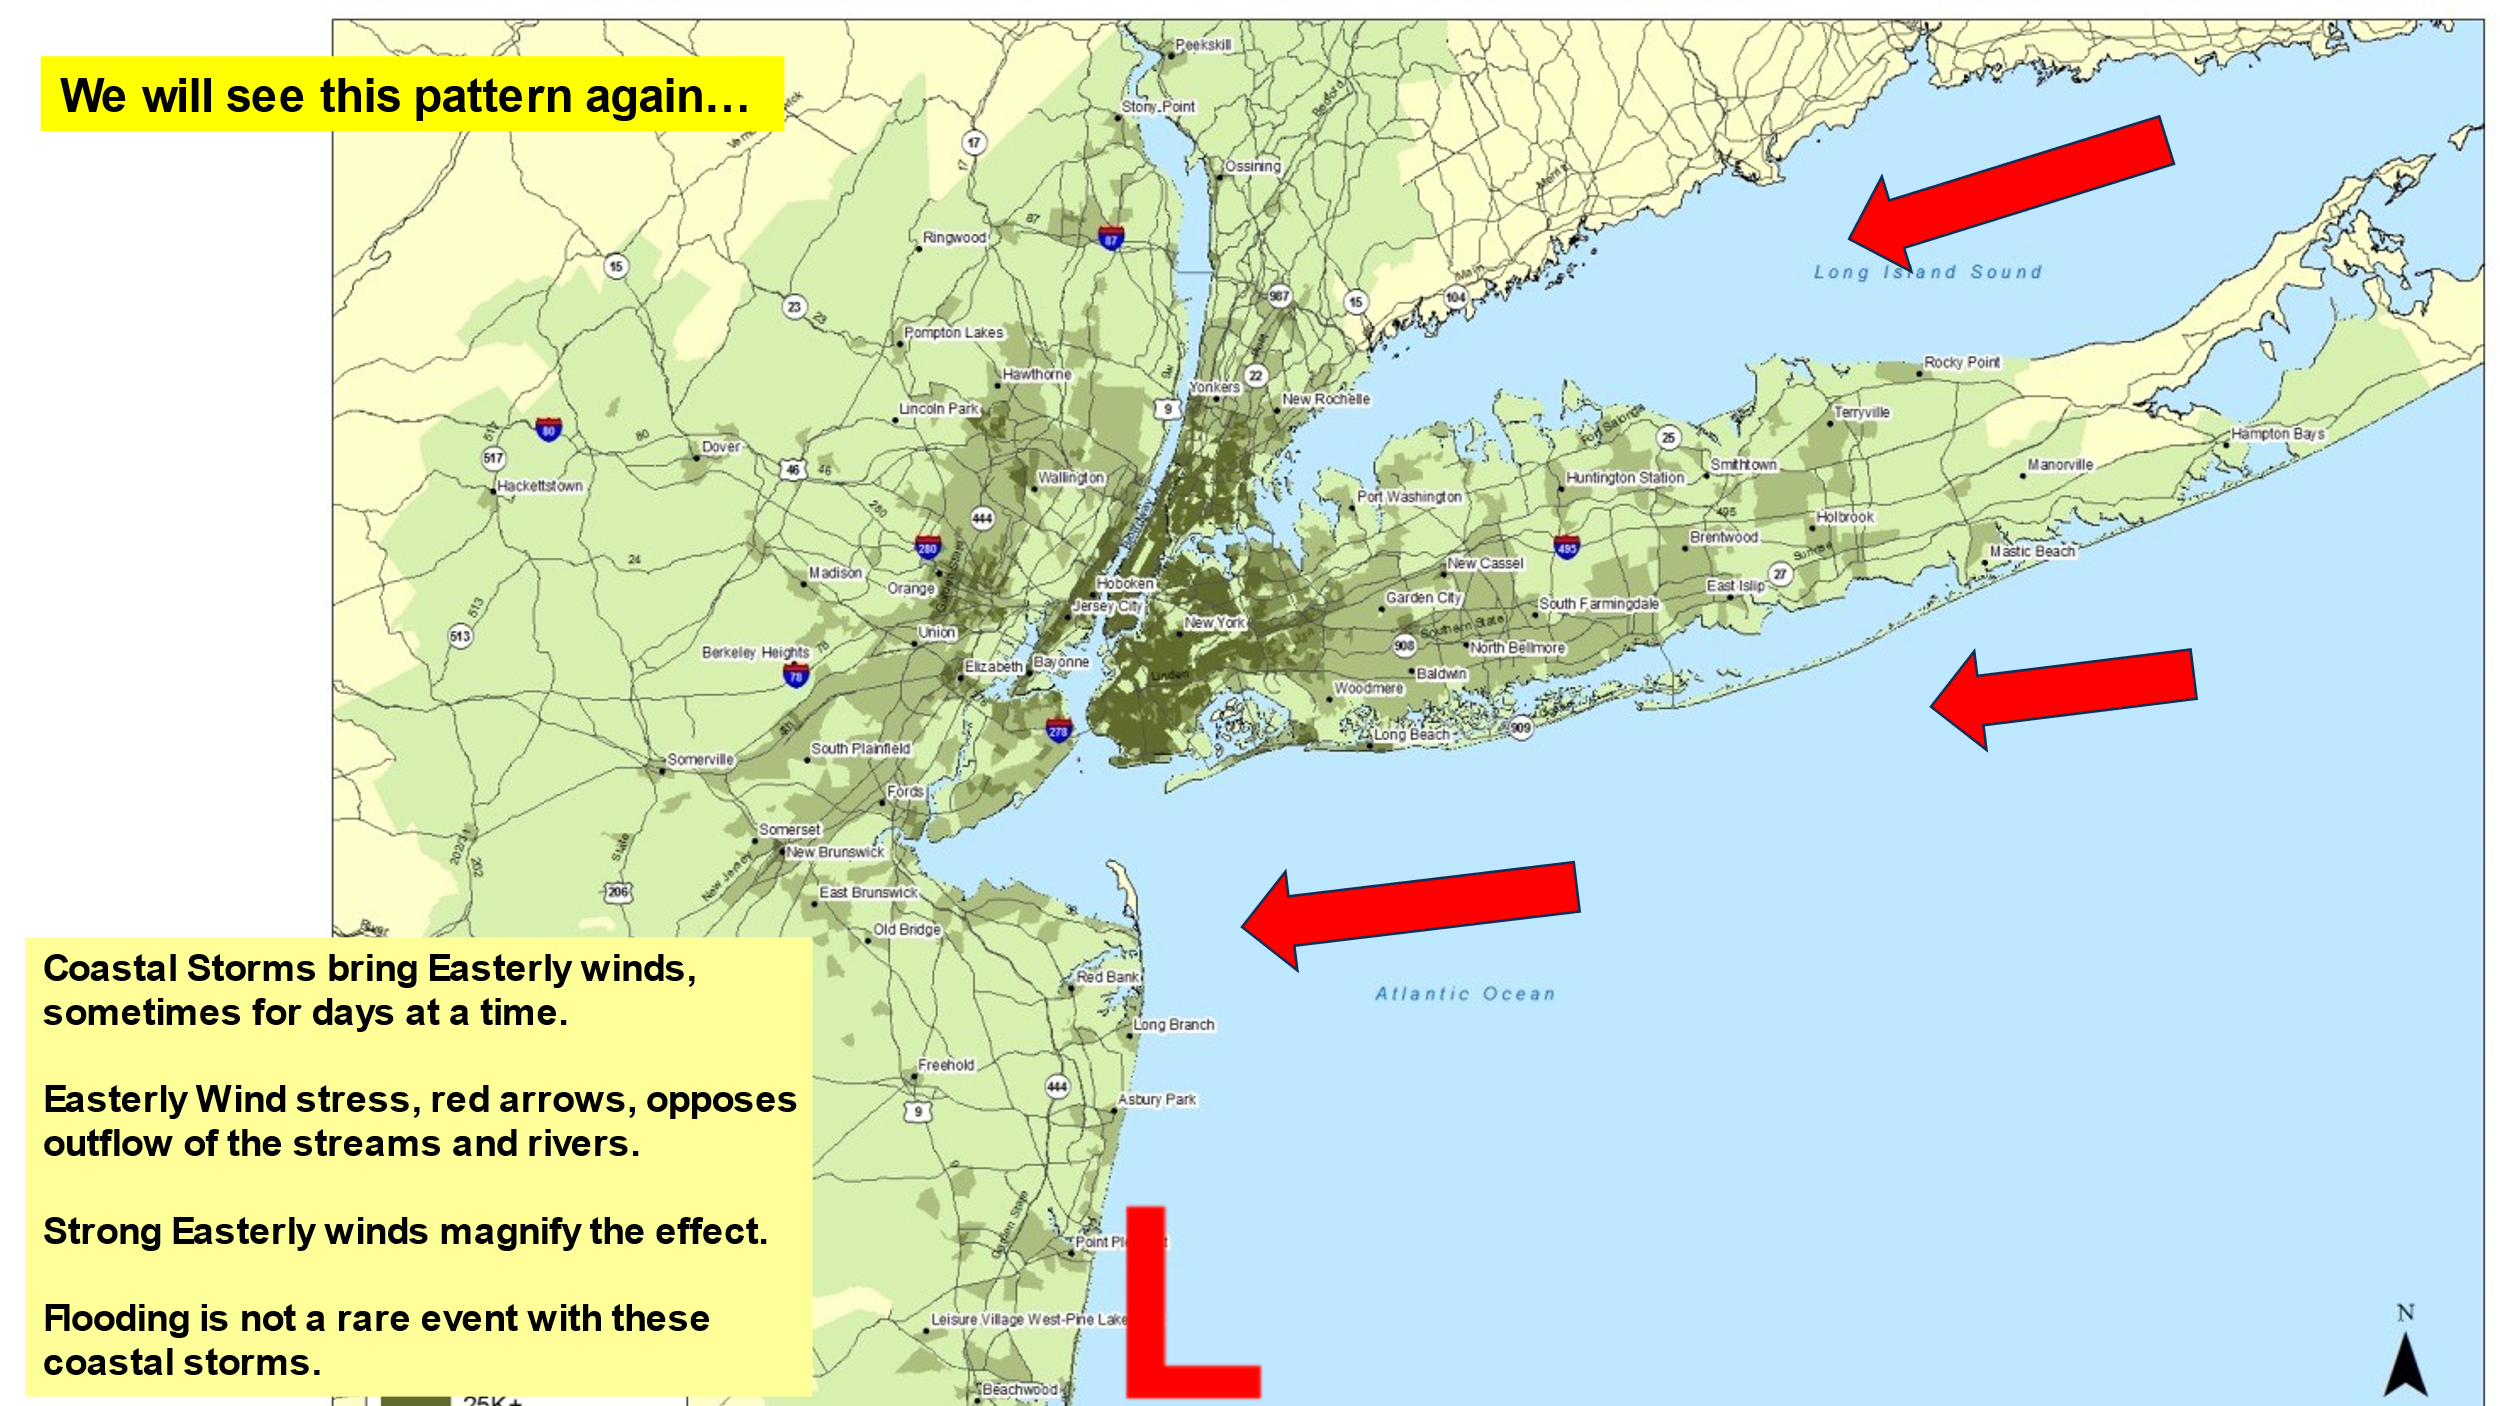
The shape of New York Bay enhances the potential for flooding when coastal storms move up the Eastern Seaboard of the United States, because strong easterly winds on the north side of the low-pressure areas retard the runoff from New York’s Hudson River and New Jersey’s Raritan River. This effect is magnified because of the shapes of the Hudson River, New Jersey, Long Island and Long Island Sound.

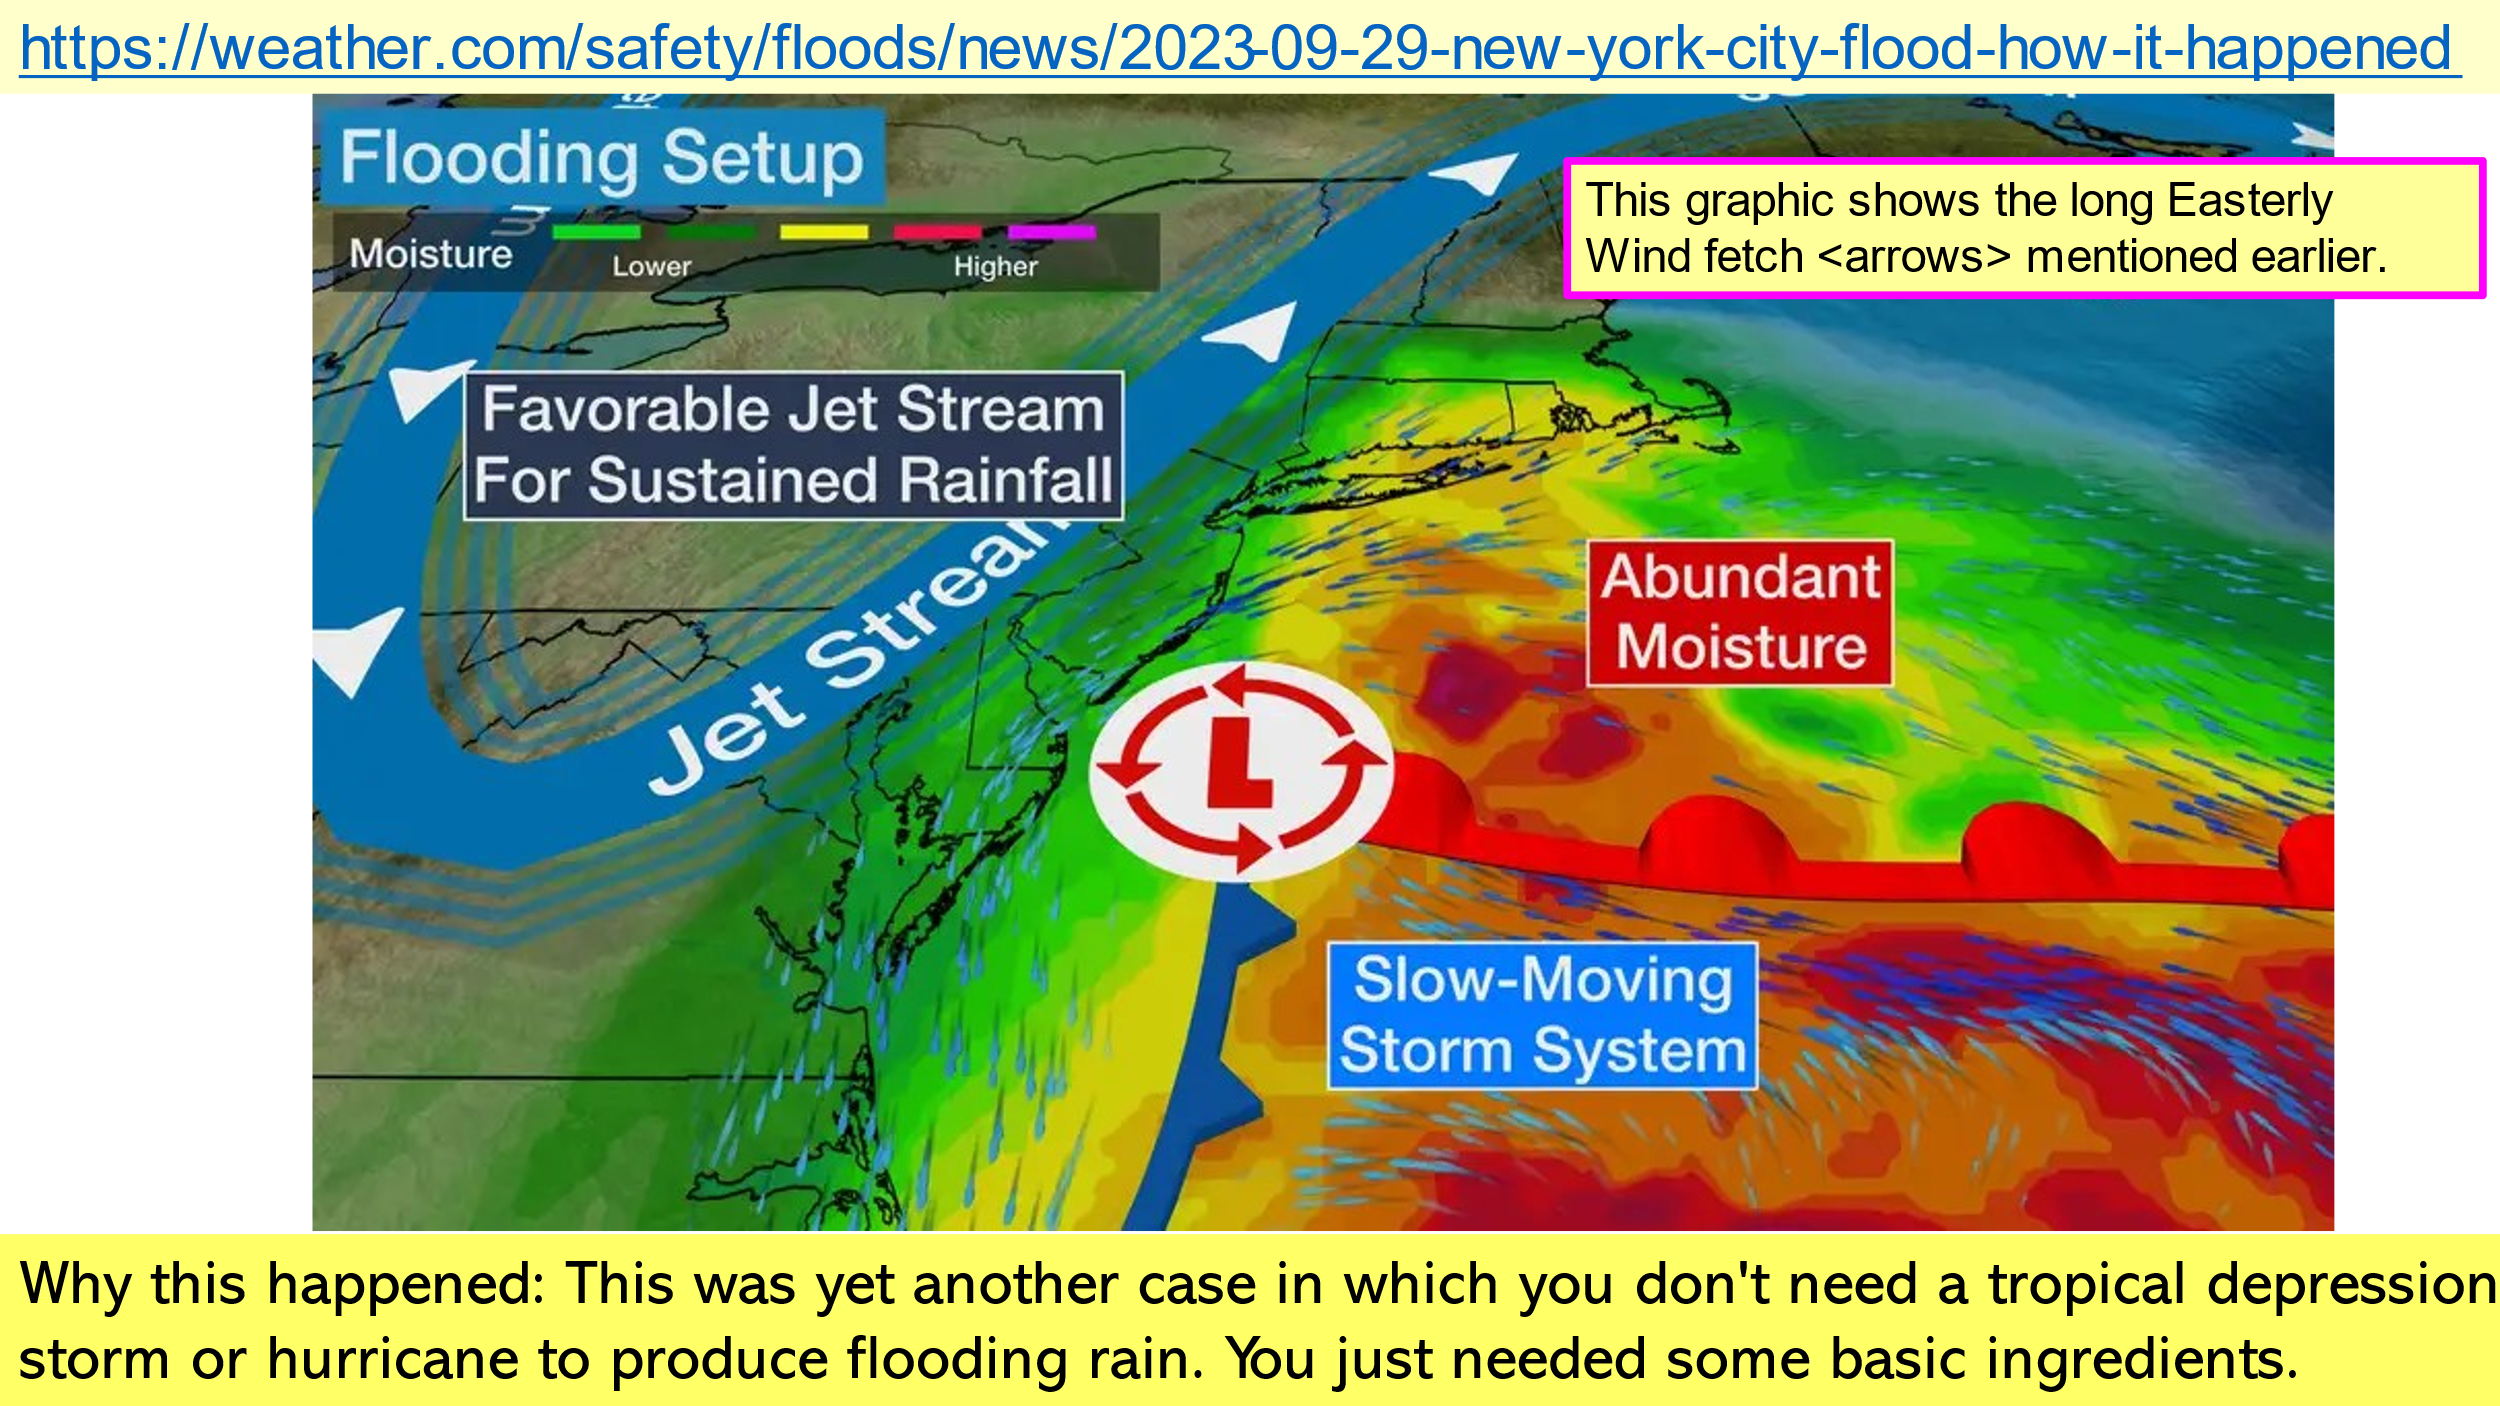
The Weather Channel’s story and graphics showed the set-up for the 29 September 2023 storm system, emphasizing that extraordinary elements need not be in place for flooding rain events to occur. As summer slowly changes to fall, traveling storm systems in the westerlies tend to move slowly, giving the NYC area sometimes days of easterly winds. With their long fetch, easterly winds have time to pile extra water against the coast and adjacent ocean surface.

NYC’s URBAN GEOGRAPHY
The urban geography of this part of the country is telling. The Urban Heat Island effect and impervious terrain play important roles in this story. The frictional effects of skyscrapers impede the easterly winds, increasing local low-level convergence, which in turn forces more of the saturated air aloft, causing heavier rainfall in the Metro Area.
While President Biden claims 1.5C of warming is a crisis, Las Cruces, NM, with a population around 100,000, already has at least 4F or 2.2 C warmer urban core than the countryside. Our measurements show this.
New York City is the largest metro area in the USA. Climate Central, an alarmist group, points out that often NYC is 20F or over 11C warmer than the rural surroundings. The EPA reports that on hot sunny days, roofs and pavements in cities can get to 90F (almost 50C) hotter than the air above them.
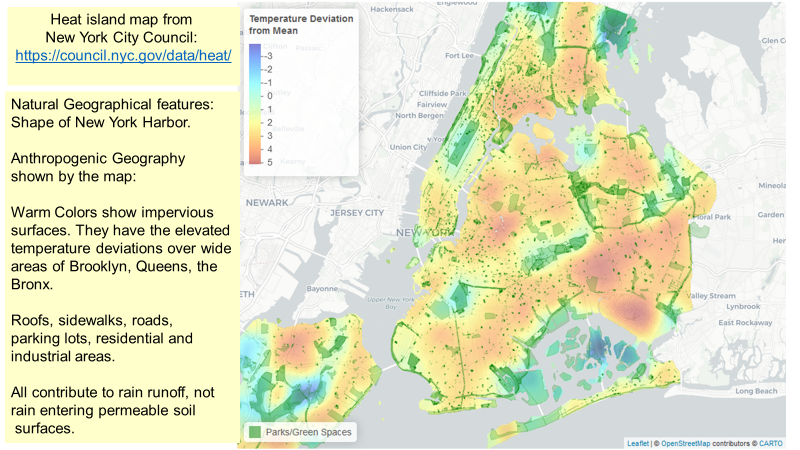
The NYC Metro area lacks the ability of the land to absorb much rainfall because of the preponderance of roofs, sidewalks, roads, parking lots, residential and industrial areas. This situation, demonstrated below by the graphic from the New York City Council, is shown in Figure 3, below, a graphic I used in the previous post two years ago.

MANY RAINFALL RECORDS TELL GOV HOCHUL’S NON-STORY
In the presentation graphics I recounted at least 22 previous hurricanes, tropical storms, and remnants of tropical systems that affected New York City, Long Island, or southeastern New York State, some dating back into the 1800s and early 1900s.
Ryan Maue posted that this system, which gave New York’s Central Park Station the rainfall described here:
“Its official. Friday Sept 29, 2023, was the 9th wettest day in NYC (at Central Park) with 5.48” recorded from (nearly unprecedented) climate-fueled deluges.”
At face value, Maue’s post shows that the 29 Sep 2023 rain event was NOT an especially noteworthy event.
NOAA’s National Weather Service keeps rainfall records so that civil engineers can design structures which can withstand heavy rainfall events. To put the 29 September rain event in New York City in perspective, the 5.48 inches of rain at Central Park was about ONE EIGHTH the 43 inches of rainfall in twenty-four hours that occurred in Alvin, Texas, in 1979.
Put another way, the most recent rainfall record of this type is 1979, forty-four years ago. The next most recent rainfall event in the record is from 1960, sixty-three years ago. The notion that increasing <CO2> in the atmosphere is driving more heavy or extreme rainfall events is belied by the data.
The presentation graphics contains a rainfall chart of each year’s annual rainfall from England and Wales collected since 1766, compiled by the United Kingdom Met Office, and posted in “Not a Lot of People Know That,” a blog by Paul Homewood. The data show no discernable increase in annual England and Wales rainfall since 1766.
The best large-country-wide surface temperature data set is from the US’ Climate Reference Network, a system of 114 triple-redundant aspirated sensors based within the Continental United States from sites distant from any urban heat island effects. The data set shows that since the network was put into operation, there has been no significant warming despite the continuous increase of <CO2> since 2005.
Even NPR, clearly a climate alarmist member of the media, was forced to report,
“In the case of <the 29 Sept 2023> storm, nearby ocean temperatures were below normal and air temperatures weren’t too hot.”
A BRIEF FORAY INTO SOME RECENT HISTORY
The whining politicos, notably in New York State, complain about flooding rains and blame Human-Caused, CO2 fueled Global Warming as something beyond their local control. I showed two years ago, a story from 2014 that highlighted the lack of maintenance on water supply, storm drainage, and subway infrastructure that had gone on for years, and is still not being addressed by the political class.
Their memories are short. They do not understand that climate is dynamic, and that climate change always happens. Temperature traces NEVER flat-line.
It was not too long ago that global temperatures were falling, despite the rises in CO2. In the 1970s popular literature was full of the cooling, and the expectation then that cooling would continue.
Examples:
On 3 Dec 1973, TIME had on its cover “The Big Freeze.”
On 24 Jun 1974 TIME had a feature article, “Another Ice Age,” with a section,
“Since the 1940s the mean global temperature has dropped about 2.7° F.”
NEWSWEEK, 28 April 1975, “The Cooling World” with a section,
“A drop of half a degree in average ground Temperatures In Northern Hemisphere between 1945 and 1968.”
There are dozens more of these.
WITH ALL THIS INFORMATION, WHAT HAVE WE LEARNED?
Remnants of post-tropical storm Ophelia brought a heavy rain event to NYC on 29 Sep 2023. This event was only the NINTH heaviest 24-hour rainfall total for Central Park, NYC. This NYC rain event was only ONE EIGHTH the 1979 rainfall at Alvin, Texas, the US 24-hour rainfall record.
The physical geography of New York Harbor favors flooding. Urban geography, the buildings and skyscrapers, and the Urban Heat Island effect, all contributed. Offshore water is climatologically nearly the warmest of the year which brings more water vapor for rain and rain shower activity.
The Urban Terrain of NYC cannot handle ordinary heavy rain events; immediate runoff occurs.
Little improvement in storm drainage infrastructure has been constructed in NYC for the last century.
Political Leaders claim “climate crisis” yet offer little money and emphasis for maintenance of subway and drainage systems. Kathy Hochul blamed “Human-Caused CO2-fueled Global Warming” for a routine heavy rain event and the runoff which was sure to occur and in fact recur.
The Mainstream Media and Deep State operatives gladly jump on the Climate Narrative.
Careful examination of the facts disproves “The Narrative.” Critical thought, despite “university education” is rare. None of this is new and human increases in <CO2> are not the cause.
