
Robert W. Endlich
[Preface: This post’s topics (Coal, Oil, Gas, Fracking, Nuclear, “End of Oil” Energy Stories, unusual hydrocarbon deposits, and some estimates of Petroleum Reserves) are broad reaching; it is difficult to encapsulate all such subjects in an internet post of this type. This is my ‘best effort,’ within these obvious constraints.]
INTRODUCTION
This post provides comments on the history and current state of world energy and concerns stated by climate alarmists regarding global warming.

The climate alarmists’ concerns about our use of fossil fuels as the source of “human-caused, CO2-fueled, global warming” begin with the Industrial Revolution, in the 19th Century. when coal use became widespread. Our ’Friends’ at the National Resources Defense Council, the NRDC, in their article’s lead paragraph, Global Warming 101, come right out and say it:
“Since the Industrial Revolution, the global annual temperature has increased in total by a little more than 1 degree Celsius, or about 2 degrees Fahrenheit.”
This NRDC statement is written as if temperature never changed before the Industrial Revolution. In this statement either they are ignorant, they want you and me to be ignorant, or both.
But our post, The Top Dozen (or so) Graphic Global Warming Alarmist Ideas, https://casf.me/wp-content/uploads/2024/02/Top-Dozen-Graphics_updated.pdf slides 27 and 28, show F. C. Ljungqvist’s temperature time series, annotated by Dr Roy Spencer, for the past 2000 years. Clearly, temperature never flatlines, and there is a quasi-millennial periodicity in global temperatures displayed in this temperature time series. The depth of the Little Ice Age was 1690 AD, so beginnings of the Modern Warm Period were in 1690 AD, over a century before and, in any event, well before any possible causation by the beginning of the Industrial Revolution, about 1800.
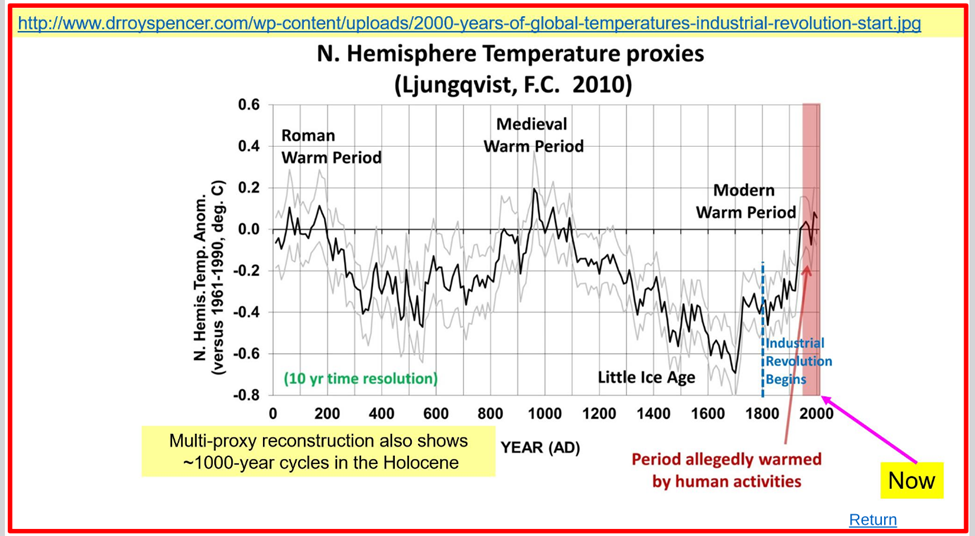
Further evidence that previous warm periods were as warm as, and even warmer than today, is obvious in Ljungqvist’s time series. The graphic shows the Roman Warm Period about as warm as today, and the Medieval Warm Period, even warmer than today.
Further, in our New Visitors’ topics, https://casf.me/wp-content/uploads/2024/02/Top-Dozen-Graphics_updated.pdf , slides 7, 8, 9, 10, and 11, you can see these five time series show the dynamic nature of temperature (and climate). Each show that temperature NEVER flat-lines, and those in the Mainstream Media who report as if climate never changed before humans started adding CO2 in the Industrial Revolution are either ignorant, fools, or both, take your pick.
BRIEF HISTORY OF HUMAN USE OF FIRE
This interesting video from The Netherlands shows demonstrations of how Neanderthals, perhaps 400,000 years ago, probably carried around fire-making gear and were able, after a little preparation, to make fire, more-or-less on demand. Their methodology involved using dried grass and tinder, (which grows on trees) and grinding manganese dioxide (the mineral Pyrolusite) into powder, then striking flint (a variety of quartz,) against Pyrite (frequently called ‘Fool’s Gold’) and using the ensuing spark to create fire. After a number of minutes, our ancestors could create, protect, and blow the nascent flame into usable fire, which would enable the use of fire for light, protection from marauding animals, cooking, and the heating of shelters, such as caves, important steps in the beginnings of civilization.
The above explains how human settlements might have first developed. The use of traditional biomass, dried grass and wood, became the fuels which enabled longer lives, development of villages, the division of work for common benefit, and the beginnings of language, culture, agriculture, and civilization.
INDUSTRIAL REVOLUTION
Fast-forward to the Industrial Revolution, especially in the early 1800s, which brought about increasing use of coal for factories, mills, and for transport. Regarding the latter, Robert Fulton, in partnership with Robert Livingston, one of the signers of the US Declaration of Independence, received a monopoly for steam-powered ships traveling from New York City to Albany, New York, on the Hudson River. At the time the Hudson was called the North River because of it’s northward trace from New York City to Albany, and so Fulton’s (and Livingston’s) steamship was called the SS North River. Sometimes the SS North River is incorrectly called the Clermont, because of the ship’s stops at Livingston’s estate, Clermont, on the shores of the Hudson. Fulton was able to improve on the earlier attempts at steamboat power by John Fitch, who used steam-powered mechanical oars and steam-powered adaptations of duck feet. While early detractors called Fulton’s first steamboat, “Fulton’s Folly,” not only was this first attempt successful, starting on 17 August 1807, but it was able to become profitable before winter ice forced the end of the first season. Additional boats were built, added to the “fleet,” and steamships began the success they have today.


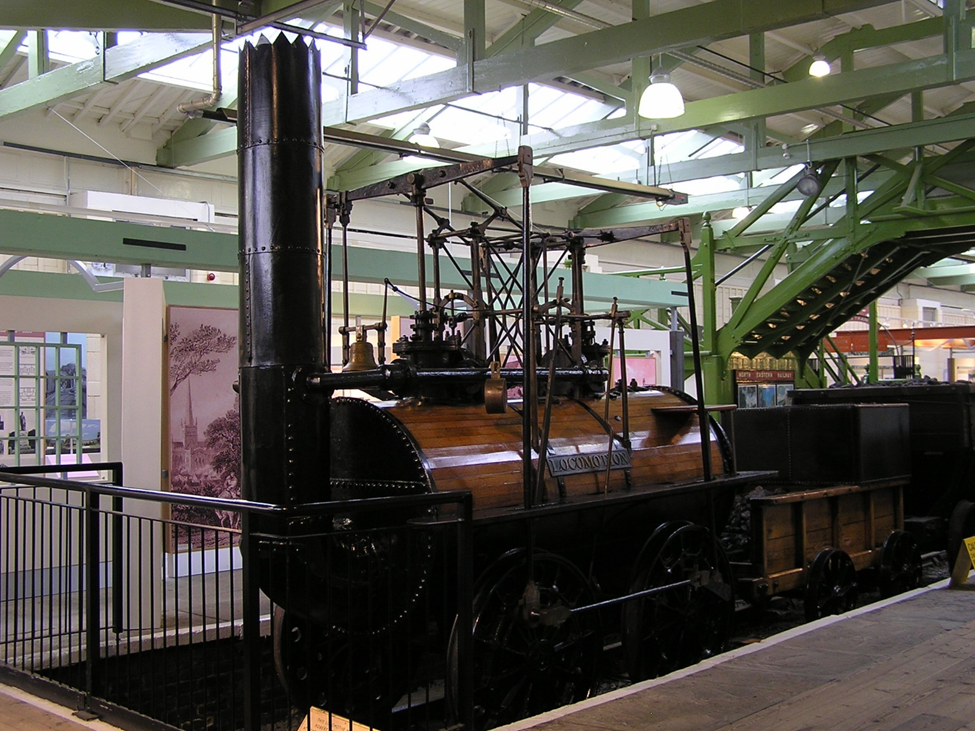
The steam engine for rail transport, using a coal-burning steam engine, was developed in England by George Stephenson and hauled its first train on a rail line on 27 September 1825.
In the United States, during the 1800s there was intense interest and a period of numerous developmental changes as the steam powered-locomotive power evolved. In Figure 4 below are two examples of these developmental changes. On the right, a pioneer steam engine from the early 1800s, while on the left a locomotive having cow catcher, headlight, pilot truck, and engineer’s cab, from the mid-1800s, both from the New York Central RR.
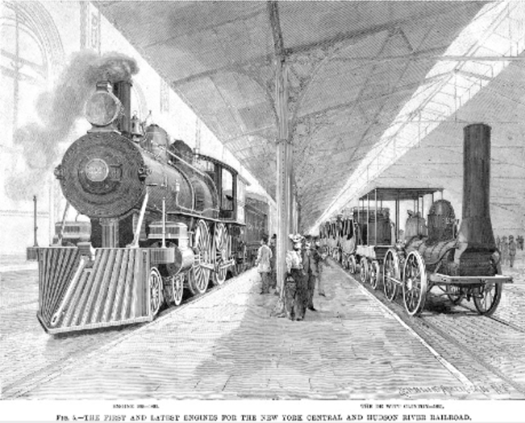
The paper from 1897 “The Evolution of the American Locomotive,” by Herbert T. Walker, Member of the National Museum Committee—England, illustrated with black and white line drawings, which shows pretty well what the title says, the evolution of the steam locomotive in the United States of America. It is the source of Figure 4 above and other illustrations.
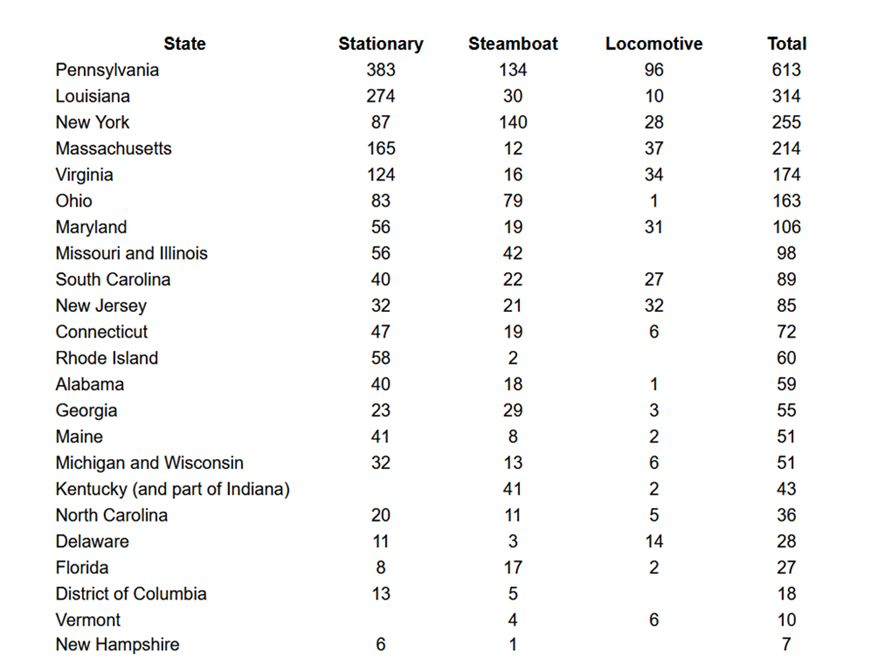
The data in Table 1, below shows a good estimate of the number of steam engines by type, Stationary, Steam Locomotive, and Steamboat, by state.
Tabular Estimate of 1838 numbers of steam engines by stratified by Type (Stationary, Rail Locomotive, and Steamboat) and by State, from this paper.
With this as preface, we are ready to consider the graphic below, Figure 5, which appeared in Climate Depot on 1 Sep 2021, and depicts as time series, the worldwide energy production by type, from 1860-2019.
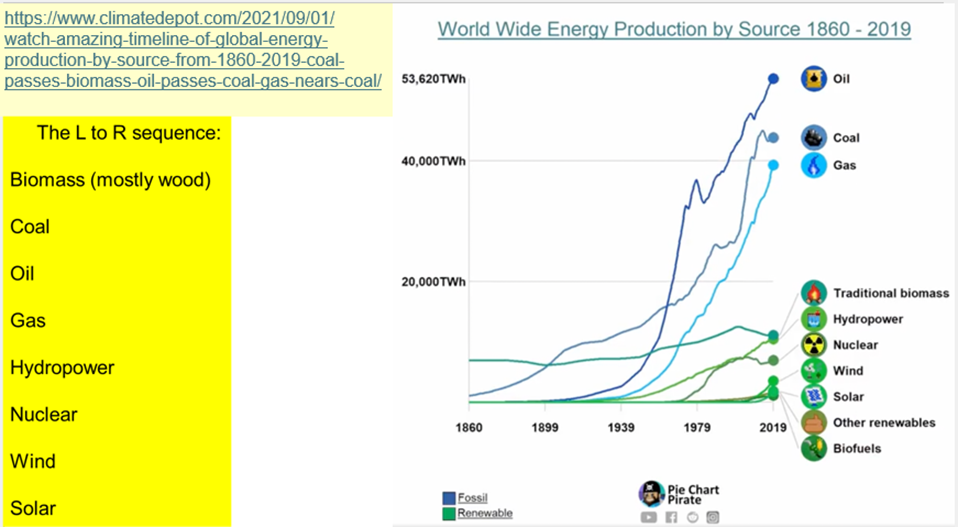
Among the important elements of this time series:
As the Industrial Revolution progressed, by 1899 the use of Coal for energy production surpassed wood and other traditional biomass and was the chief energy supplier until the post-WW2 economic boom, when Oil surpassed Coal, ca.1960.
As a lad growing up in New Jersey, with a dad who commuted from the Jersey Shore to Newark, daily, I remember the Steam Locomotives pulling the Pennsylvania RRs luxury commuter trains The Broker and The Banker. Our Cub Scout Pack 15 visited the Jersey Central Line’s steam locomotive maintenance yard in Red Bank, NJ, in maybe 1951. But 1951 was getting to be the end of the Age of Steam, and Diesel-Electrics were fast overcoming the steam engines, which is marked by Oil overtaking Coal, maybe 1955, in Figure 5.
Again, from my growing up in New Jersey, another element from Figure 5 emerges, the rise in gas use for home heating and cooking in the 1950s. I remember New Jersey Natural Gas digging and emplacing the gas lines through our neighborhoods, while their competitors were posting this message on billboards: “THINK before you take Gas!”
The Free Market on vivid display for a youngster in the 1950s.
A HISTORY OF COAL AND ITS CONTINUING USE TODAY
Coal is formed from deposition, burial, subsequent compression, and heating, especially in deep sedimentary rock sequences, of wood and leaf materials. A diagrammatic sequence of the creation of coal is depicted in Figure 6 below. Widespread and deep formation of the Coal Measures on earth occurred during the Carboniferous Period, from about 280-380 million years ago, https://casf.me/wp-content/uploads/2024/02/Top-Dozen-Graphics_updated.pdf Slide 18. In Europe they call it the Carboniferous, but in the USA it is broken down into the Pennsylvanian Period, 299-323 million years ago and Mississippian, 323-359 million years ago.
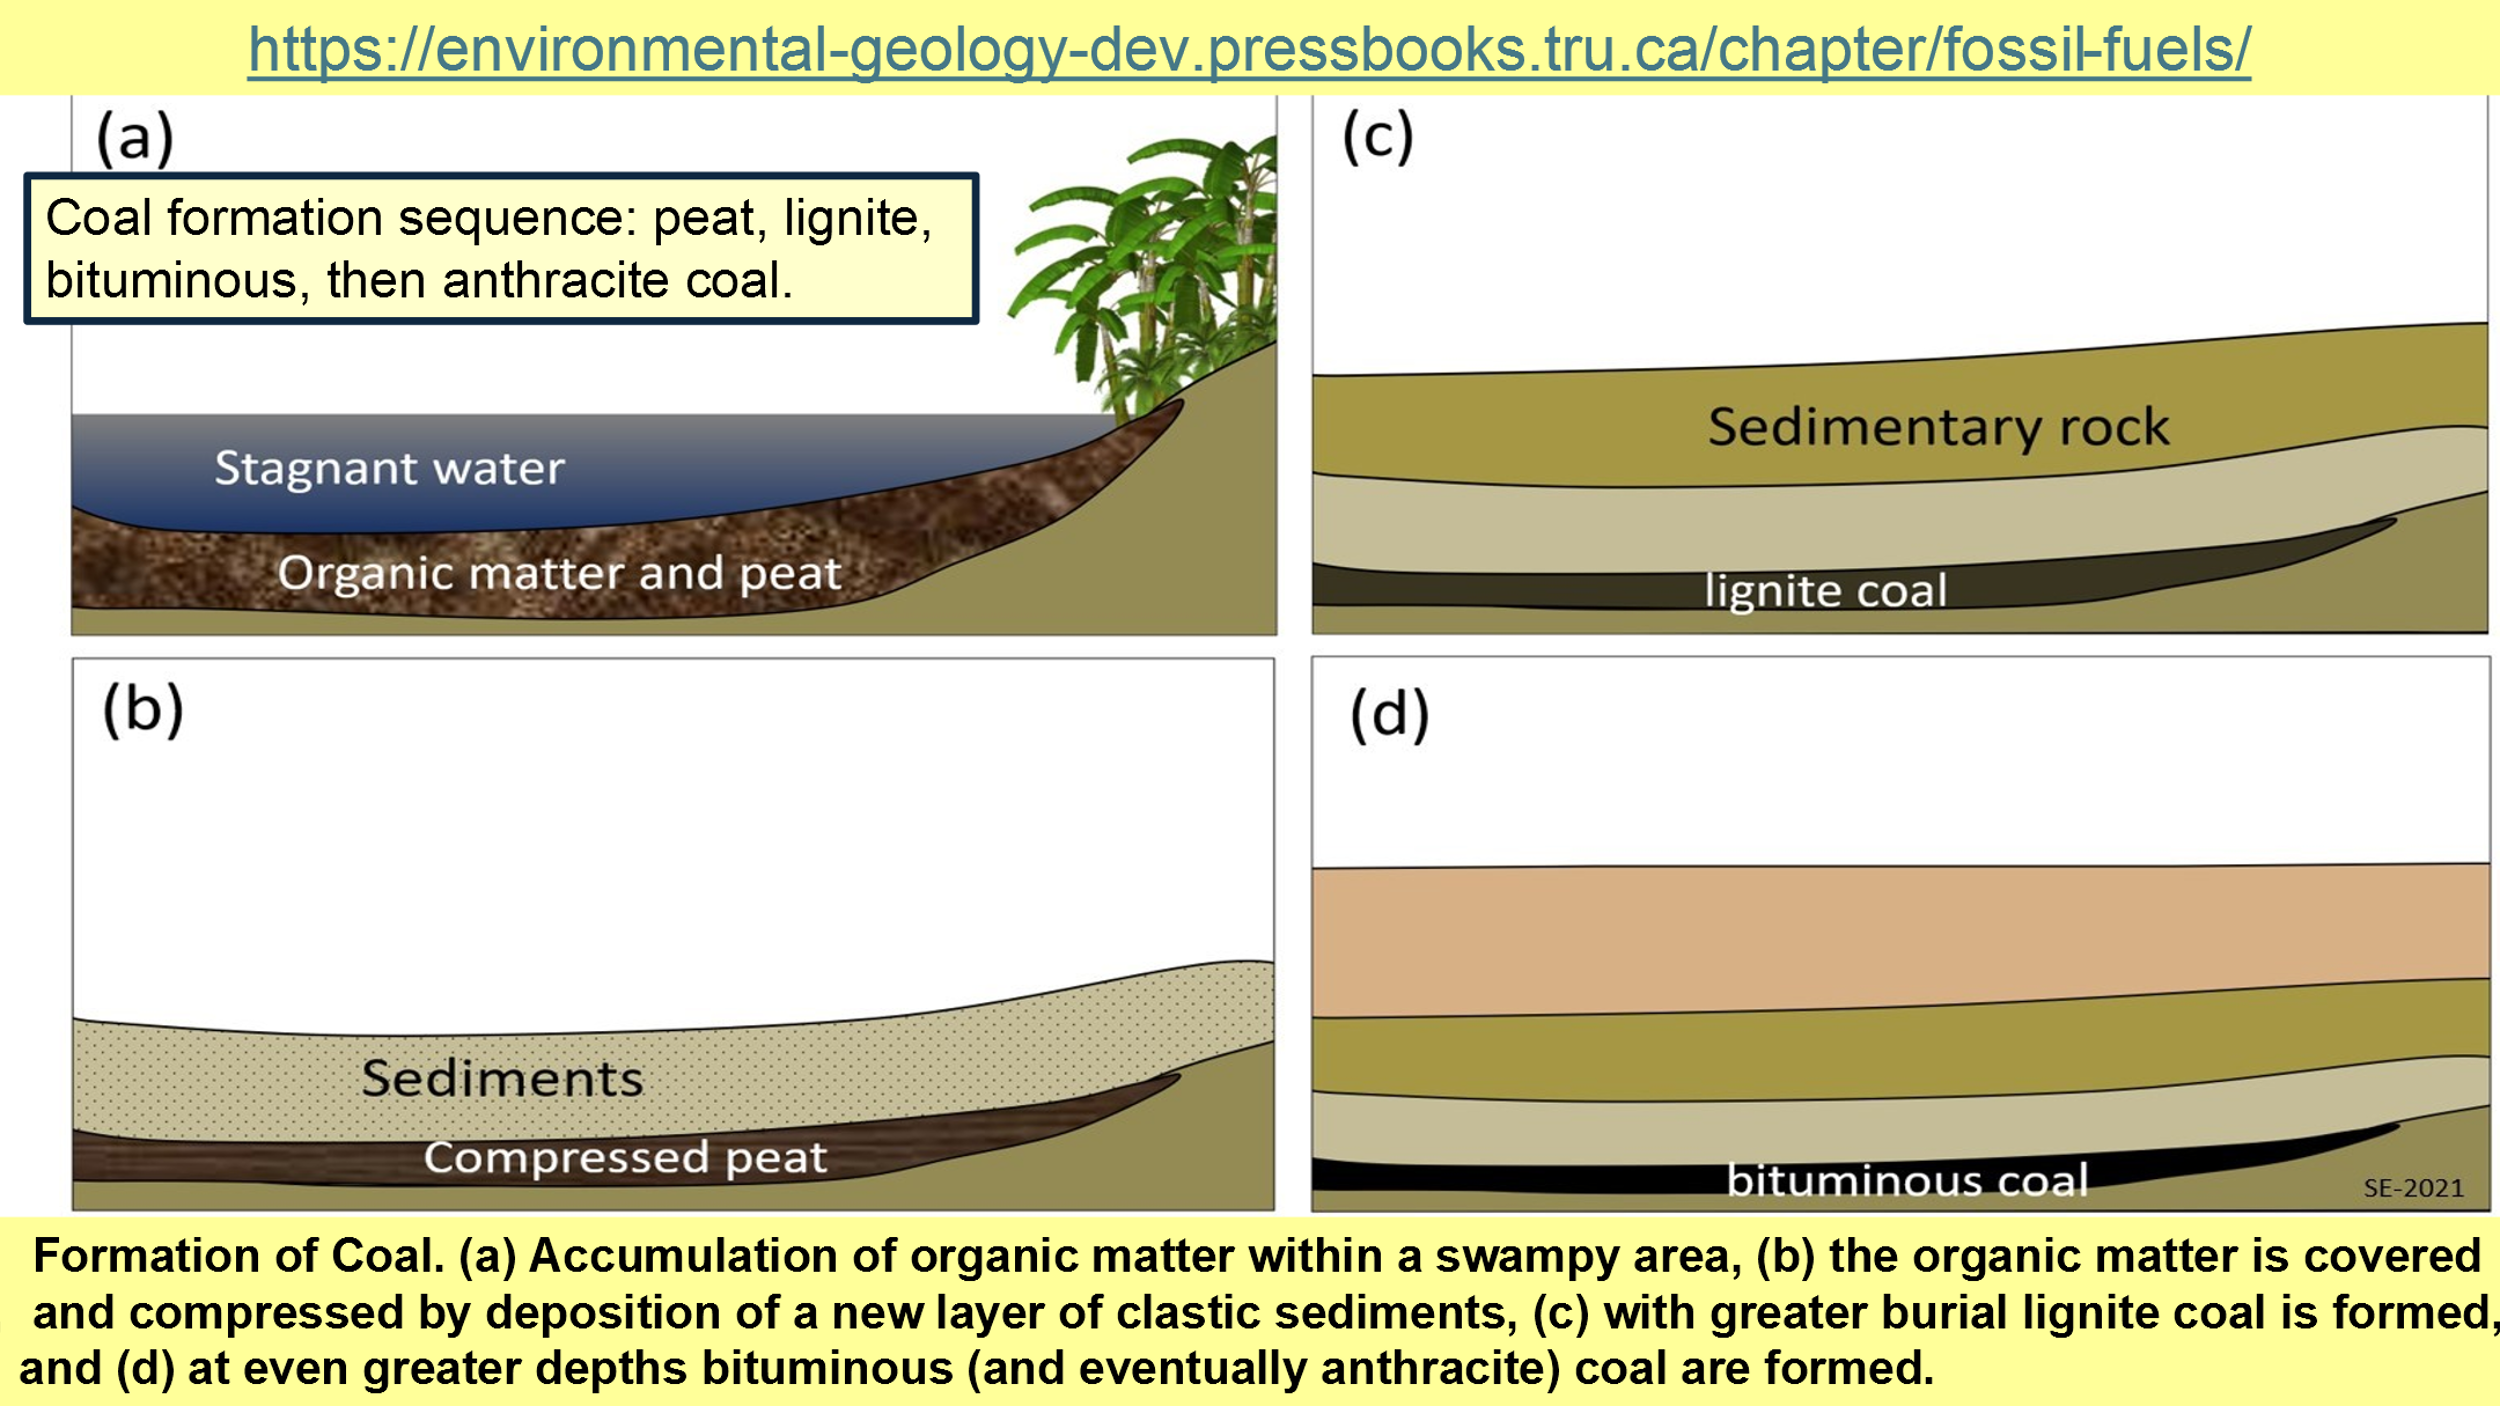
To extend the depiction and description of Figure 6, in areas where the geologic forces become even stronger and folding occurs at depth, rocks undergo metamorphosis. Sand becomes sandstone, eventually quartzite, mud becomes shale, then slate, lime becomes limestone, then marble.
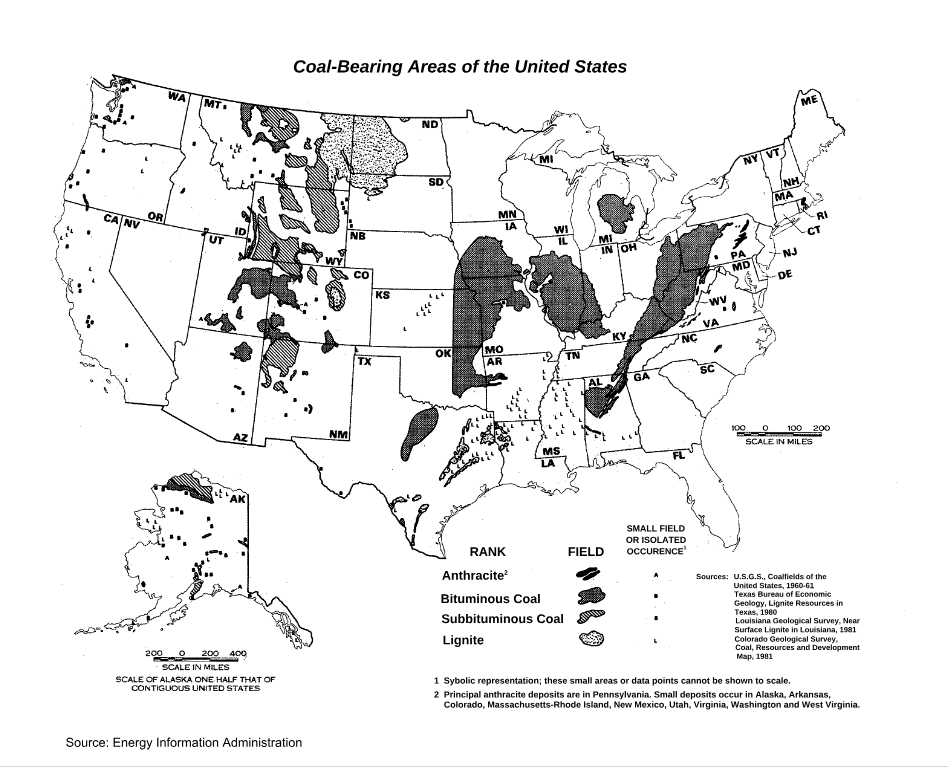
Organic matter becomes peat, lignite, bituminous coal and eventually anthracite coal. Anthracite is harder, has a higher carbon content, is more difficult to get burning, and brittle, but which emits a lot more energy per unit volume when burned. Anthracite has both low volatiles content and low sulfur content, burns hotter and cleaner, and is favored for home heating and in many industries. However, anthracite coal represents only 1% of coal deposits in the USA, mostly from northeast Pennsylvania, and most anthracite coal has been used up.
Globally, coal use has continued to increase, led by China, but also India, and the rest of Asia. Despite the smiling photo op of Presidents Obama and Chairman Xi on 3 Sep 2016 in front of an image of China’s Great Wall and a sanctimonious-sounding statement from the US Embassy, China’s coal use has continued to increase. This is just not me saying this, it has been published by Climate Central, the New York Times, TIME, Bloomberg, the UK Daily Mail, and Reuters.
OIL
While coal is the product of trees and other land-based plants falling into land-based swamps, oil and natural gas result from the collection of marine-based underwater sediments derived from algae and plankton which are buried and converted to kerogen. Kerogen will be mentioned later when we get to the Green River Formation.
Subsequent to burial, remains of algae and plankton over millions and even hundreds of millions of years over geologic time frequently results in deposition of impermeable sediments, fine-grained muds for instance, atop the remains of the algae and plankton.
<For the last 55 years or so, the theory of plate tectonics has become mainstream science. Therefore, this plausible mechanism for the formation of folded rocks into ranges of mountains has come to the fore, a development which did not exist at the time I graduated as a Geology major in 1962, when we were instructed that folded mountains resulted from “unstable geosynclines.” Another blow to the ‘science is settled’ ignorant scolds.>
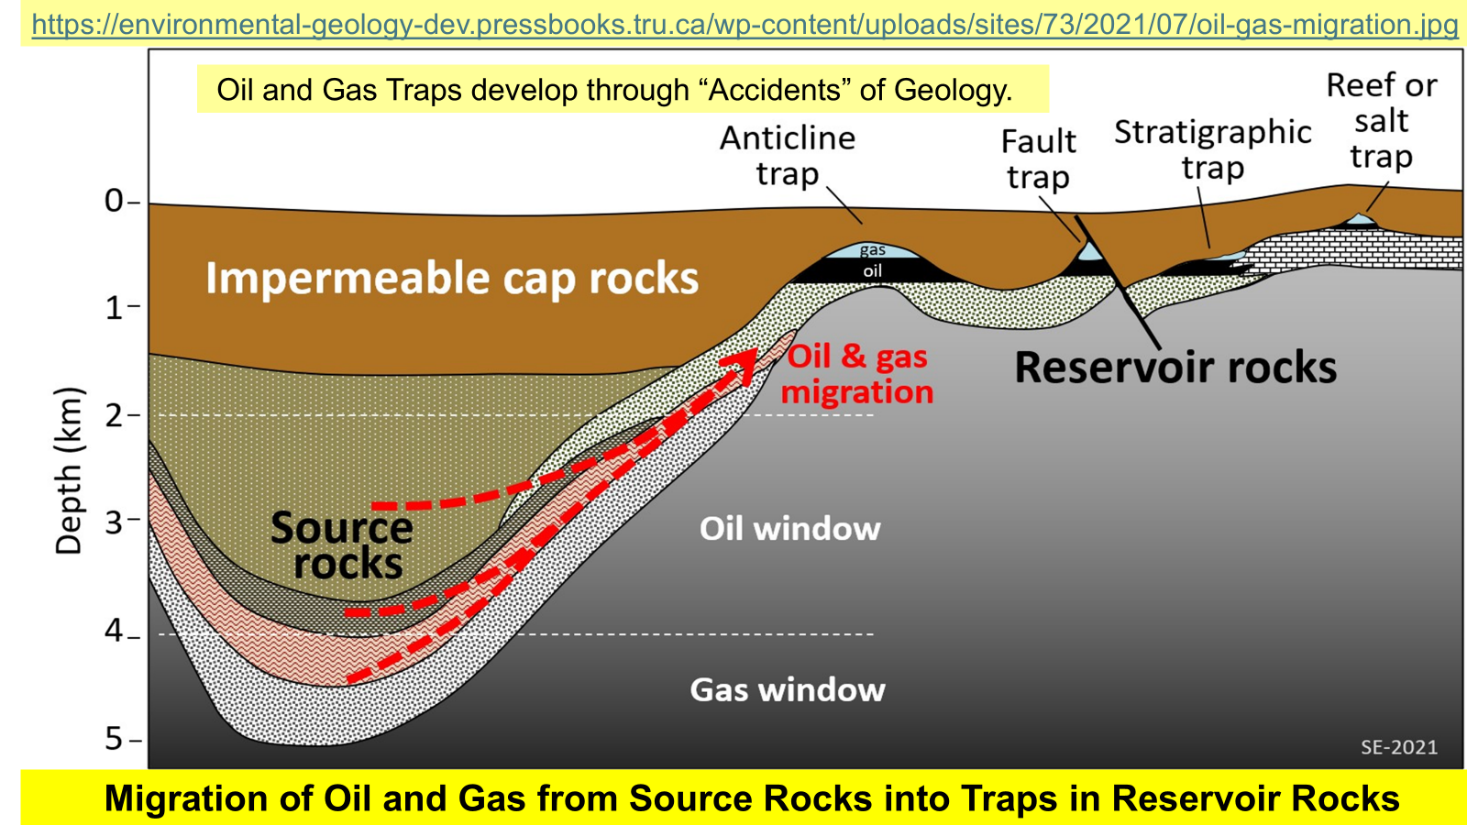
Figure 8 below shows a schematic for the remains of algae and plankton, migrating from what we now know are source rocks for oil and gas, with frequently folded rocks overlain by impermeable rocks, typically shales. Burial of the remains of algae and plankton is frequently accompanied by heat and pressure, forming kerogen, and, eventually, oil and gas. Over time the folded rocks develop trap structures where oil and gas can collect. Buried sediments and subsequent heat and pressure create an environment where the kerogen becomes transformed. Its products become mobile and migrate from the source rocks into what we’ll call here “accidents of geology.” These are regions where the mobile hydrocarbons are trapped: anticline traps, fault traps, salt or reef traps, and stratigraphic traps.
I will not delve into the long history of crude oil production in the US, just mentioning its beginning with the Drake Well near Titusville, in northwestern Pennsylvania, in 1859. However, Edwin Drake’s was the first really successful effort which began the long evolution of profitable oil production which changed the US and the world. Consider that the beginning of the time series of Figure 9 below occurred 61 years after Edwin Drake’s first well.
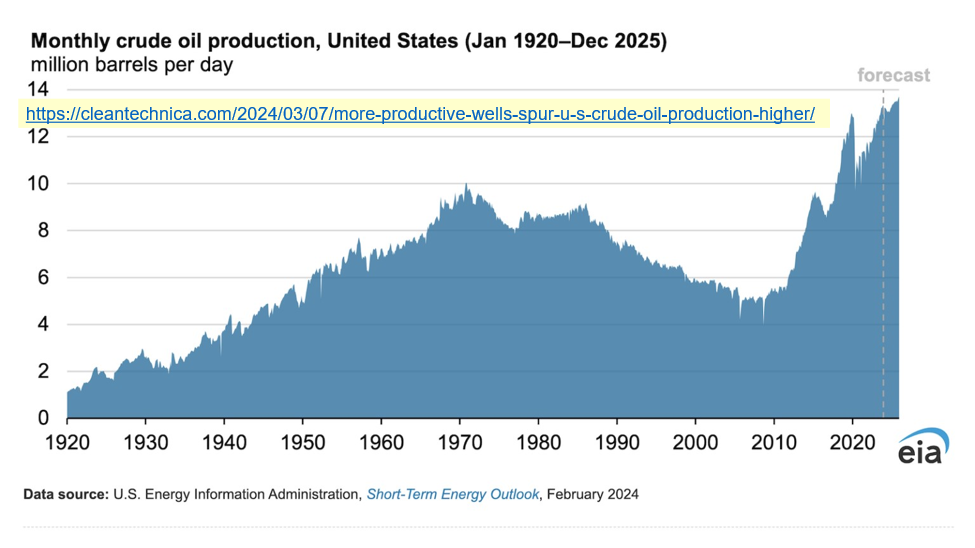
Production of crude oil in the USA peaked in 1970, and market forces resulted in dramatic increases in oil imports into the USA thereafter. But by 2010, massive US increases in shale oil production resulted in crude oil production amounts surpassing the earlier peak within 5 years. This quote and figure seem to put it best:
“Historically, U.S. crude oil production maintained steady growth until 1970, peaking at 9.6 million barrel per day (bpd). However, a downward trend ensued from the early 1970s, hitting a nadir of 5.0 million bpd in 2005. The emergence of shale oil extraction technology acted as a transformative force, reshaping the U.S. oil production landscape. Notably, shale oil output surged from roughly 0.5 million bpd in 2008 to 8.4 million bpd by 2023, constituting a substantial 65% of the total U.S. crude oil yield. This astounding expansion propelled the U.S. to eclipse both Russia and Saudi Arabia as the world’s foremost oil-producing nation, achieving an average daily output of 11.0 million barrels in 2018.”
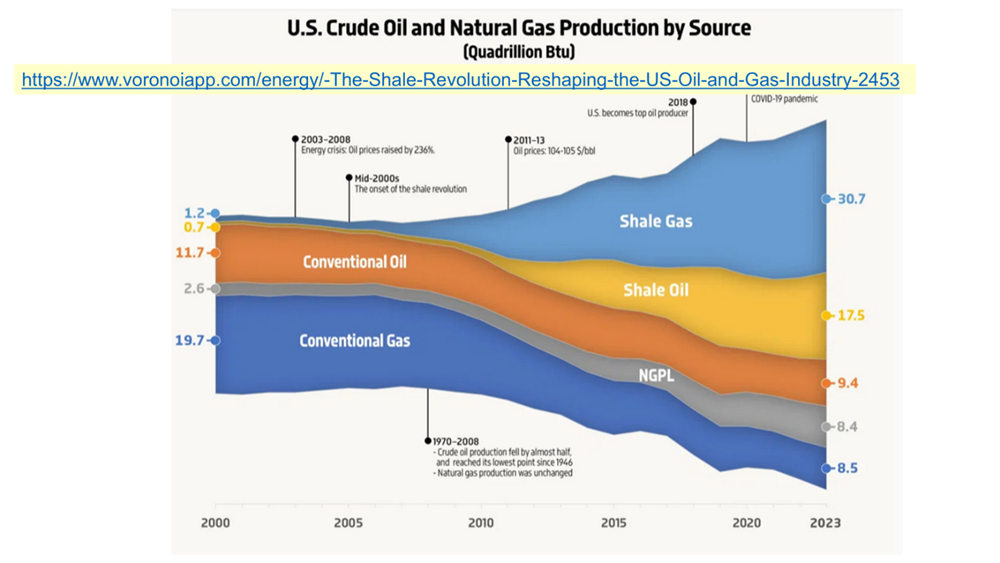
Figure 10 below is the “Voronoi Diagram” of US Crude Oil and natural Gas production by source from 2000-2023. Shortly after 2010 there was a true revolution in the ability of US Oil producers to liberate gas and oil from the tightly bedded shales of the USA. This ability liberated these hydrocarbons from the source rock, rather than from drilling into the previously described “accidents of geology,” the traps shown in Figure 8. This development was truly a revolution in hydrocarbon production in the USA and overseas.
Details of how this change in production methodology is done in the field are described diagrammatically in Figure 11 below. Previously we described how remains of algae and plankton collect on the bottom in marine environments over time. And how, given sufficient depth, pressure, heat, and time, these remains become kerogen, and eventually oil and gas. If the sediments into which the remains of algae and plankton are porous, such as sand, limy sand or sandy shale, and the rocks are folded, exemplified in Figure 8 above, then the oil and gas can collect in the traps shown in Figure 8.
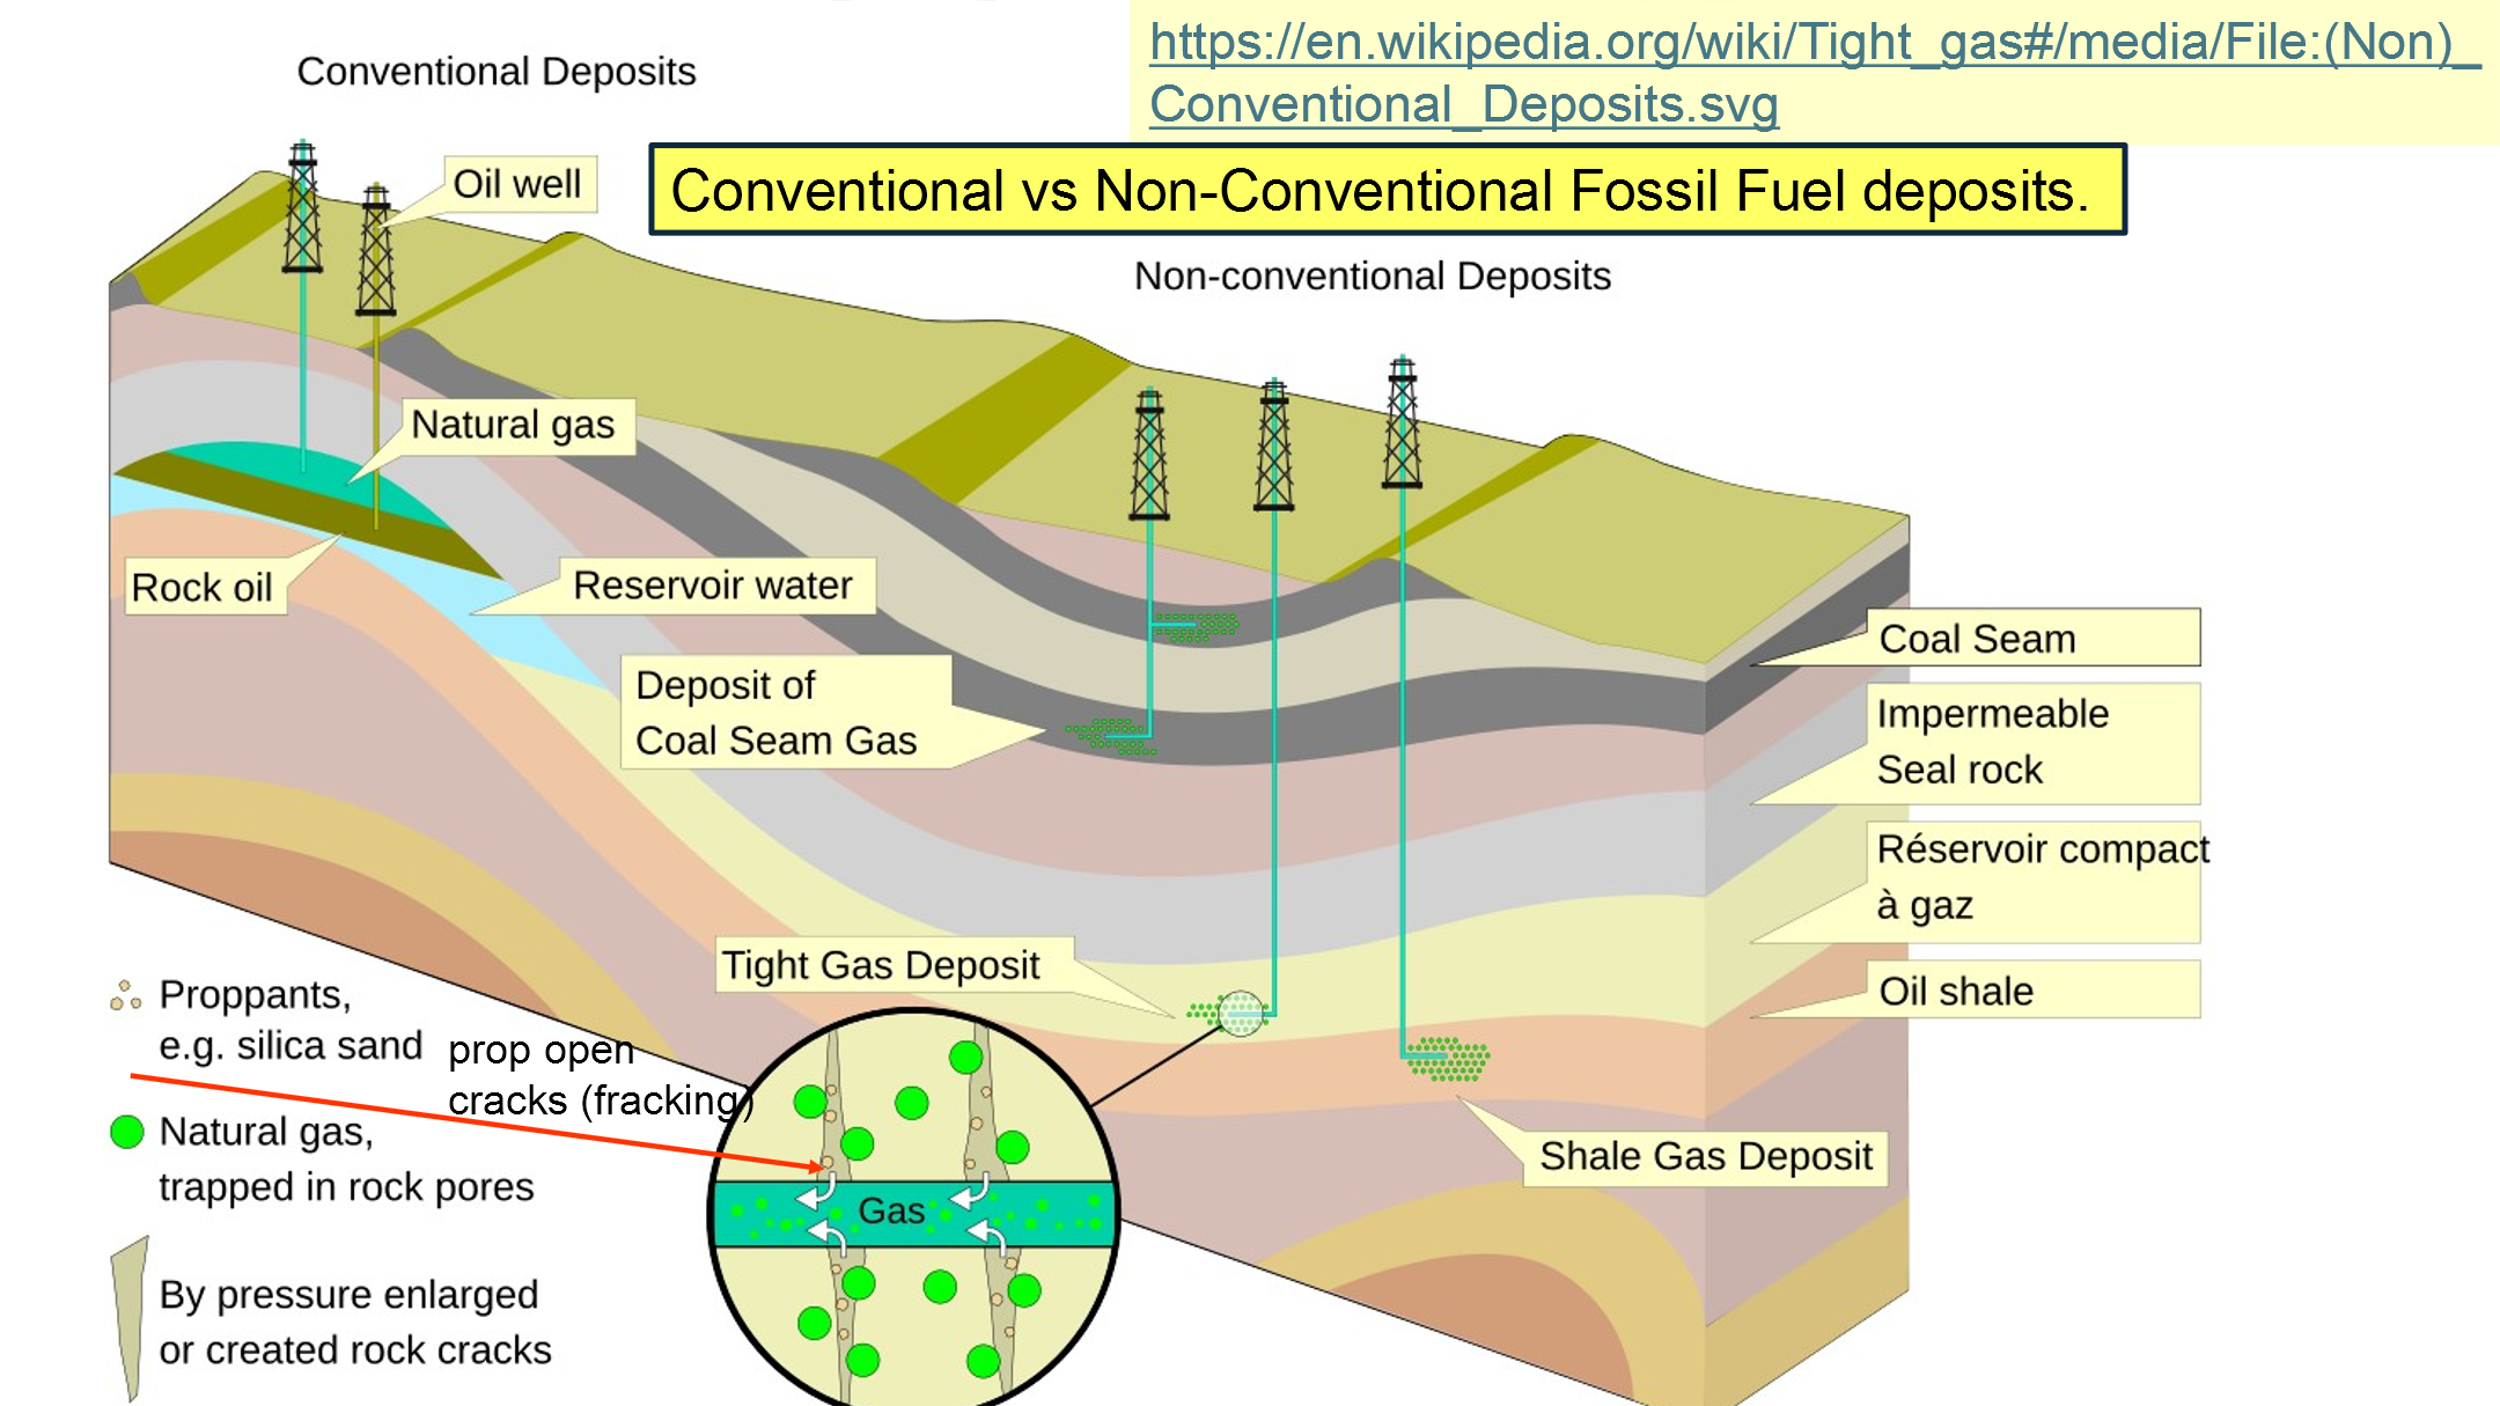
However, if the sediments are mud, then the remains of algae and plankton are in an impermeable sediment which, given enough pressure, heat, and time, becomes impermeable shale. When these sediments are encountered today, they are called “tight oil” and “tight gas.” Under these circumstances, it is possible to extract these unconventional hydrocarbon deposits through by hydraulic fracturing of the shale containing this tight oil or gas, “fracking,” for short.
In fracking, drillers inject under high pressure a mixture of water, silica sand or other similar solids, and gelling agents. This process injects, under high hydraulic pressure, the fluid, in a process called “slickwater hydraulic fracturing.” Cracks develop in the previously impermeable shale. The sand grains in this mix then prop the cracks open; the industry now calls them “proppants.” Frequently production of gas increases dramatically.
“THE END OF OIL!”
Many so-called experts have predicted the end of oil, or at least the decline of oil after their forecast “peak oil” production was reached. These predictions included:
In 1874, only fifteen years after Edwin Drake’s well at Titusville, the state geologist of Pennsylvania warned that the supply of oil in the US would run out in only four years.
In 1914, the federal government warned that the US had only a ten-year supply of oil.
In 1921, the president of the Colorado School of Mines predicted, “the average middle-aged man today will live to see the virtual exhaustion of the world’s supply of oil from wells.”
In 1940, the US government announced that oil reserves would be depleted within a decade and a half.
In 1956, Geophysicist M. King Hubbert published a bell-shaped curve predicting that US oil production would peak between 1965 and 1970. His model was considered to be proven when the production peak, of Figure 9 above, was achieved, and US production started downward.
In 1973, the Yom Kippur War occurred when Egypt and Syria attacked Israel. In the aftermath, in October 1973, Saudi Arabia and OPEC started the OPEC Oil Embargo, the net effect of which was to quadruple the price of crude oil. Many of us remember the rationing of gasoline in late 1973, and the similar shortage in the summer of 1974.
The 2 Feb 1977 televised speech by President Jimmy Carter, wearing a sweater, addressed the ongoing energy crisis. We can see now, from Figure 9, that this was during the period of decreased US oil production and seemingly following the Hubbert Curve.
Subsequently, the “18 April 1977 Moral Equivalent of War speech” was a televised address made by President Jimmy Carter. Carter warned that the energy crisis was a “national catastrophe” requiring a wartime-level mobilization to reduce oil imports, promote conservation, and develop alternative energy sources. In it, he stated the goal was “to reduce dependence on oil imports and “cut in half the portion of United States oil, which is imported, from a potential level of 16 million barrels to six million barrels a day.” This address did not age well.
FRACKING AND HORIZONTAL DRILLING
By 2025 The use of horizontal drilling and fracking improved over 50 years of development, which included:
In 1965, fracking the Ohio and Cleveland Shales was done using detection of the fracture occurrences with sensing systems developed by Sandia Laboratories,
In the 1980s, horizontal drilling began in the Austin Chalk in Texas, a forerunner development of the widespread use of horizontal drilling today, in 2026.
In 2000 the Barnett Shale was successfully mapped using micro seismic imaging.
In 2002-2003 the elements of modern fracking at scale occurred, which included horizontal drilling, micro seismic mapping, and slickwater fracking combined; many operators bought up substantial amounts of acreage across the continental United States. Some called it the “Shale Gale.”
By 2010 Crude Oil production in the USA equaled the previous peak achieved in 1970, Figure 9; by 2023 that production mark was exceeded by another 30%
TWO UNUSUAL SOURCES OF OIL AND GAS
Two non-traditional sources of oil and gas lie in western North America. They are the Green River Formation in Utah, Colorado and Wyoming, and the Athabasca Oil Sands of Alberta. Sometimes the latter are called the Athabasca Tar Sands, as we will see later.
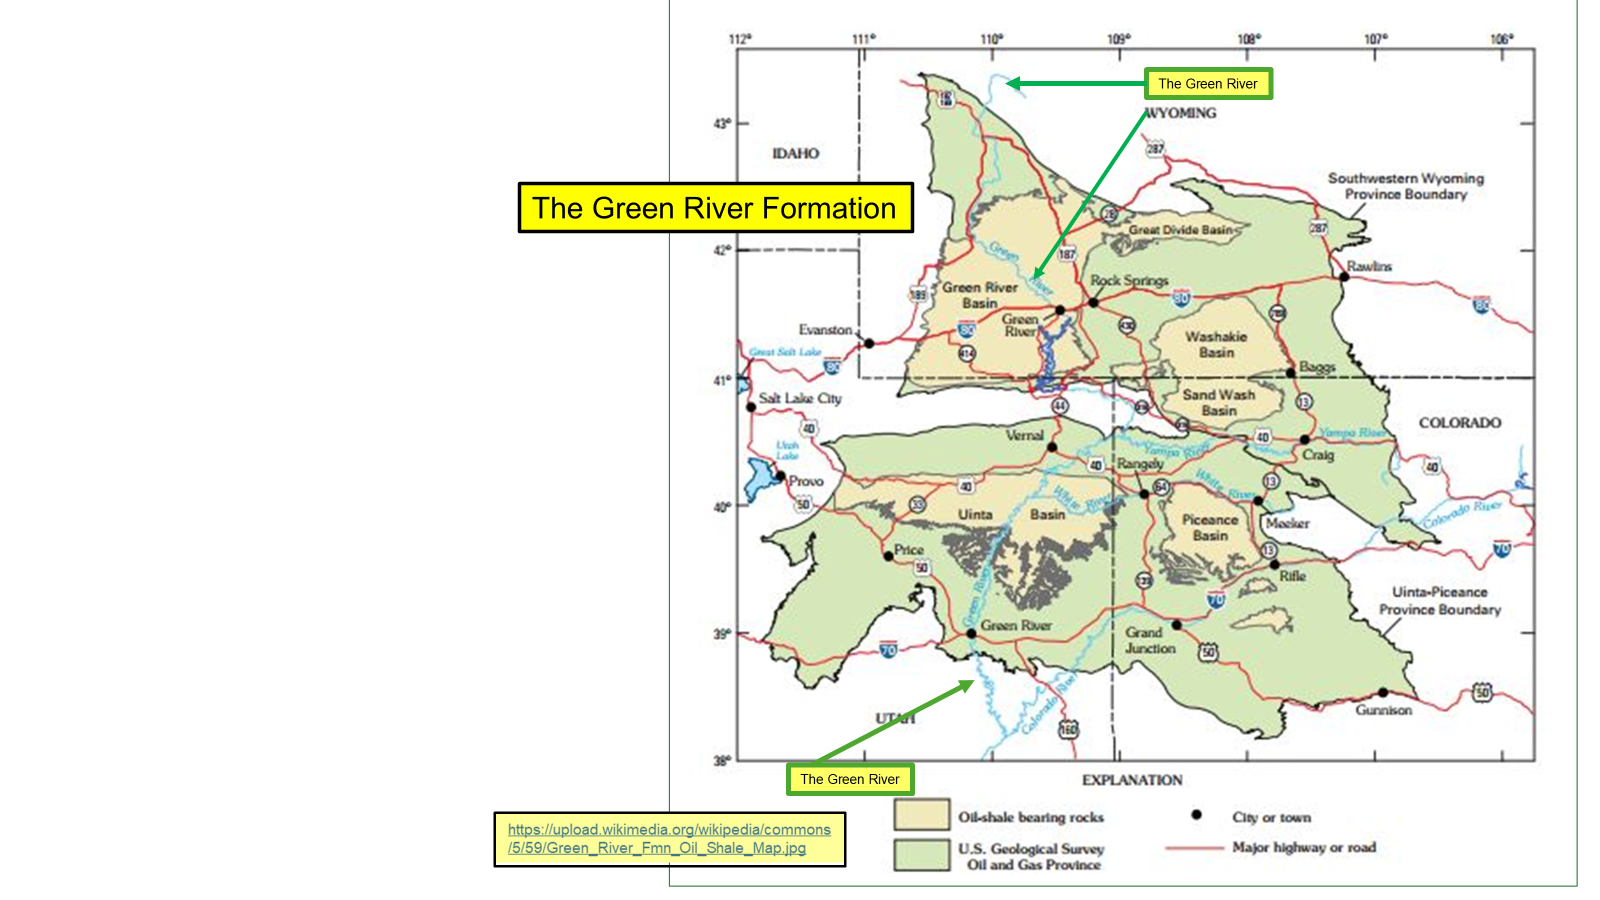
The Green River Formation is an assemblage of over 1,000 feet of sedimentary rocks that lie beneath parts of Colorado, Utah, and Wyoming. The Green River Formation is an Eocene-aged (approx. 57.8 to 36.6 million years ago) sedimentary rock unit famous for its exceptionally preserved fossils, particularly freshwater fish, and vast oil shale deposits. The primary fossil-bearing, high-sedimentation phase occurred in the ~six million years between ~53.5 and 48.5 million years ago. It contains the world’s largest deposits of oil shale.
Most of the hydrocarbons are locked up in kerogen, a seemingly insoluble solid organic material in sedimentary rocks. The issue today is, how to make it economically viable to extract?
The US Geological Survey estimates that the Green River Formation contains about 3 trillion barrels of oil, and about half of this may be recoverable, depending on available technology and economic conditions.
The Rand Corporation, a nonprofit research organization, estimates that 30 to 60 percent of the oil shale in the Green River Formation can be recovered. At the midpoint of this estimate, almost half of the 3 trillion barrels of oil would be recoverable. This amount is about equal to the entire world’s proven oil reserves. The American Enterprise Institute estimates that there is a 200-year supply of oil and gas in the Green River Formation.
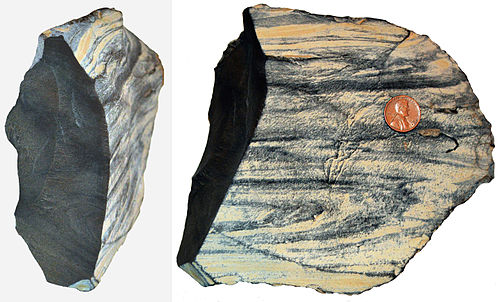
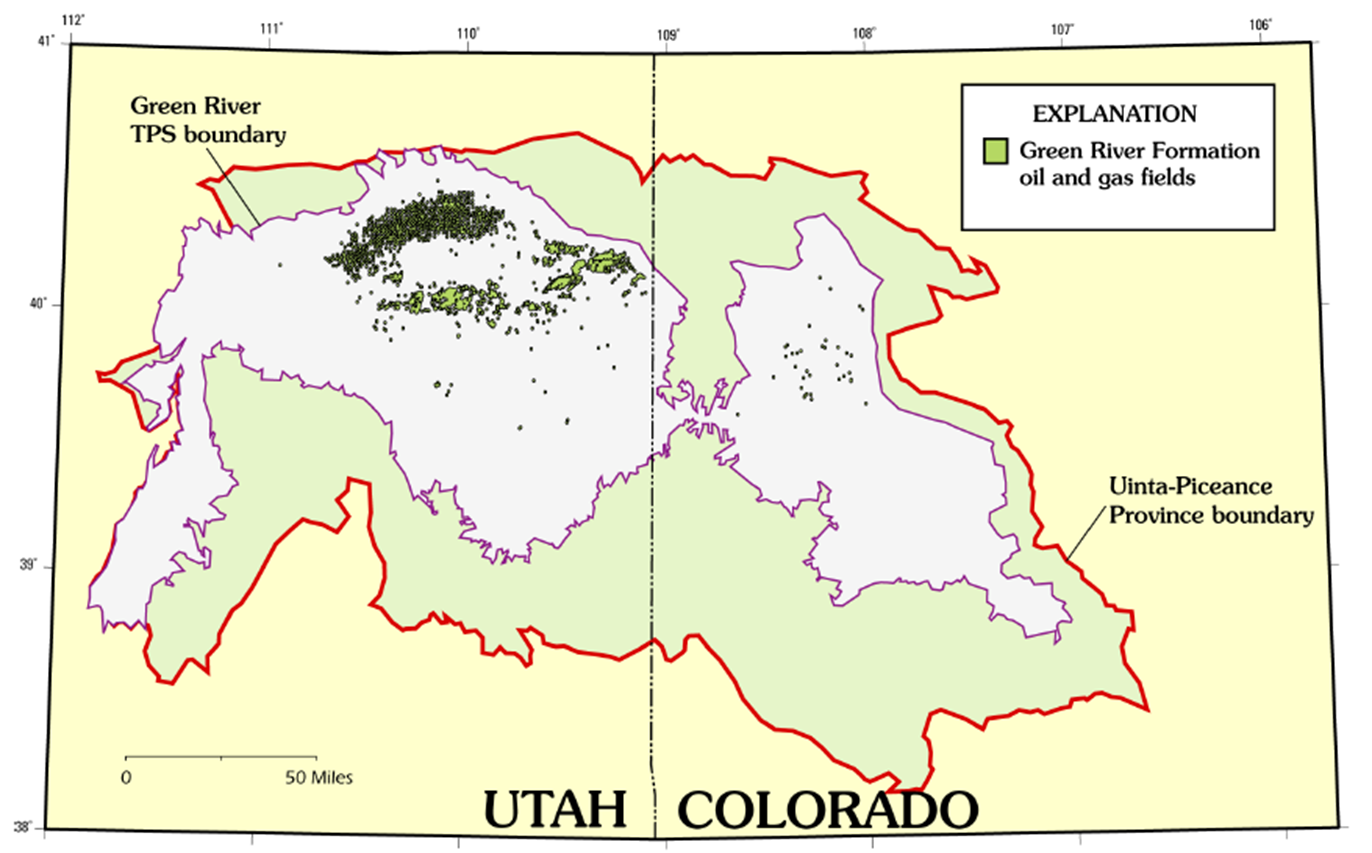
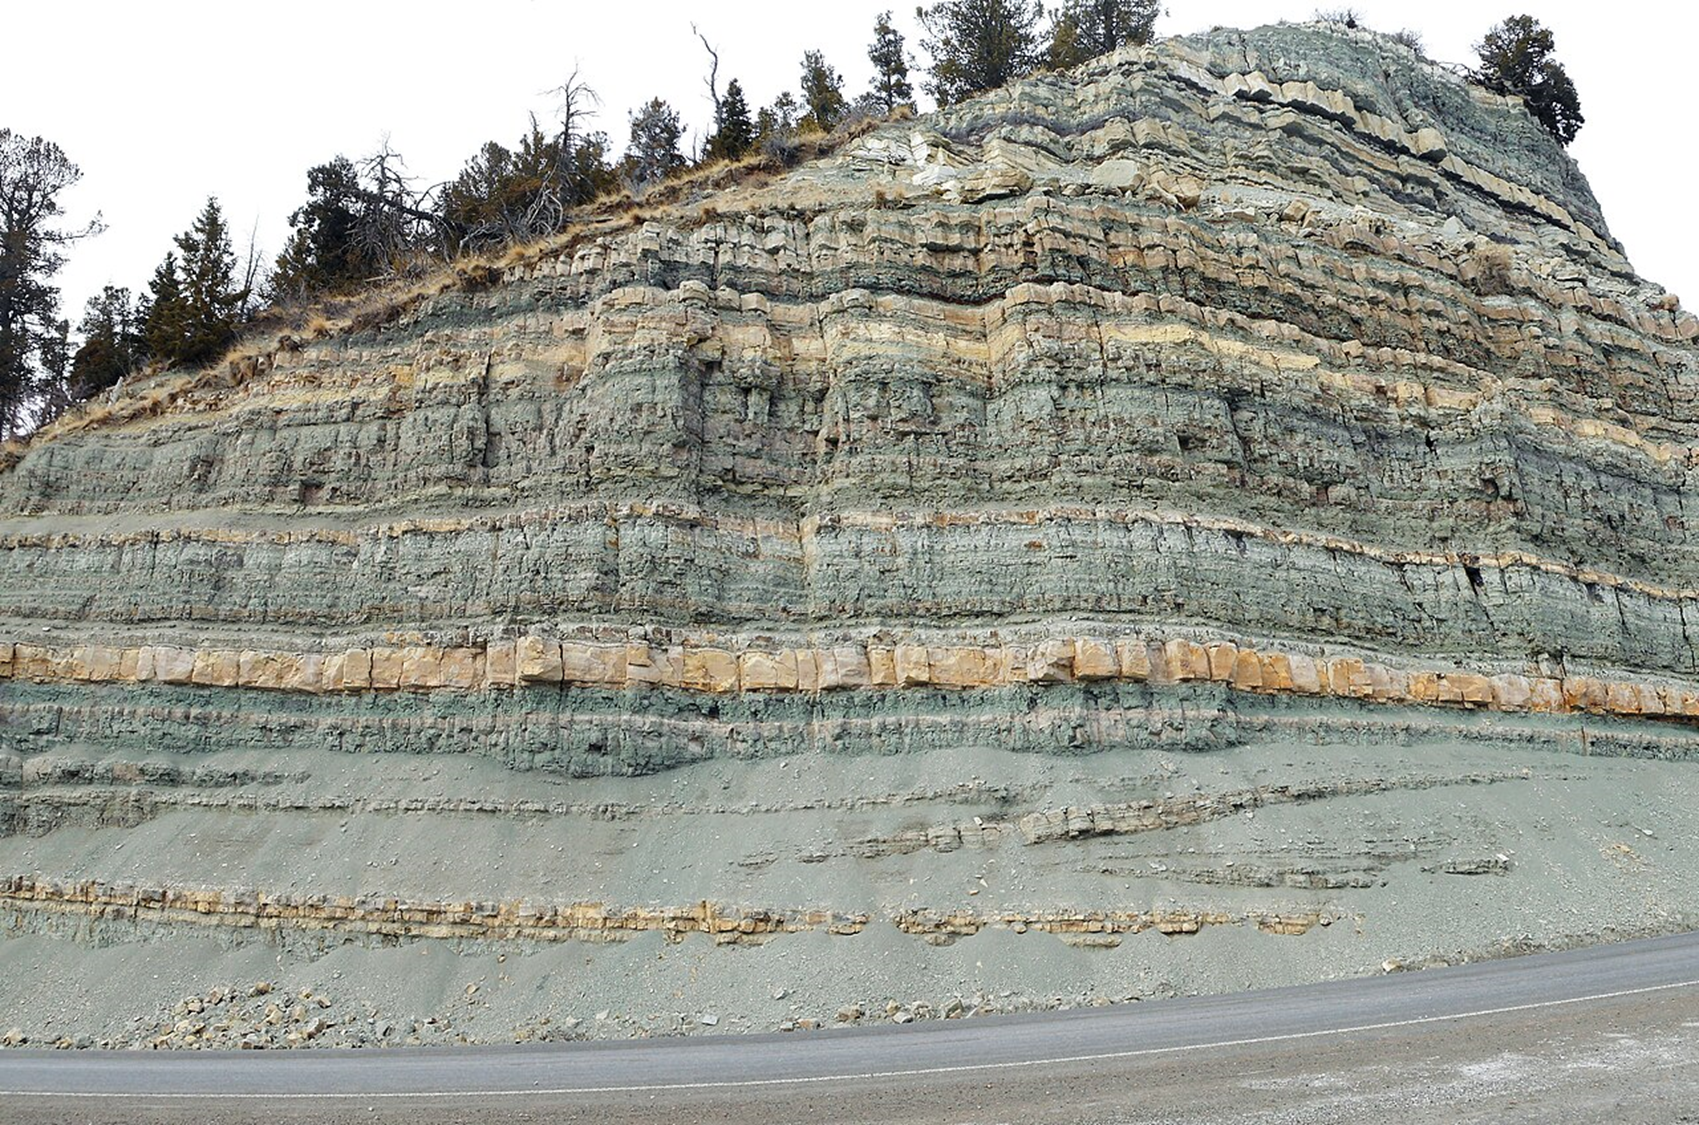
Sediments of the Green River Formation were deposited in three intermontane lake basins during the formation of the Rocky Mountains centered about 50 million years ago. Sediments of the Green River formation were deposited in the Eocene, which means that deposition centered about 15 million years after the top of the Cretaceous, when the dinosaur extinction event occurred. The intermontane lakes were Fossil Lake, Lake Gosiute, and Lake Uinta. The sediments were deposited in fine to very fine layers: a dark organic layer during the growing season and a lighter colored inorganic layer in the dry season. Each pair of layers is called a varve representing one year. The sediments of the Green River Formation present a continuous record of six million years. The location of the oil and gas deposits in the Green River Formation are the green-colored areas in Figure 14, below.
Shale oil extraction is an industrial process for unconventional oil production. There have been many attempts over the years, even centuries, to extract usable hydrocarbons from oil shale; a good number of them are mentioned and described in the history section of this article. Economic realities, including the readily availability of crude oil on the free market have led to significant changes in the marketability of the shale oil produced, and a seemingly roller coaster of historic output.
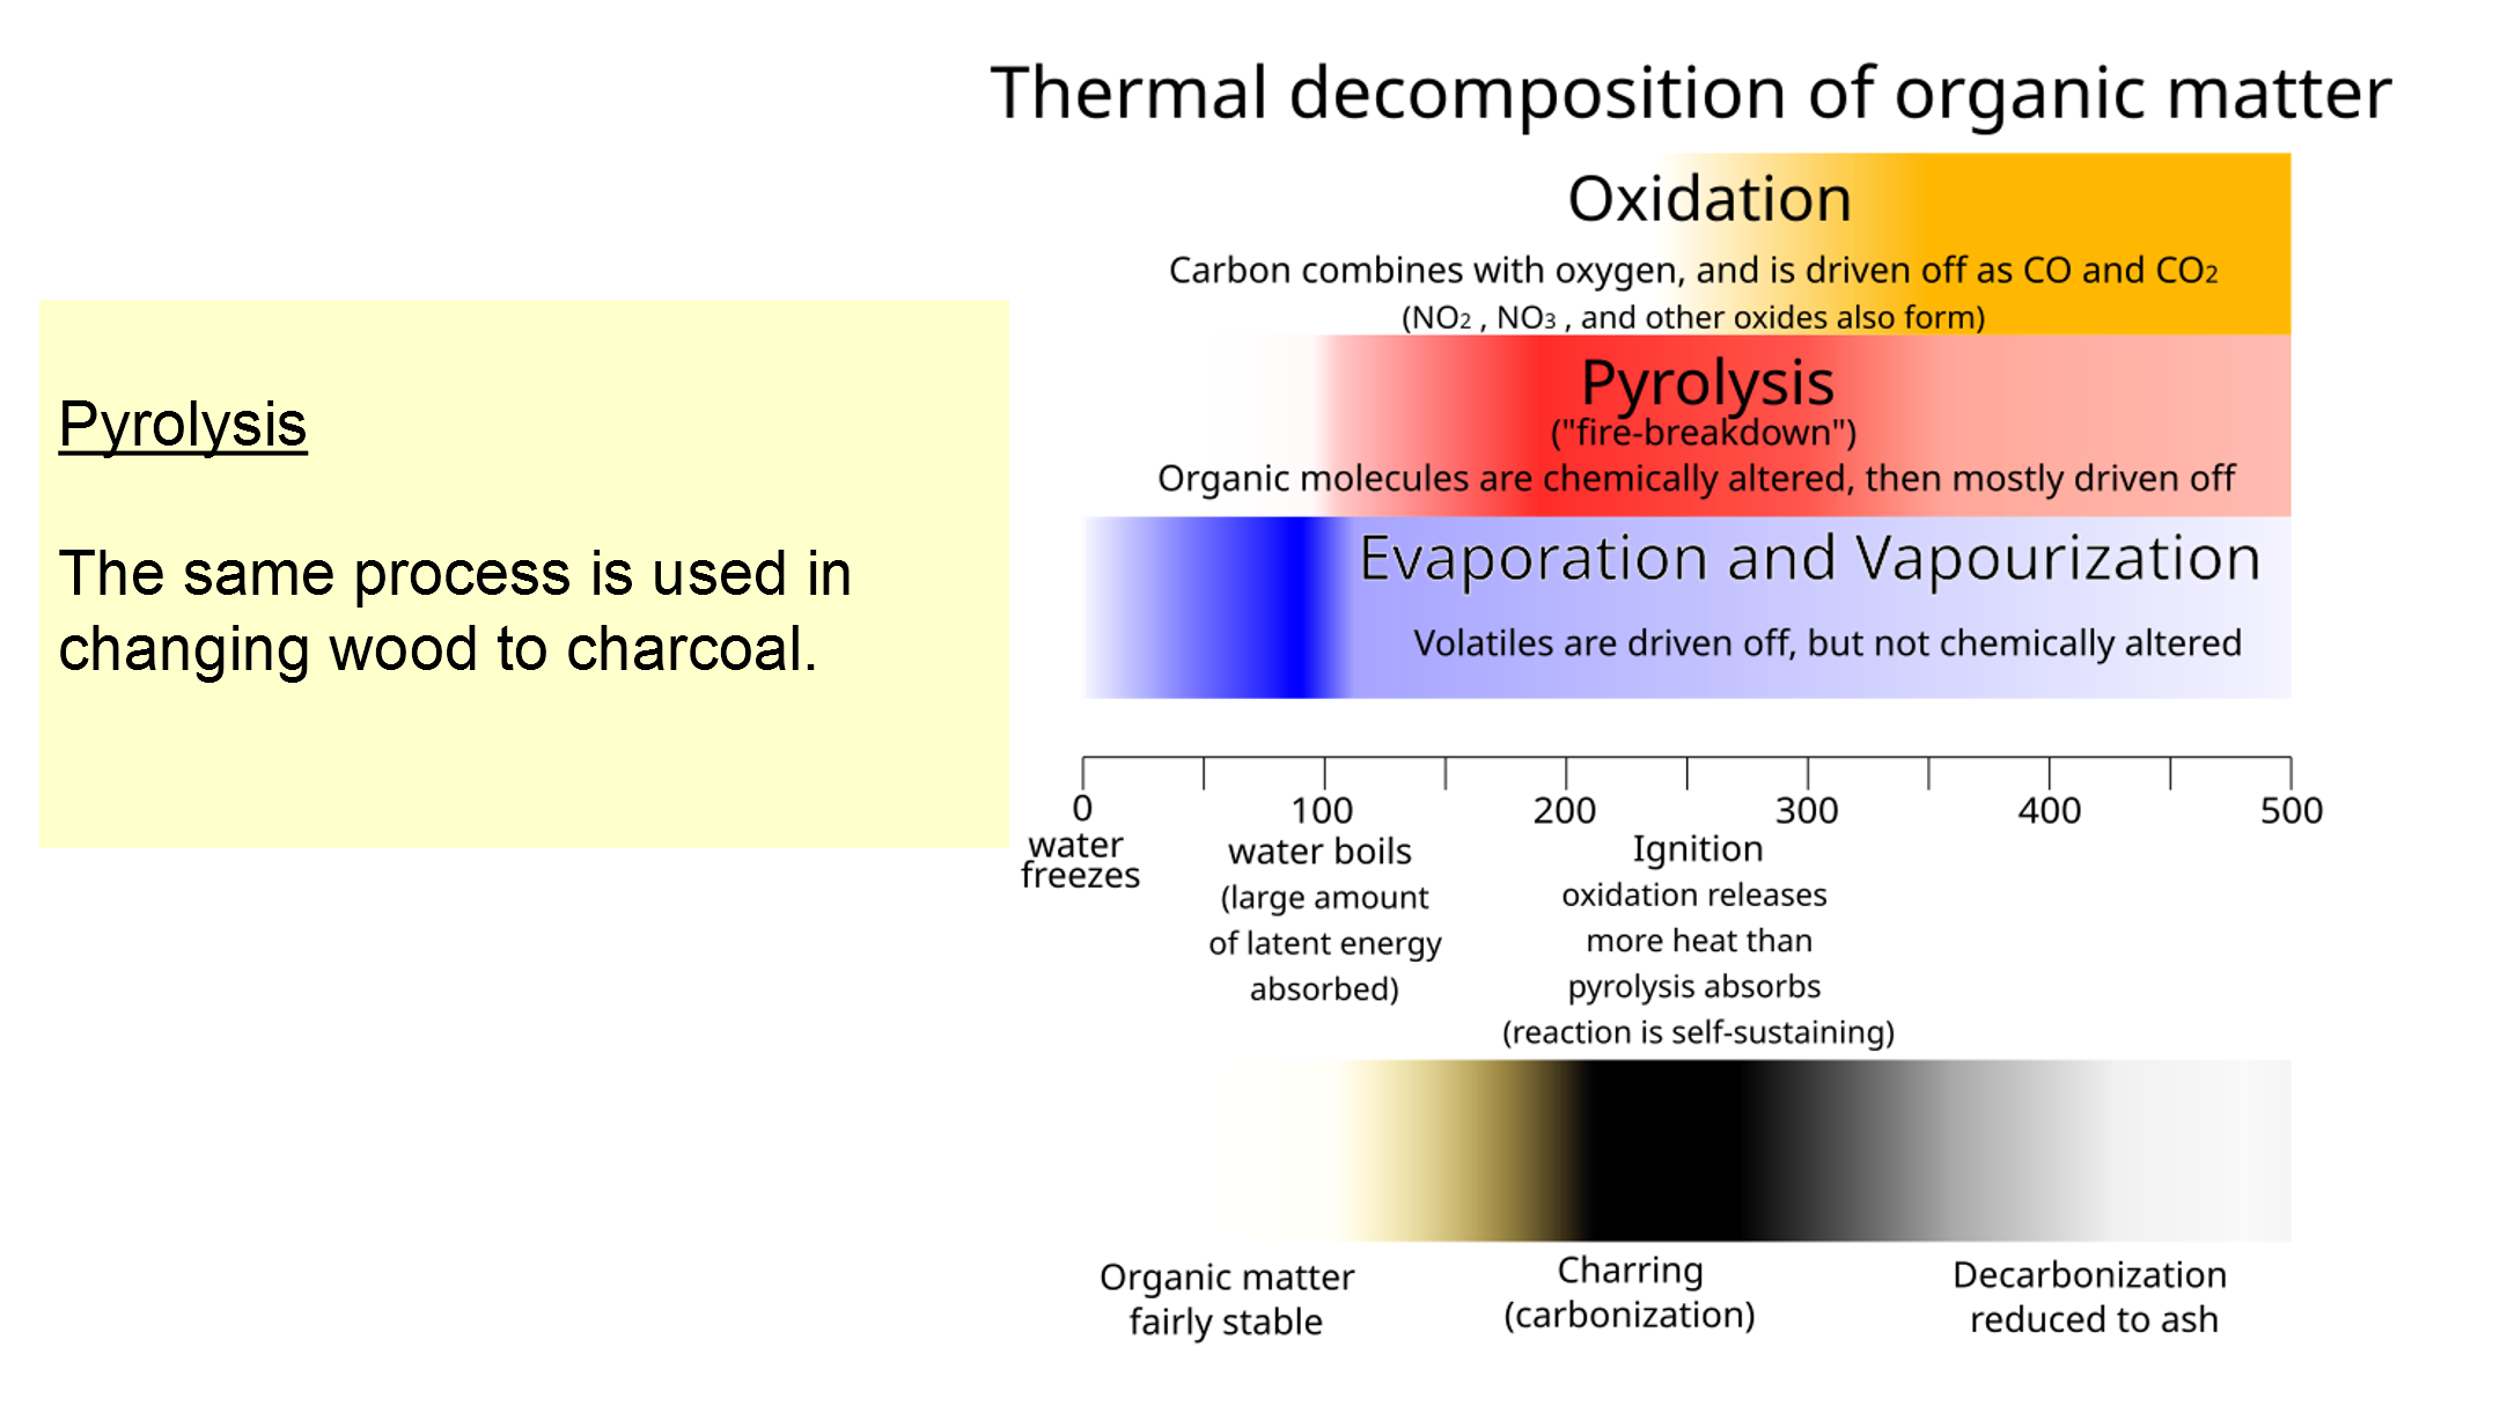
Principles involved in shale oil extraction are to convert kerogen (Figure 13 above) into shale oil, most typically by pyrolysis, hydrogenation, or thermal dissolution. The resultant hydrocarbon is for use as fuel or upgraded to meet refinery feedstock specifications by adding hydrogen and removing sulfur and nitrogen impurities.
England granted the first formal extraction process patent in 1864. During the 19th century extraction industries and innovations became widespread. In the mid-20th century, the shale oil extraction industry shrank following the discovery of large reserves of conventional oil, but this shrinkage would be short-lived.
At the beginning of the 21st century, high prices, led by the decline of crude oil production (attested to in Figure 9 above), led to renewed interest in shale oil extraction methodologies and was accompanied by the development and testing of newer technologies.
Pyrolysis. Figure 16 is a graphic which shows many of the elements involved in pyrolysis, as a function of Temperature, the Celsius scale near the center of the figure.
Hydrogenation. An example of Hydrogenation, adding hydrogen to a carbon substance to create a hydrocarbon for fuel, is in the Fischer–Tropsch process. In this process, a mixture of carbon monoxide and hydrogen, known as syngas, is converted into liquid hydrocarbons using a number of chemical reactions with metal catalysts, using pressures of up to several tons of atmospheres, and using temperatures of 150-300C or 300-570F. The Fischer–Tropsch process, often FT, is an important reaction in both coal liquefaction and gas to liquids technology for producing liquid hydrocarbon fuels. This is how the Germans fueled their WW2 war machine after the Allies eventually destroyed the refineries at Ploesti, Romania. It primarily involves adding hydrogen (H2) to unsaturated molecules (those with double or triple bonds) in the presence of a metal catalyst typically nickel, platinum, or palladium.
Fast-forward to today, and the US Department of Energy has descriptions of and has spurred development of perhaps a dozen processes and methodologies for conversion of syngas into liquid fuels using the hydrogenation process by using three different types of reactor designs used for FT synthesis: Fixed bed reactor, Fluidized bed reactor, and Slurry bed reactor. In practical terms, these have resulted in the development of facilities for gasoline and diesel liquid fuels.
Thermal Dissolution. This industrial process for extracting oil from oil shale uses solvents at elevated temperatures and pressures to break down and dissolve the organic matter in kerogen, to increase the oil output. We start with kerogen, that solid, insoluble, organic material tightly bound within the mineral matrix of the shale rock that we saw in Figure 13 above.
Unlike conventional oil, which flows naturally, kerogen must be converted into liquid hydrocarbons (shale oil) to be extracted. So, the thermal dissolution process specifically involves heating the oil shale in the presence of a solvent, sometimes a hydrogen-donor solvent, at temperatures generally lower than those used for traditional pyrolysis alone. Then, applying pressure to the system, and catalytic cracking the dissolved organic matter to produce oil.
There is a long article, Shale oil extraction, maybe 10 pages in length, that wades through history, processing principles, several ways to classify the different extraction technologies, in-situ methods, ex-situ methods, externally generated hot gas extraction, and economics. There is a lot of information, too much to include here.
My interpretation. Taken together, this article seems to say (without coming out and saying it in plain language)
“This is a tough technology and the possibilities for success seem to be driven by the limited availability of inexpensive crude oil at market prices. This is discussed on line in some detail in Wikipedia. Success may or may not be within reach, and is certainly not guaranteed.”
To continue this topic, we consider this almost decade-old journal article, In-situ kerogen extraction via combustion and pyrolysis, by Taniya Kar and Berna Hasçakir, where they examine shale oil extraction possibilities from the Green River Formation. They rapidly get to the issues. From the Abstract:
“Due to high thermal cracking temperatures of kerogen and low permeability of shales, in-situ oil shale extraction still is not feasible via pyrolysis… However, the ex-situ oil shale extraction adversely impacts air, water, and land quality. Moreover, through mining, only 20% of the reserve is accessible.”
In addition, the Utah Geological Survey, UGS, published this open-file report, which puts out a lot of information different in format and tone from the publications in technical journals. From the cover:
“This open-file release makes information available to the public that may not conform to UGS technical, editorial, or policy standards; this should be considered by an individual or group planning to take action based on the contents of this report.”
From the Abstract:
“In the northwest parts of the basin the lower Green River Formation was generating oil even before the end of the Eocene and slowing of sediment accumulation in the basin.”
This means that there was already, “…before the end of the Eocene…” enough heat and pressure on the organics to cook the materials into and even beyond the kerogen phase, to the point where crude oil was being formed, in some of the Green River Formation. The fields where the production has been longest and strongest are the Altamont and Bluebell fields (Fig 1.2 and Table 1-1), in Duchesne County, Utah.
From UGS’s Figure 2-13, the Green River Formation’s thickness varies from fewer than 3000 feet in the southeast to over 7500 feet in the northeast-trending basin deposition center in the western part of the basin. These large differences in the formation’s thickness have influenced the spatial distribution of thermal maturity of the Green River Formation’s source rock, meaning that extraction methodologies from the kerogen-containing rocks must account for the thickness variability, which influences the pressures and temperature history of the Green River Formation’s source rocks.
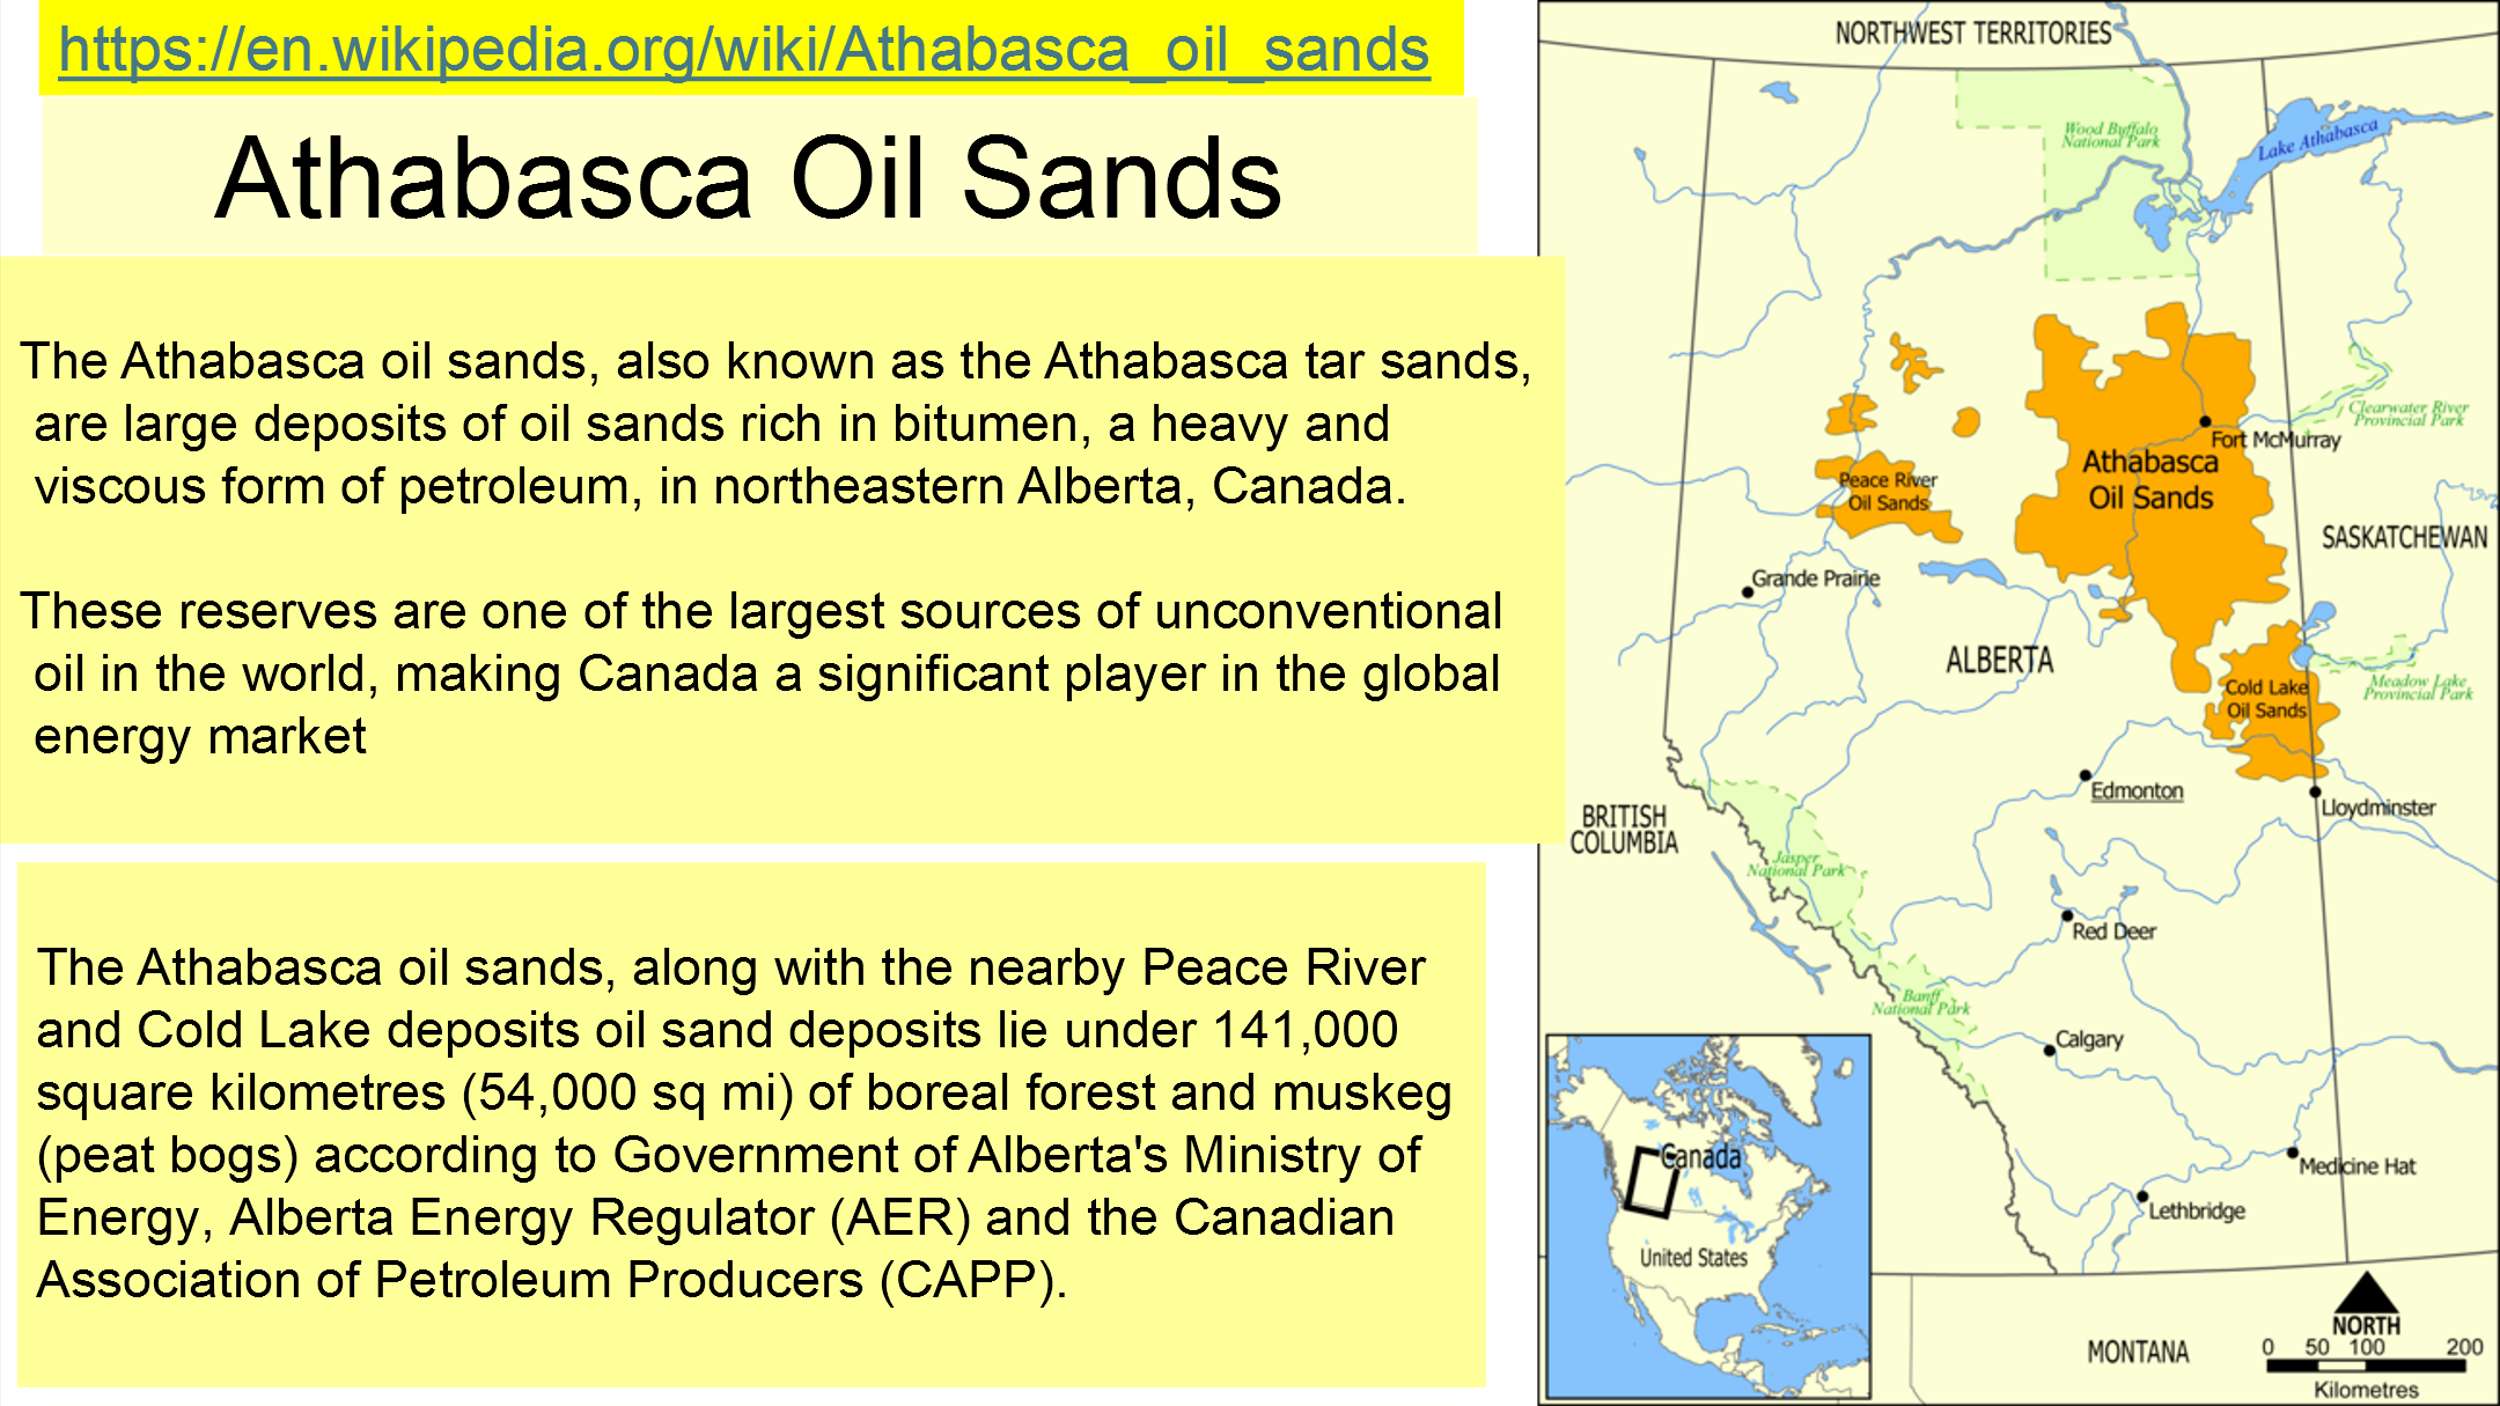
Another unconventional source of oil from North America comes from the Athabasca Oil Sands of northern Alberta; for good reason, sometimes they are called the Athabasca Tar Sands. The oil sands formation varies from 130 to 200 ft. thick lies atop a layer of limestone and is itself overlain by a 3ft to 10 ft thick layer of muskeg, sometimes called peat bog. For this reason, the Athabasca Oil Sands are easy to access. Further, as a result of the easy accessibility, the world’s first oil-sands mine was in the Athabasca oil sands. Figure 17 below contains a map showing where this deposit lies.
After much trial-and-error experience over the past 50 or so years, large operations today (In-Situ Surface Mining) employ shovel-and-truck operations using the biggest power shovels (at least 100 short tons) and dump trucks (400 short tons) in the world. This has held production costs to around US$27 per barrel of synthetic crude oil despite rising energy and labor costs.
After excavation of the tar sand, and transport to the pre-processing area, hot water and caustic soda (sodium hydroxide) are added to the sand in this step. The resulting slurry is piped to the extraction plant where it is agitated, and the oil is skimmed from the top. The bitumen is close to tar in our experience and consists of very long hydrocarbon chain molecules leading to its stiffness and stickiness. Provided that the water chemistry is appropriate to allow the bitumen to separate from sand and clay, the combination of hot water and agitation releases bitumen from the oil sand and allows small air bubbles to attach to the bitumen droplets. The bitumen froth floats to the top of separation vessels and is further treated to remove residual water and fine solids.
Recent enhancements to this method include Tailings Oil Recovery “TOR” units which recover oil from the tailings, Diluent Recovery Units to recover naphtha from the froth, inclined plate settlers (IPS) and disc centrifuges. These allow the extraction plants to recover well over 90% of the bitumen in the sand. The now-spent sand is returned to the mine site and reclaimed in processes not too different from those strip-mining reclamation processes we in the US find in Appalachia.
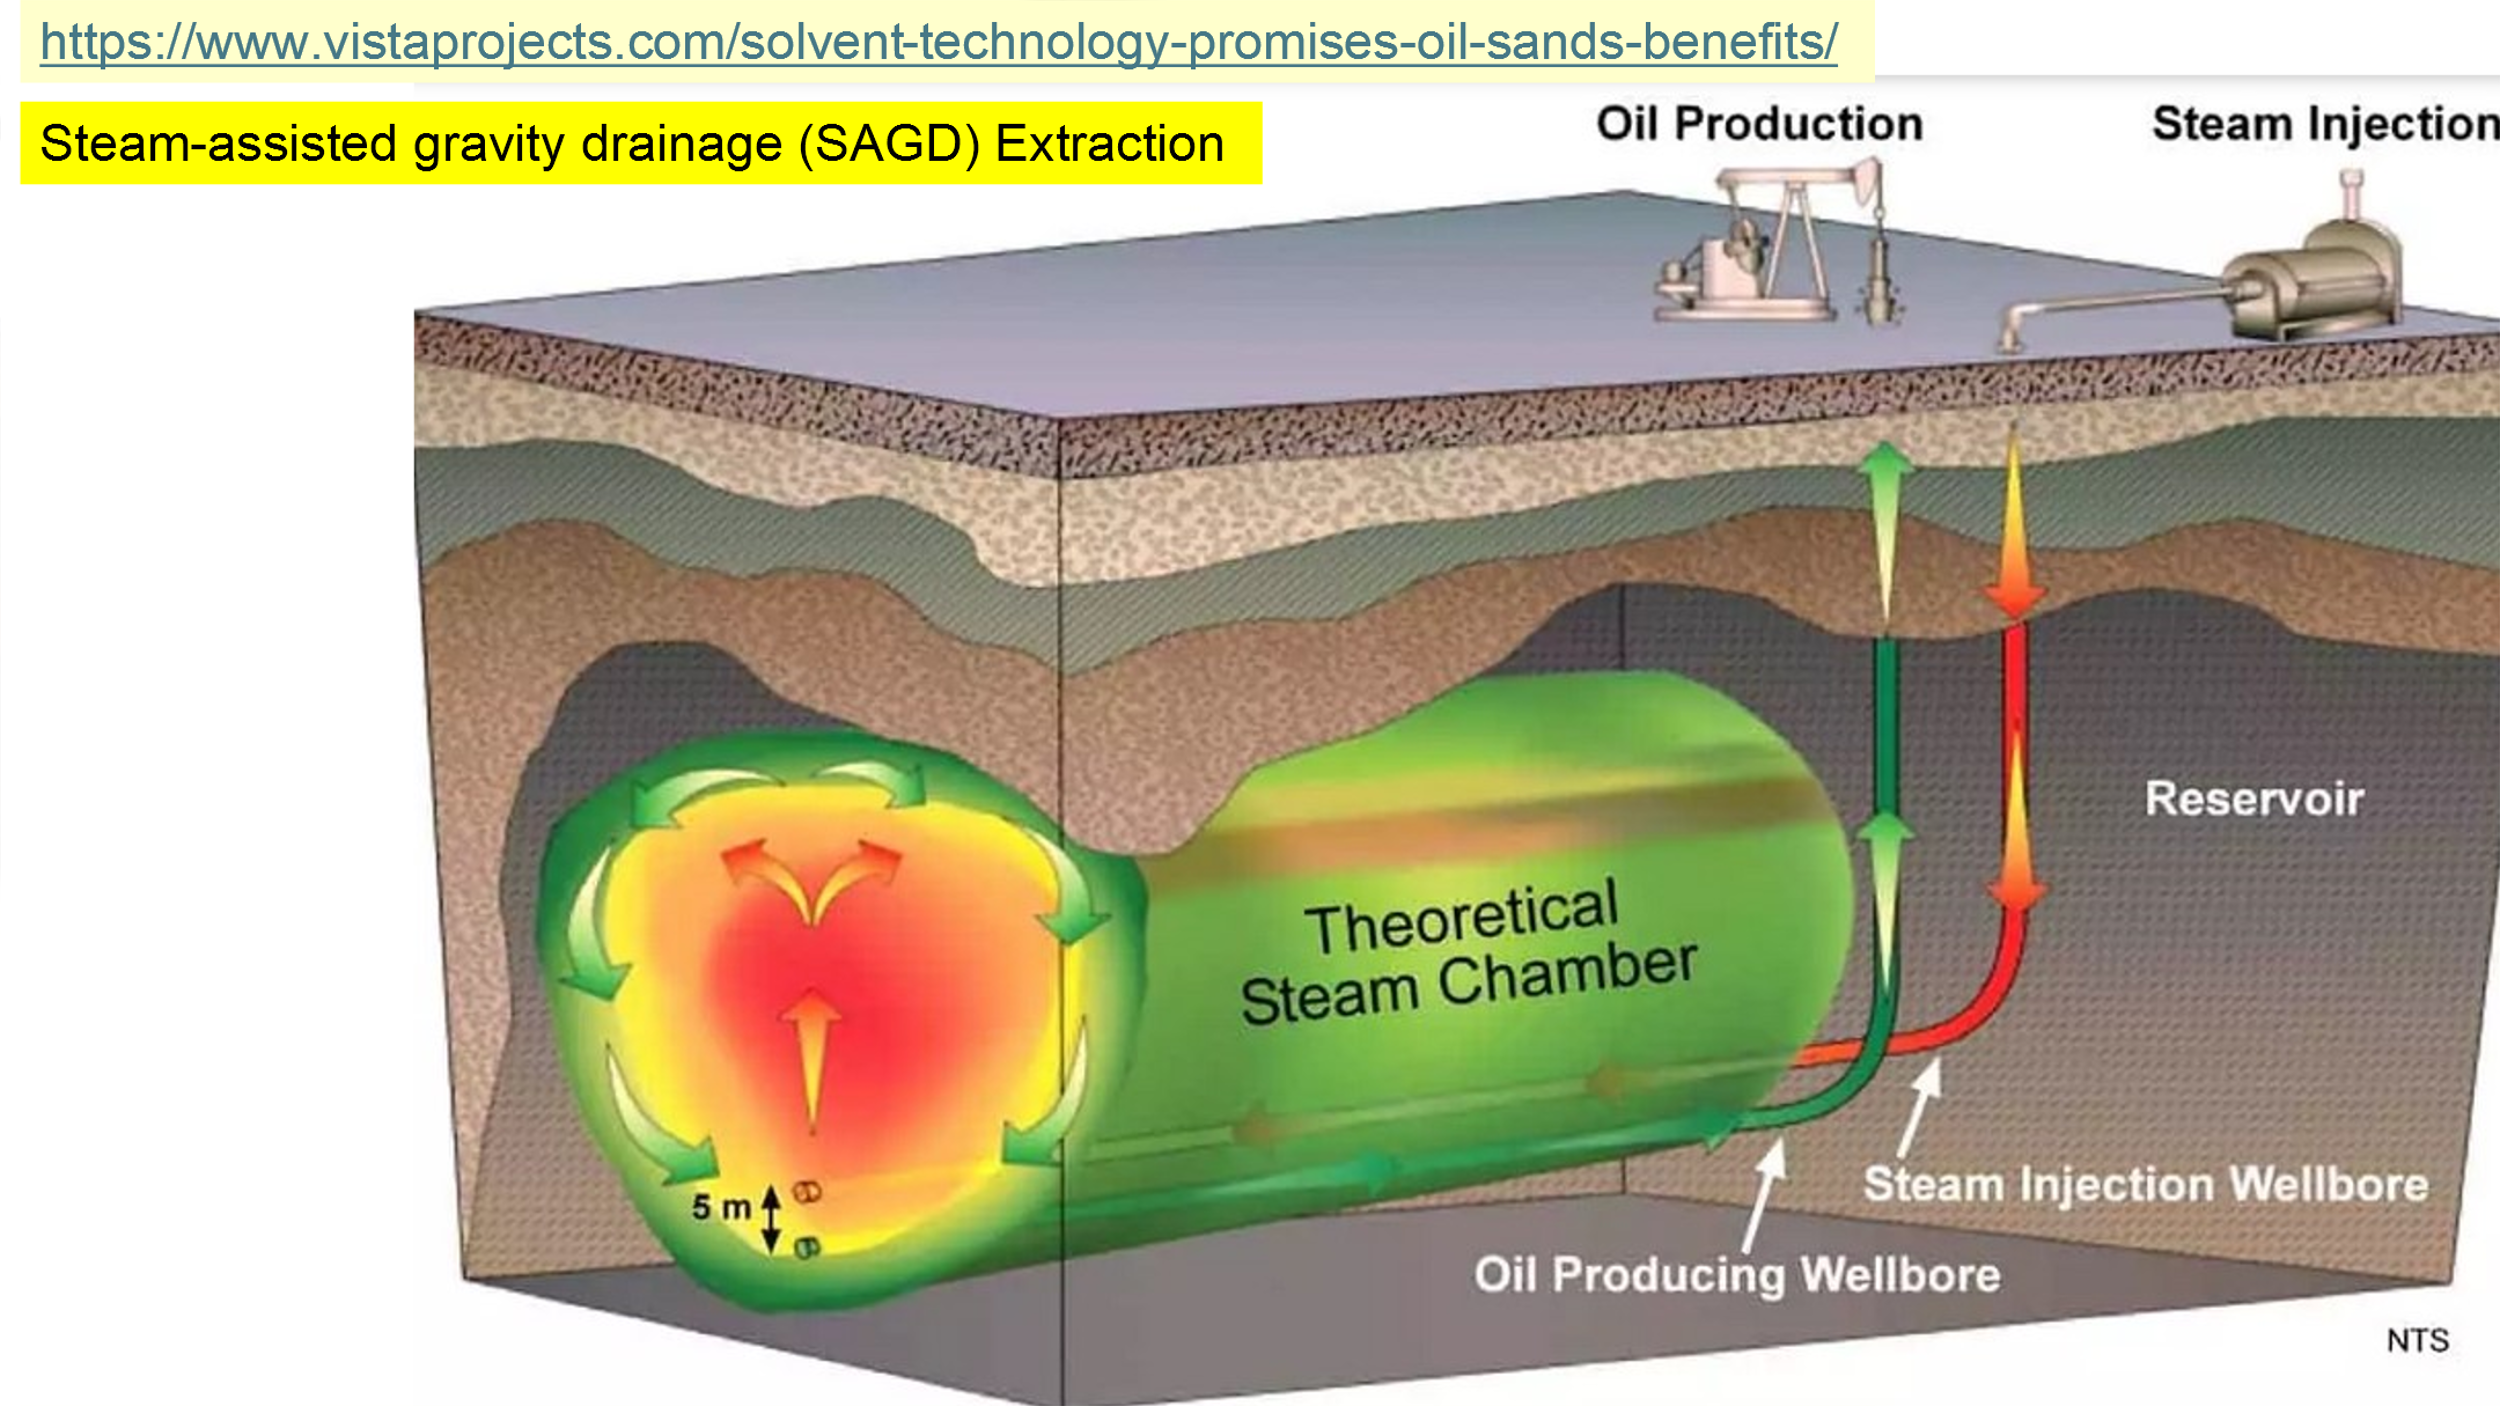
Steam-assisted Gravity Drainage, SAGD. There is also another in-situ method of mining where the bitumen-containing sands are heated underground burning natural gas, and the bitumen separates from the sand underground, drips down into the unconsolidated sediment to be then pumped to the surface in what is similar to a conventional crude oil pumping process. The name for this extraction methodology is Steam-assisted Gravity Drainage, SAGD. A graphic showing the layout for this methodology is in Figure 18, below.
By one estimate, if 30% of the Alberta Oil sands could be extracted, it could supply the entire needs of North America for over 100 years at 2002 consumption levels.
“These deposits represent plentiful oil, but not cheap oil. They require advanced technology to extract the oil and transport it to oil refineries.”
Why the difference between the Green River Formation and the Athabasca Oil Sands?
This next paragraph comes from this source:
“The oil sands of the Western Canadian Sedimentary Basin (WCSB) are a result of the formation of the Canadian Rocky Mountains by the Pacific Plate overthrusting the North American Plate as it pushed in from the west, carrying the formerly large island chains which now compose most of British Columbia. The collision compressed the Alberta plains and raised the Rockies above the plains, forming mountain ranges. This mountain building process buried the sedimentary rock layers which underlie most of Alberta to a great depth, creating high subsurface temperatures, and producing a giant pressure cooker effect that converted the kerogen in the deeply buried organic-rich shales to light oil and natural gas. These source rocks were similar to the American so-called oil shales, <The Green River Formation, previous> except the latter have never been buried deep enough to convert the kerogen in them into liquid oil.”
CONCLUDING REMARKS
What have we learned?
Despite our European friends’ headlong pursuit of ‘net Zero’ CO2 emissions, as they attempt to “decarbonize” their economies, they are destroying the chemical, electrical, industrial, and commercial bases of their economies. Henry’s Law from 175 years ago shows that Temperature Controls <CO2>. The rise of concentrations of atmospheric <CO2> is benign, temperatures are not as warm as they were in the Medieval Warm Period, when grapes grew in and near London, and streets such as “The Vinery” in London were named.
The ready availability of hydrocarbon fuels, coal, oil, and natural gas has allowed our modern lifestyles with ready availability of power for our homes, automobiles, health care, and transportation throughout the US, and trans-continentally. Early and continued cries of “End of Oil” and other stories have not panned out. As we have learned more about earth and energy sciences, more opportunities for inexpensive energy for industrial and consumer use have appeared.
Now is a good time to repeat a sentence from earlier in this post:
Globally, coal use has continued to increase, led by China, but also India, and the rest of Asia. Despite the smiling photo op of Presidents Obama and Chairman Xi on 3 Sep 2016 in front of an image of China’s Great Wall and a sanctimonious-sounding statement from the US Embassy, China’s coal use has continued to increase. This is just not me saying this, it has been published by Climate Central, the New York Times, TIME, Bloomberg, the UK Daily Mail, and Reuters.
While the makeup of the different hydrocarbon components of the Voronoi Diagram of Figure 10 has changed over recent times, there are immense deposits of hydrocarbons in the Green River Formation and the Athabasca Oil Sands of Alberta.
Human knowledge seems to be expanding dramatically. For an example, when I graduated from Rutgers as a Geology Major in 1962, the entire field of Plate Tectonics was unknown. To bet that there will be no scientific and/or engineering breakthroughs that will allow extraction from the Green River Formation and the Athabasca Oil Sands in the decades ahead seems foolhardy and ill-informed. Nearby, the immense reserves of Venezuela only need careful management to provide lots more crude oil.
Notes of caution, however.
The current fascination with Artificial Intelligence seems to me to place excessive emphasis on machine learning, while many of our younger generations seem to have little to no critical thinking skills.
The widespread belief in the mainstream media, universities, especially state universities, that CO2 emissions control climate is held in this country.
Outright stupidity, ignorance, and bias of the purveyors of Wikipedia in, for instance, https://en.wikipedia.org/wiki/Climate_change_denial, and this phrase,
“extensive evidence for anthropogenic global warming that has led to a scientific consensus on climate change.”
Consensus is for politics, while science is about facts, measurements, observations, and data. That Wikipedia cannot understand this, or does not wish to understand this, is an example of brain rot all too common in society today.