. . . and claims they were “human-caused by <CO2-fueled> climate change.”
Robert W. Endlich
INTRODUCTION
This analysis examines the causes behind the catastrophic January 2025 fires in Los Angeles by exploring both environmental triggers and human failures that contributed to the disaster. There are two main parts to this analysis, which are described below.

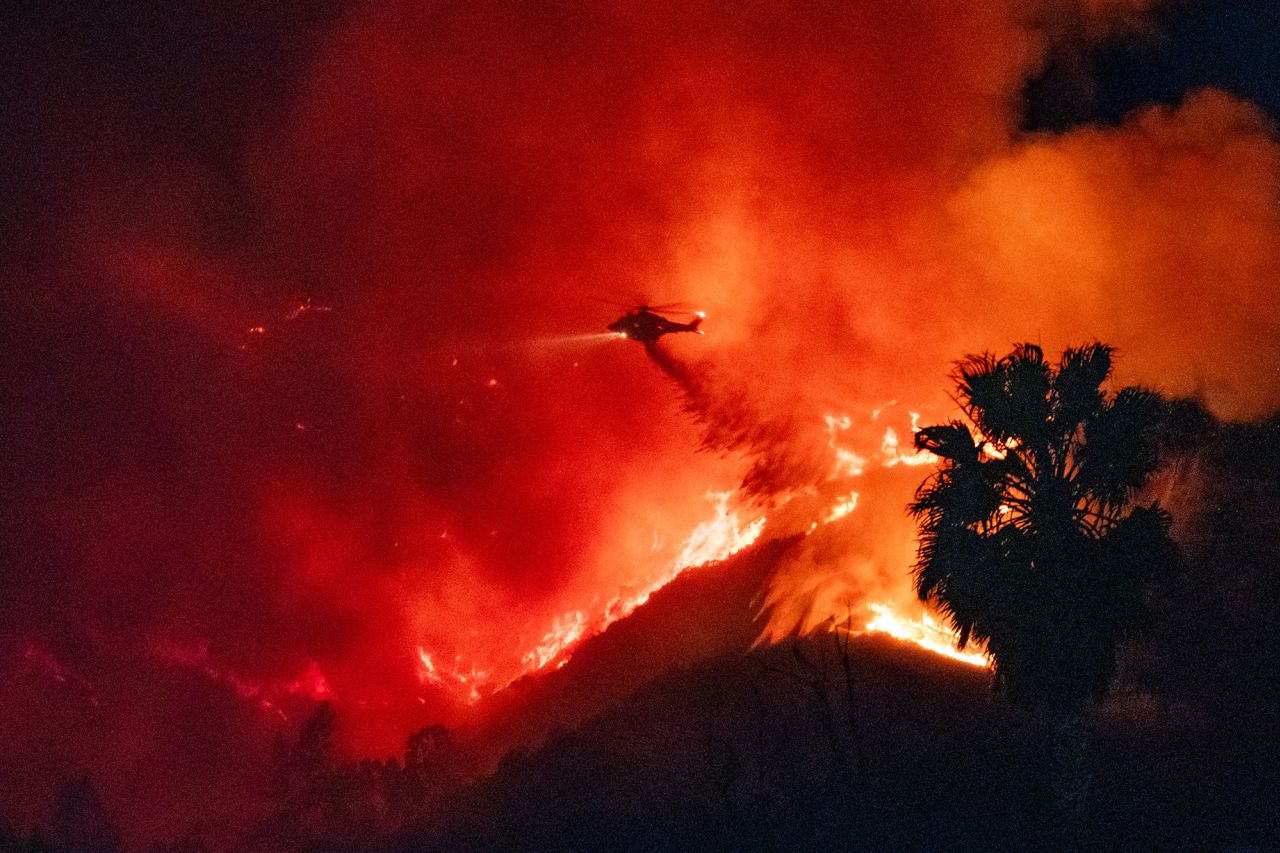
Section A provides an analysis of the extant climate today, and the weather and fire events which unfolded in Los Angeles during the early days of January 2025.
The first of several catastrophic fires began and continued during an extremely powerful (and well-forecast) Santa Ana Wind event.
The analysis here reveals a diagnostic pattern for these types of fires found in the sea surface temperature time series in the Nino 3.4 Region along the equator. When that pattern shifted from El Nino to La Nina, Los Angeles’ (and other southern California regions) rainfall surplus changed to rainfall deficit, drying the lush winter and spring plant and grass growth.
This drying vegetation, in turn, led to extreme wildfire danger. The pattern change in both Nino3.4 region sea surface temperature and SoCal rainfall character change is a fire danger marker, and we see it is frequently both diagnostic and prognostic.
Section B describes the human and government errors which allowed wildfire danger to become the multiple wildfire catastrophes of January 2025. The phrase “human and government errors” refers to a long cascade of actions and inaction which led to those fire catastrophes. Elements of this cascade include:
(1) Failure to maintain the firebreaks between the upland forested hills and the lowland city residential areas,
(2) Failure to maintain the forests themselves,
(3) Inoperable Los Angeles fire engines, down for maintenance for an extended period,
(4) Failure to repair the floating cover over the 120-million-gallon Santa Ynez reservoir,
(5) The deliberate failure to refill the Santa Ynez reservoir with water, and
(6) Cuts to Los Angeles’ Fire Department budget. Further, in the hours preceding ignition of the Palisades fire, even after NWS Los Angeles issued an “Extreme Fire Risk” forecast, the Los Angeles Fire Department did not forward deploy their engines and personnel into the anticipated fire danger area, despite this proactive stance having previously been taken by this same department ahead of Los Angeles’ 1961 Bel Air Fire.
SECTION A. LOS ANGELES’ CLIMATE
At Latitude: 33°56′ N, Longitude: 118° 24′ W, Los Angeles is a geographically complex area, a low-lying basin adjacent to the Pacific Ocean with hills, mountains, beaches, valleys and a huge urban landscape. Los Angeles is the second largest city by population in the USA. Figure 1, taken from Slide 66 of the presentation graphics. shows a map of this area, with black coloring over the burned areas after the devastating Jan 2025 fires.

In describing Los Angeles’ climate, the important weather diagnostics of Los Angeles and southern California, which led to these fires, are best described using the data displayed in Figure 2 below, which in turn came from Slide 13 in the presentation graphics here.
From September through April, weather and climate are dominated by westerly winds aloft which bring in low pressure storms from the west; some of these lows bring rainy periods and are typically followed by high pressure and fair weather. During May through August, when the subtropical ridge of surface high pressure moves overhead, strengthens, and dominates, there’s almost no precipitation. The subtropical ridge is the weather feature which causes the predominantly warm and sunny conditions of the Sun Belt states in the USA.
Referring to Figure 2, the green (monthly rainfall) bars show a “Winter Wet, Summer Dry,” or Mediterranean Climate.
At the end of summer, the subtropical ridge weakens and retreats equator-ward, to be replaced by the Westerly Winds.
When the cool seasonal progression of low-pressure systems ensues, the following high-pressure systems bring cooler air from subpolar regions into the USA, and, importantly, into Nevada. This is critically important. High pressure over Nevada causes development of the Santa Ana Wind family in southern California.
When these high-pressure systems invade Nevada, the ensuing pressure gradient drives strong, dry, north to easterly down-slope winds into California, and these Santa Ana Winds warm dramatically when they descend.

ENSO DRIVES AND DOMINATES LOS ANGELES’ RAINFALL
ENSO is short for “El Nino Southern Oscillation,” the circulation patterns which control precipitation and temperature distributions over vast areas of North America, and, notably, the Los Angeles region. A previous post and presentation on this topic from June 2021 provides an overview of ENSO.
Figure 3 below shows the Wet Weather pattern from California to New Mexico to Florida and up the East Coast to Virginia when the El Nino pattern dominates.
In the case of the January 2025 Los Angeles fire disaster, there was a pattern change from El Nino Wet in Winter 2024 to La Nina Dry in Autumn 2024. This pattern change drove the changeover from Wet, with lush grass and vegetation growth, to La Nina Dry, extending the “Summer Dry” weather conditions for months, even into early January 2025.

The pattern change from El Nino to La Nina conditions occurs rapidly.

The principal diagnostic for ENSO in North America is the Ocean Nino Index, or ONI. The ONI is the mean temperature departure from the long-term mean for the Nino 3.4 region of the Pacific Ocean astride the Equator, described in the next two graphics. Figure 5 below, taken from Slide 44 of the presentation graphics, shows the map which defines the Nino 3.4 region: 170W to 120W, and 5S to 5N of the equator.

IMPORTANCE AND USE OF OCEAN NINO INDEX
Each point in the ONI time series, plotted in Figure 6 below, is the difference between a three-month running average of the sea surface temperature, SST, averaged over the Nino 3.4 region and the long-term SST average for the same three months. It is the value of the Ocean Nino Index, ONI, at a particular time, and the time series of the ONI which are the tools which help us diagnose and even predict the resulting ENSO-pattern affecting much of North America.
When the ONI is greater than 0.5, temperatures in the Nino 3.4 region are distinctly warmer than the long-term average, and El Nino conditions are present. The horizontal red lines in Figure 6, viz., 0.5, 1.0, 1.5, 2.0 and 2.5 show higher values. Each indicates the number of degrees C warmer than the long-term average of SSTs observed over time in the Nino 3.4 region.
When the ONI is colder than -0.5, temperatures in the Nino 3.4 region are distinctly colder than the long-term average, and La Nina conditions are present. The horizontal blue lines in Figure 6, viz., -0.5, -1.0, -1.5, -2.0 and -2.5 show higher absolute values. Each indicates the number of degrees C colder than the long-term average of SSTs observed over time in the Nino 3.4 region.

The pattern that jumps out of this ONI time series chart is the repeated rapid fall-off from a strong El Nino, with a peak in the moderate to strong El Nino region, rapidly falling into a La Nina. From our look at this in the paragraphs above, this means the weather pattern for Los Angeles, and nearby areas, changes from enhanced Winter Wet to normal summer dry, and the onset of La Nina Dry, meaning well-below average rainfall in the following cool season months.
Notice the similarity between the winter 2024 El Nino /late 2024 La Nina event leading to the January 2025 fire danger, then fire catastrophe and the previous substantial fires of 2017. In 2017, October fires burned the wine-growing areas of California’s Sonoma County and were followed by December 2017’s Thomas Fire west of Los Angeles which burned over 1000 houses. We posted on the 2017 fires here: https://casf.me/weather-not-human-caused-co2-fueled-global-warming-is-responsible-for-2017s-damaging-wildfire-history-in-california-2/. This pattern, the changeover from Moderate-to-Strong El Nino to La Nina, is the marker for many/most large wildfire events in southern California found in this study.
Examining the measured rainfall patterns during these two specific periods ties surface weather features to the ONI values. This tie-in is revealed in Figure 7 below. In 2017 there were copious rains in the winter, leading to luxuriant growth of grasses. Drying occurred in the following summer months, which happens every year, but in 2017 the autumn rains did not start. The extended dry period set the stage for extreme fire danger. Remember, this pattern also occurred in 2024. This pattern is the marker for extreme fire danger in coastal California.

Below in Figure 8 is a comparison between the ONI’s SSTs in the Nino 3.4 region and the University of Alabama Huntsville, UAH, global atmospheric temperature analysis, the Temperature of the Lower Troposphere, often TLT. Perhaps remarkably, the time of the SST peaks in the ONI match up with the time of the global tropospheric atmospheric temperature peaks. But, as we see below, when the trade winds are interrupted, stored warm water in the Western Pacific rapidly moves to the east. This seeming “sloshing” event across the Pacific, warms a large portion of the surface of the huge Pacific, including the Nino 3.4 region. The warmed water is the source of enhanced atmospheric convection, an effect which causes the global average atmospheric temperature to increase.
A brief El Nino description helps explain this: The surface stress caused by the easterly Trade Winds blowing across the width of the Pacific transports, and then stacks up, sun-warmed sea water in the far western Pacific at both the surface and below. This causes sea level there, near Indonesia, on average, to be half a meter higher than sea levels near the Americas.
Interruption of the Trade Winds momentarily stops the surface stress force on the Pacific waters, and allows the resulting mass of stacked up warm water, with that higher sea level, to slosh completely across the Pacific.
This is the El Nino event marker. It temporarily overwhelms the normal upwelling of cold water adjacent to the west coasts of North and South America. As a result, normally cold water, upwelling from the depths on the Americas’ west coasts, is replaced by abnormally warm surface waters. An enhanced flux of water vapor from the newly-warmed ocean surface into the atmosphere occurs. On the desert west coast of South America, normally dry air is replaced by cloudy air and sometimes rain. These rains occur near the time of the Northern Hemisphere’s Winter Solstice, 21 December, and its occurrence, near Christmas, is called “El Nino” or the Christ Child in Spanish.

Examining the temperature time series in Figure 8 above, peaks in the SST in the Nino 3.4 region occur when peaks in global atmospheric TLTs occur, but the peaks in Ninos 3.4 SSTs are some 5 to 8 times larger. Clearly, the flourishing of the grasses in the Winter Wet California coast regions, and their subsequent extended drying when the following autumn-winter rains fail to occur drives the development of high fuel loads, not the long-term increase of global temperatures, which climate Alarmists erroneously attribute to increasing atmospheric <CO2>.
However, on 29 Jan 2025, NPR’s Loren Sommer broadcast, “Here’s how Climate Change Fueled the Los Angeles fires.” Sommer quotes UCLA Hydroclimatologist Park Williams who says that fence posts and logs dry out because of alleged human-caused CO2-fueled “global warming.” But the plot of the US Climate Reference Network’s temperatures shows no warming, as seen in Figure 9 below. Further, it is the pronounced drying of winter-wet lush grasses and chaparral, in the transition from El Nino Winter Wet to Summer Dry to La Nina Dry cool season months, that dries out those lush grasses well within a year’s time. And that drying is a consequence of the extant ENSO-driven climate of coastal California, which comes from the Pacific Ocean SST changes, and is characterized by the ONI temperature sequence. And, pointedly, these variations in autumn rainfall are a consequence of the extant coastal climate, not any long-term warming which might be attributable to increasing atmospheric <CO2>.
Consider this observation when thinking about Loren Sommer’s and Park Williams’ contention that ‘global warming’ of a few tenths of a degree over decades causes the extensive drying and extreme fire risk to vegetation in coastal California. In the USA and probably much of the developed world in temperate lands, no matter the region, if there is a significant rainfall deficit during a single growing season, lawns will turn brown, and crops will fail. Residences and office parks typically have water sprinklers to avoid lawns turning brown, and many farmers worldwide now use center pivot irrigation to avoid rainfall deficit-induced crop loss, especially in the semiarid High Plains of the USA.
Climate Alarmists, in this case NPR’s Loren Sommer and UCLA’s Park Williams are just wrong on this.

JANUARY 2025 LOS ANGELES FIRES AND FORECASTS

In the operational weather community, forecasts are made and disseminated, and records of each are kept. Figure 10 contains an extract of pertinent forecasts issued by the National Weather Service, NWS, office in Los Angeles, in the days leading up to the 7 January 2025 ignitions of the Palisades, Eaton, and Hurst Fires. Their web address is https://www.weather.gov/lox.


Many have written, broadcast, and published online of the devastation of the Palisades, Eaton, and Hurst Fires which started on 7 Jan 2025. An example of “before” and “during” the Palisades Fire is in Figure 13 below.

One direct way to assess the “goodness” of the NWS forecast is a before and after comparison. Figure 14, below, shows such a comparison, using maps.
In the upper right is an inset copy of the 6 January 2025 graphical forecast issued by NWS Los Angeles, showing the outline of the most fire danger in magenta, and, in aqua circles, the population areas most likely to be adversely affected. Figure 14 shows that inset, put directly on the CBS News map showing black color of the burn areas.
The value of the NWS graphic forecast the day before is clear in this comparison. This was an outstandingly good, even great forecast.

PATTERN CHANGE AS PREDICTOR OF WILDFIRE
The time series of Nino 3.4 sea surface temperature anomalies shown below in Figure 15, is provided to compare the potential pattern change “predictor” with actual fire events, which are provided in the text that follows.

1991: October 1991 Oakland Hills Fire. The Oakland Hills fire started from re-ignition of a previous grass fire and was fanned by very strong Diablo Winds, downslope winds, named from the Diablo mountain range–part of the Santa Ana Wind family. Twenty-five people died, 2843 single family homes were burned, and 437 apartment units were lost in the Oakland Hills fire of 1991. The pattern change marker was on full display for this fire.
1997: There were no significant fires. 1997’s El Nino was a “Super El Nino”, and extensive rainfall, often accompanied by flooding, was dominant in coastal California. The presentation graphics, slides 104-106 give examples of the heavy rains and flooding. The pattern-change marker hypothesis fails here, drowned by flooding rains.
2003: Cedar Fire, Oct-Nov 2003, San Diego County: https://en.wikipedia.org/wiki/Cedar_Fire Fifteen people including one firefighter died and 2820 homes and buildings were burned. Santa Ana Winds played a part in the early days of this fire with extreme rates of fire spread. Pattern Change Theory worked well in describing San Diego’s 2003 Cedar Fire.
2009: Station Fire. In late August-early September, 2009, the “Station Fire burned nearly 25% of the land mass of the Angeles National Forest. No Santa Ana Wind event shaped this fire. Low surface winds and extremely low humidity were present. The presence of very dry forest, combined with extremely steep forested terrain allowed plume-dominated behavior,” where,
“the fire’s behavior is mostly controlled by winds generated by the fire’s own plume.”
Pattern Change Theory worked; subsequent Santa Ana Winds are not necessary to provide the “extra oxygen” acceleration. The plume itself generated the necessary strong winds.
2017: As we presented, the Thomas Fire in Southern California occurred in December, 2017, when the usual autumn rains failed to develop, a classic example when the Pattern Change Theory worked. In Winter 2017, there was so much snow in California’s Sierra Nevada range that USA Today reported, on 7 Jun 2017,
“California’s endless winter: 8 feet of snow still on the ground in June.”
But the lack of summer rain so typical of coastal California combined with pattern change and failure of the autumn rain caused rapid drying, specifically, the dry conditions present when the Thomas Fire ignited on 4 December 2017; it was not fully contained until 12 January 2018.
2018: The November 2018 Camp Fire, destroyed much of Paradise, CA. The El Nino of 2016-17 ended a six-year drought and brought welcome rains to that area, and a wet March 2018 added to the grass and other vegetation for fuel. Strong katabatic (downslope) winds, akin to Santa Ana Winds, which developed on 8 November, caused a corroded hook on a PG&E power line to fail. This allowed the live power line to fall to the ground, flash-starting the fire which killed 85 people and destroyed over 18,000 homes and buildings. This fits Pattern Change Theory, but fire ignition was delayed a year. Pattern Change Theory seems to have played an important part in this event.
2025: The trifecta of Palisades, Eaton and Hurst fires, all beginning on 7 Jan 2025, and continuing for days, even weeks, devastated Los Angeles and surrounding areas. Again, Pattern Change Theory worked splendidly.
SECTION B: A LONG CASCADE Of errors
In my research, I found evidence of long-term neglect of California’s and Los Angeles’ forests.
Former Mayoral Candidate Rick Caruso said that brush around Los Angeles had not been managed “for forty years.”
From my 30 December 2017 post, this gem from California’s wine country,
“Gov. Brown vetoed 2016 bill aimed at power line, wildfire safety.”
That story starts,
“A year ago, a bipartisan bill aimed at reducing the risk of wildfires from overhead electrical lines went to Gov. Jerry Brown’s desk. It was vetoed.”
This 2018 piece, from NPR, did not age well. On 17 October 2018, then first-term President Trump visited the site of the 2018 Camp Fire at Paradise, CA, accompanied by then-California Gov. Jerry Brown and Lt. Gov. and Gov.-elect Gavin Newsom.
“There is no reason for these massive, deadly and costly forest fires in California except that forest management is so poor,”
Trump tweeted, threatening to cut off federal funding for forest management.
“Billions of dollars are given each year, with so many lives lost, all because of gross mismanagement of the forests…”
Referring to Figure 16 below, observe the NPR headline’s text,
“Trump Blames Forest Management For Wildfires Again During California Visit,” <bold added>
implies that President Trump had previously advised, maybe told, the California Governor’s Office to clean up both its act and the forests in California….yet the 2018 Camp Fire in Paradise, CA, subsequently happened, and resulted in 85 deaths, 18,404 homes and other structures destroyed, and the subsequent declaration of bankruptcy by Pacific Gas and Electric, PG&E.

In another example, this one from 2020, an NBC News Feature piece argued for change. Instead of simply putting all forest fires out, leading to long-term increases in fuel loads and eventual catastrophic forest fires, the piece includes,
“It’s long past time to shift the focus back to managing healthy forests that can better withstand fire…”
Another pull-quote from that feature:
“Fires have always been part of our ecosystem,”
said Mike Rogers, a former Angeles National Forest supervisor and board member of the National Association of Forest Service Retirees.
“Forest management is a lot like gardening. You have to keep the forest open and thin.”
And, as I write this, late May 2025, the Los Angeles fires of January 2025, were yet another fire disaster whose genesis came from continued failure to maintain forests and vegetation in coastal California, despite warnings from President Trump and National Forest experts.
Here are some stories of ignorance and failure of leadership contributing to Los Angeles 2025 fires:
This 14:06 long Free Press video is from Bari Weiss, who interviewed businessman and former Mayoral Candidate Rick Caruso shortly after the Los Angeles Fires. About the two-minute mark of the video Caruso says that, to put the 2025 Los Angeles fires in context, the area destroyed was 2-1/2 times the area of Manhattan Island in New York City. Caruso says the devastation is personal to him because both a son and a daughter lost homes to this firestorm. After assessing what went wrong, Caruso said people should
“work their asses off to get residents back into their homes, their offices, their schools, their churches and synagogues, and parks,”
partly paraphrased.
Figure 17 below, from Slide 120 of the presentation graphics contains a number of quotes from Rick Caruso.

“A month before fires, L.A. fire chief warned budget cuts were hampering emergency response.”
From that post,
“In a Dec. 4 memo, LAFD Fire Chief Kristin Crowley wrote to the Board of Fire Commissioners that the budget cuts
“have adversely affected the Department’s ability to maintain core operations.””
ABC7NEWS.COM carried more detail:
“Seven months before the uncontrolled Palisades Fire in Los Angeles, the city’s fire department budget for this fiscal year was cut by more than $17.5 million, records show.”
The ignorance and failure of leadership topic was addressed in Slide 131 of the presentation graphics, a copy of which is Figure 18 below:

Despite a history of extensive, even catastrophic previous fire events in Coastal California, no one appears to have presented the fire danger to Mayor Karen Bass… Nor had she requested such.
Elected and appointed leadership had no “fingers on the pulse” on either the insufficiency of the water supply to significant residential areas of Los Angeles, or the number of fire fighting vehicles dead-lined for maintenance.
Indeed, there appears to be a practice of using the Fire Department’s budget as a “piggy bank,” convenient to use these funds for non-fire non-emergency purposes.
There appears to have been no City Staff Organization to present the City’s operational capability to respond to emergency conditions. Nor does one appear to be in the making….
Los Angeles seems to have no organized leadership methodology to incorporate lessons learned from previous Los Angeles Area fire disasters.
The Los Angeles of 2025 did not learn the lessons from 6 December 1961, to forward deploy resources in the face of dire fire weather forecasts.
Beginning 2 January 2025, National Weather Service Los Angeles Office issued increasingly dire forecasts for 7 January 2025, including the Red Flag warning of 5 January and the special statement of Extreme Fire Risk on 6 January 2025. On 7 January 2025 the trifecta of Palisades, Eaton and Hurst Fires exploded on Los Angeles… Mayor Bass was in Ghana at a cocktail party…and her Deputy Mayor for Public Safety had been suspended the previous autumn for calling in a false bomb threat into Los Angeles City Hall.
The phrase “ignorance, incompetence and failure of leadership” does not seem to adequately describe the government negligence here.
OPINION
As the leader of City Hall, it is the duty of The Mayor to organize City workers and other employees, to present to her the operational, maintenance, logistics, labor, financial, administrative, resources, scheduled events, and even the weather, so that she knows the status of the city. She is supposed to be in charge. She should act as if she is in charge.
Having and conducting a daily or several times weekly Ops Briefing, making her aware, might be a good place to start!