Robert W. Endlich
Author’s Note: This is Part ONE of a multi-part post.
INTRODUCTION

James Delingpole is an English writer who has written extensively about the allegedly human-caused, CO2-fueled global warming alarm. Wikipedia calls his writing “climate change denial.” But, Delingpole’s recent Substack post, “Valencia: Man Made Climate Change is REAL Or: Why I No Longer Talk to Climate Sceptics” seems to me, at least, enough of a change in Delingpole’s thought and writing process that I call it his “flawed conversion.”
One of Delingpole’s books is ”Watermelons, The Green Movement’s True Colors,” in which he correctly characterizes the Global Warming Alarmist movement as allegedly Green (conservation-aligned) on the outside, but (Communist) Red on the inside.
So Delingpole’s 5 November 2024 Substack post changes that. James now says that aircraft-generated contrails, which he (and other ignorant and/or deluded individuals) now calls “Chemtrails” are responsible for the strength of 2024’s Hurricane Helene and Hurricane Milton. He also claims 2024’s flooding rains in the Valencia, Spain region were “Chemtrails-enhanced.”
So, now in Substack, James promises to revise Watermelons to say that Contrails are proof, in his new evaluation, that man-made climate change is real.
I met and chatted for a few minutes with James at the May 2010 International Climate Change Conference in Washington, DC, where he was an invited speaker.
BACKGROUND AND CHEMISTRY OF COMBUSTION
There are three main topics that will demonstrate my reasoning. The three are,
ONE, an analysis of the incorrect notion of deliberate and nefarious climate modification through aircraft emissions of Chemtrails (they really are contrails) is plainly wrong.
TWO, the notion that 2024’s Hurricanes Helene and Milton derived their strength from these contrails, and
THREE, the belief that the late October 2024, flooding rains around Valencia, Spain were made worse by aircraft-generated contrails.
I previously wrote about the demonstrably false notion that there is in being an ongoing nefarious effort to dim the sun by aircraft, climate engineering, described by GeoEngineeringWatch.org in their well-produced video, The Dimming. I used an edited version of that post’s graphics in my 16 Nov 2024 presentation to CASF. I encourage readers to watch for themselves at least the first 5-6 minutes of “The Dimming” to see straight away the video’s premise. I show here that this premise is fatally flawed.
In most aircraft we burn fuel for the purpose of providing thrust to power the aircraft’s flight. If you’ve had a First Course in Chemistry, specifically describing the chemistry of combustion in internal combustion engines, you learn that when hydrocarbon fuel is burned, the fuel combines with Oxygen in the air to produce work, CO2, and water, large amounts of water. The chemical reaction equation is,
2<C8H18>(l) + 25O2(g) → 16CO2(g) + 18H2O(g) .
When the engine runs, liquid fuel is burned releasing CO2, carbon dioxide and H2O, water in the gas phase, water vapor. Here (g) means gas phase, (l) means liquid phase.
There is a lot of heat and work also done by the running engine(s) during this reaction.
DIRECT EXPERIENCE IN CONTRAIL FORECASTING
My first operational assignment in the US Air Force was being a Weather Officer at Glasgow AFB, Montana, and a significant portion of my work then had to do with supporting the 91st Bombardment Wing, Heavy, (SAC), equipped with B-52D bombers and KC-135 tankers. Twice every day our Weather Detachment prepared Weather Flight Folders for the aircrews whose duty was to be “On Alert.”
Alert Crews lived in a facility at the end of the runway, so they could scramble/drive to the Alert Aircraft, climb in, power up, contact the Command Post by radio, and, in the event that warning of an impending enemy attack was received, quickly take off. There is a photo of B-52s on Alert in Slide 12 of the Presentation Graphics.
The purpose of the Alert Force crews was to be in position to quickly man their pre-flighted aircraft, which had a full fuel load, and nuclear weapons on-board and be ready for prompt take-off. During the Cold War, our bomber crews had planned routes and targets in Soviet Asia to attack. All they needed were the Emergency War Orders that were to be transmitted by USAF’s Strategic Air Command to the Wing Command Post.
The Weather Flight Folders we prepared included our forecast of takeoff conditions, winds aloft enroute to their wartime refueling areas, winds aloft into their targets in Soviet Asia, and contrail forecasts for Soviet Asia. Each day, during our forecast preparations, we analyzed the upper air balloon sounding from nearby Glasgow International Airport using the Skew-T, Log P thermodynamic diagram. These “Skew-T” charts contained a “contrail overprint.” From the upper air temperatures and humidities, we could easily determine the altitudes where contrails would form. This task was repeated, day after day. We forecasters were on duty 24×7, and the products we prepared supported the SAC Alert crews who also were on duty 24×7.
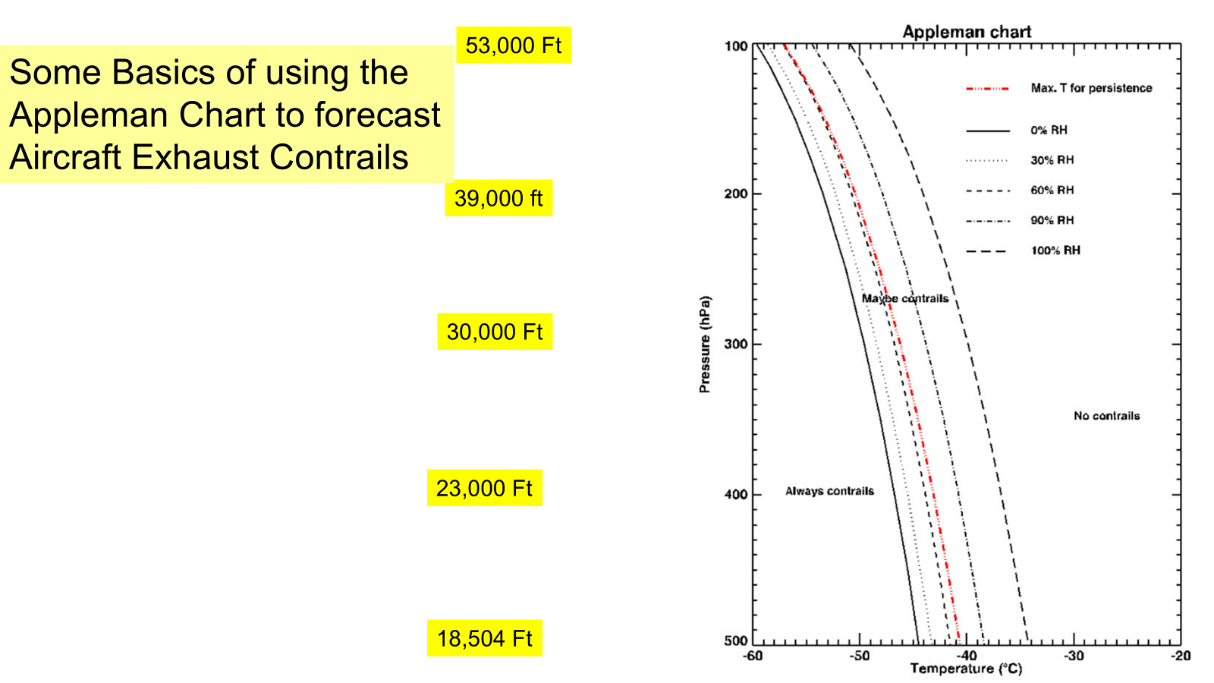
The contrail overprints were the Appleman Curves, based on Air Weather Service Technical Report 105-145, “Derivation of Jet-Aircraft Contrail-Formation Curves,” January 1957, by Herbert S. Appleman.
Appleman’s Curves were derived experimentally: pairs of USAF fighters were launched and climbed aloft over an area and at the time where the Weather Bureau (Now National Weather Service) had launched radiosonde balloons. The second aircraft visually determined the altitude(s) at which contrails formed, their thickness, and whether or not they were persistent.
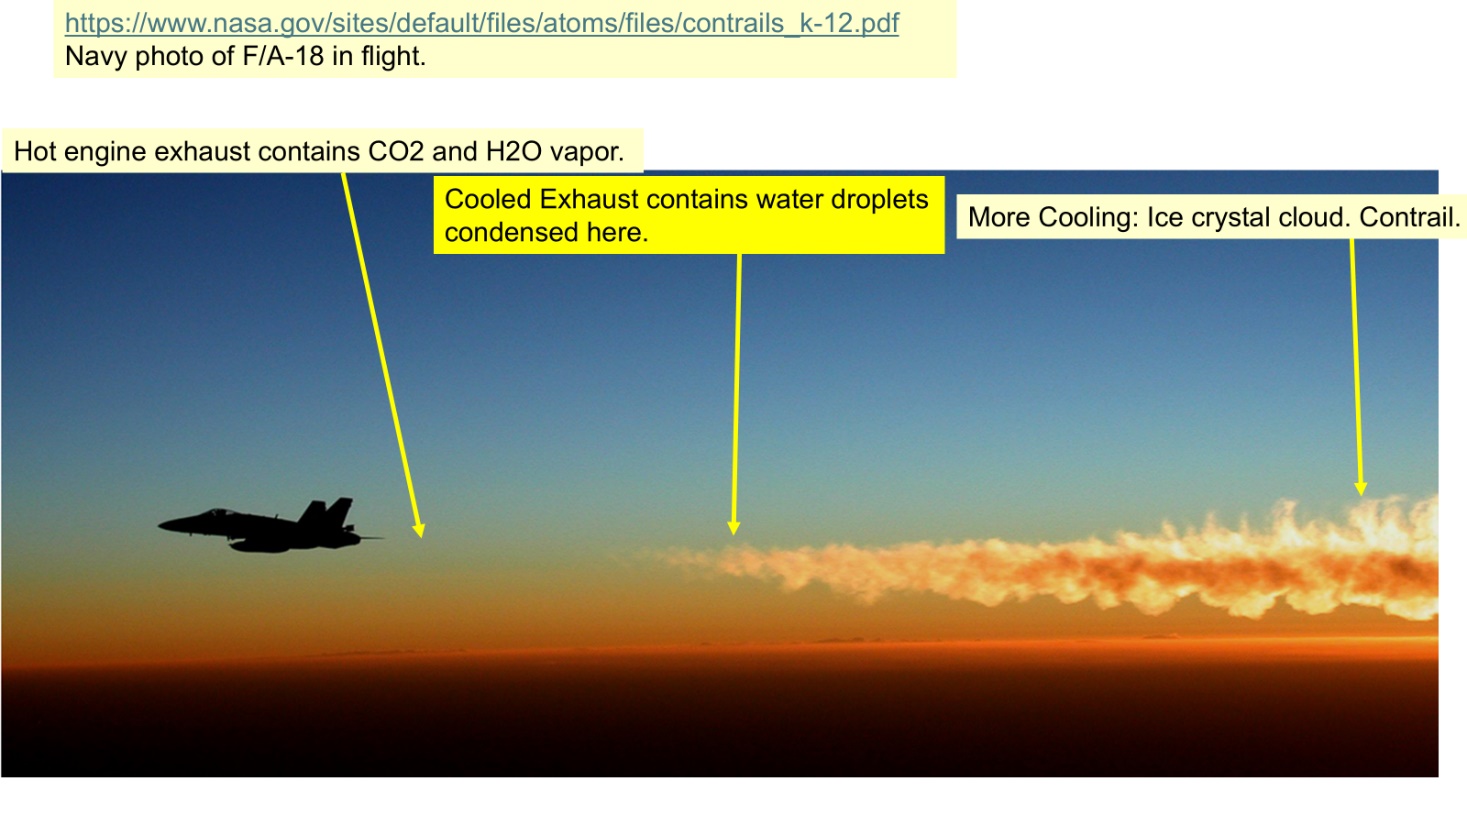
So, for so-called experts’ dialogue in “The Dimming” claiming that what we commonly observe as contrails are not exhaust water, but nefarious “atmospheric dispersions” is demonstrably incorrect. The Presentation Graphics contain specifics but Slide 26, repeated in Fig 1 below, shows the process and sequence of contrail formation.
Below in Figure 2 are the basics of the Appleman Chart and Curves, from Slide 24 of the Presentation Graphics.
GEOLOGY, METEOROLOGY AND DATA SHOW GEOENGINEERNG WATCH IS WRONG
The Dimming’s narrator and Geoengineering Watch lead investigator, Dean Wiginton, claims that Jet Aircraft emit “Sprayed Particulate Dispersions” which are building up in the atmosphere and reducing the amount of sunlight reaching Earth.
Wiginton is just wrong, as the data which follow show. High temporal resolution solar radiation data collected by satellite and ground systems show there is a periodicity or cyclicity in insolation, while lower resolution data taken adjacent to the Black Sea shows solar radiation increasing both ground temperatures and air temperatures over time. The Total Solar Irradiance (TSI) time series from the University of Colorado shows that since the depth of the Little Ice Age in 1690, TSI has been increasing and the 11-year cycle of solar output has been modulating this amount, reflecting the 11-year sunspot cycle.
Geoengineering Watch says in their video that harmful chemicals are being dispersed into the atmosphere by aircraft, including Aluminum, specifically Aluminum Oxide, (AL2O3), and smaller amounts of Barium and Strontium.
In the real world, based on my studies as a Geology Major at Rutgers and experience as a weather forecaster, we commonly observe dust devils, strong thunderstorm outflow winds, and strong especially spring winds. All of these atmospheric mechanisms transport common clay-bearing dust to great altitudes. The principal component of the clay in the dust is the mineral Kaolinite, whose chemical composition can be written Al2O3·2SiO2·2H2O.
So, common atmospheric blowing dust episodes mix clay-bearing dust to great heights. I cite observations of atmospheric circulations that transport these dust clouds from Asia to North America and from Africa to North America. There are satellite-based observations describing African Dust blown into Europe.
The mineral Barite, Specific Gravity 4.3-5 contains Barium, a heavier mineral than Kaolinite which has a Specific Gravity of 2.1-2.6. For this reason, a common use of Barite is as a drilling mud, put down a well to prevent blowout or mixing with fluids found in the drill bore. The extraction of hydrocarbon-bearing gases and liquids, is now even more prevalent through fracturing the “country rock” bearing these hydrocarbons, “fracking.”
As a consequence, drilling mud spread around former drilling sites. In the words of Wikipedia,
“Unlined drilling fluid sumps were commonplace before the environmental consequences were recognized.”
So dried-out drilling mud is a source of barium-containing dust, which also is blown to great heights when dust devils, and widespread blowing dust events, shown in the Presentation Graphics, occur.
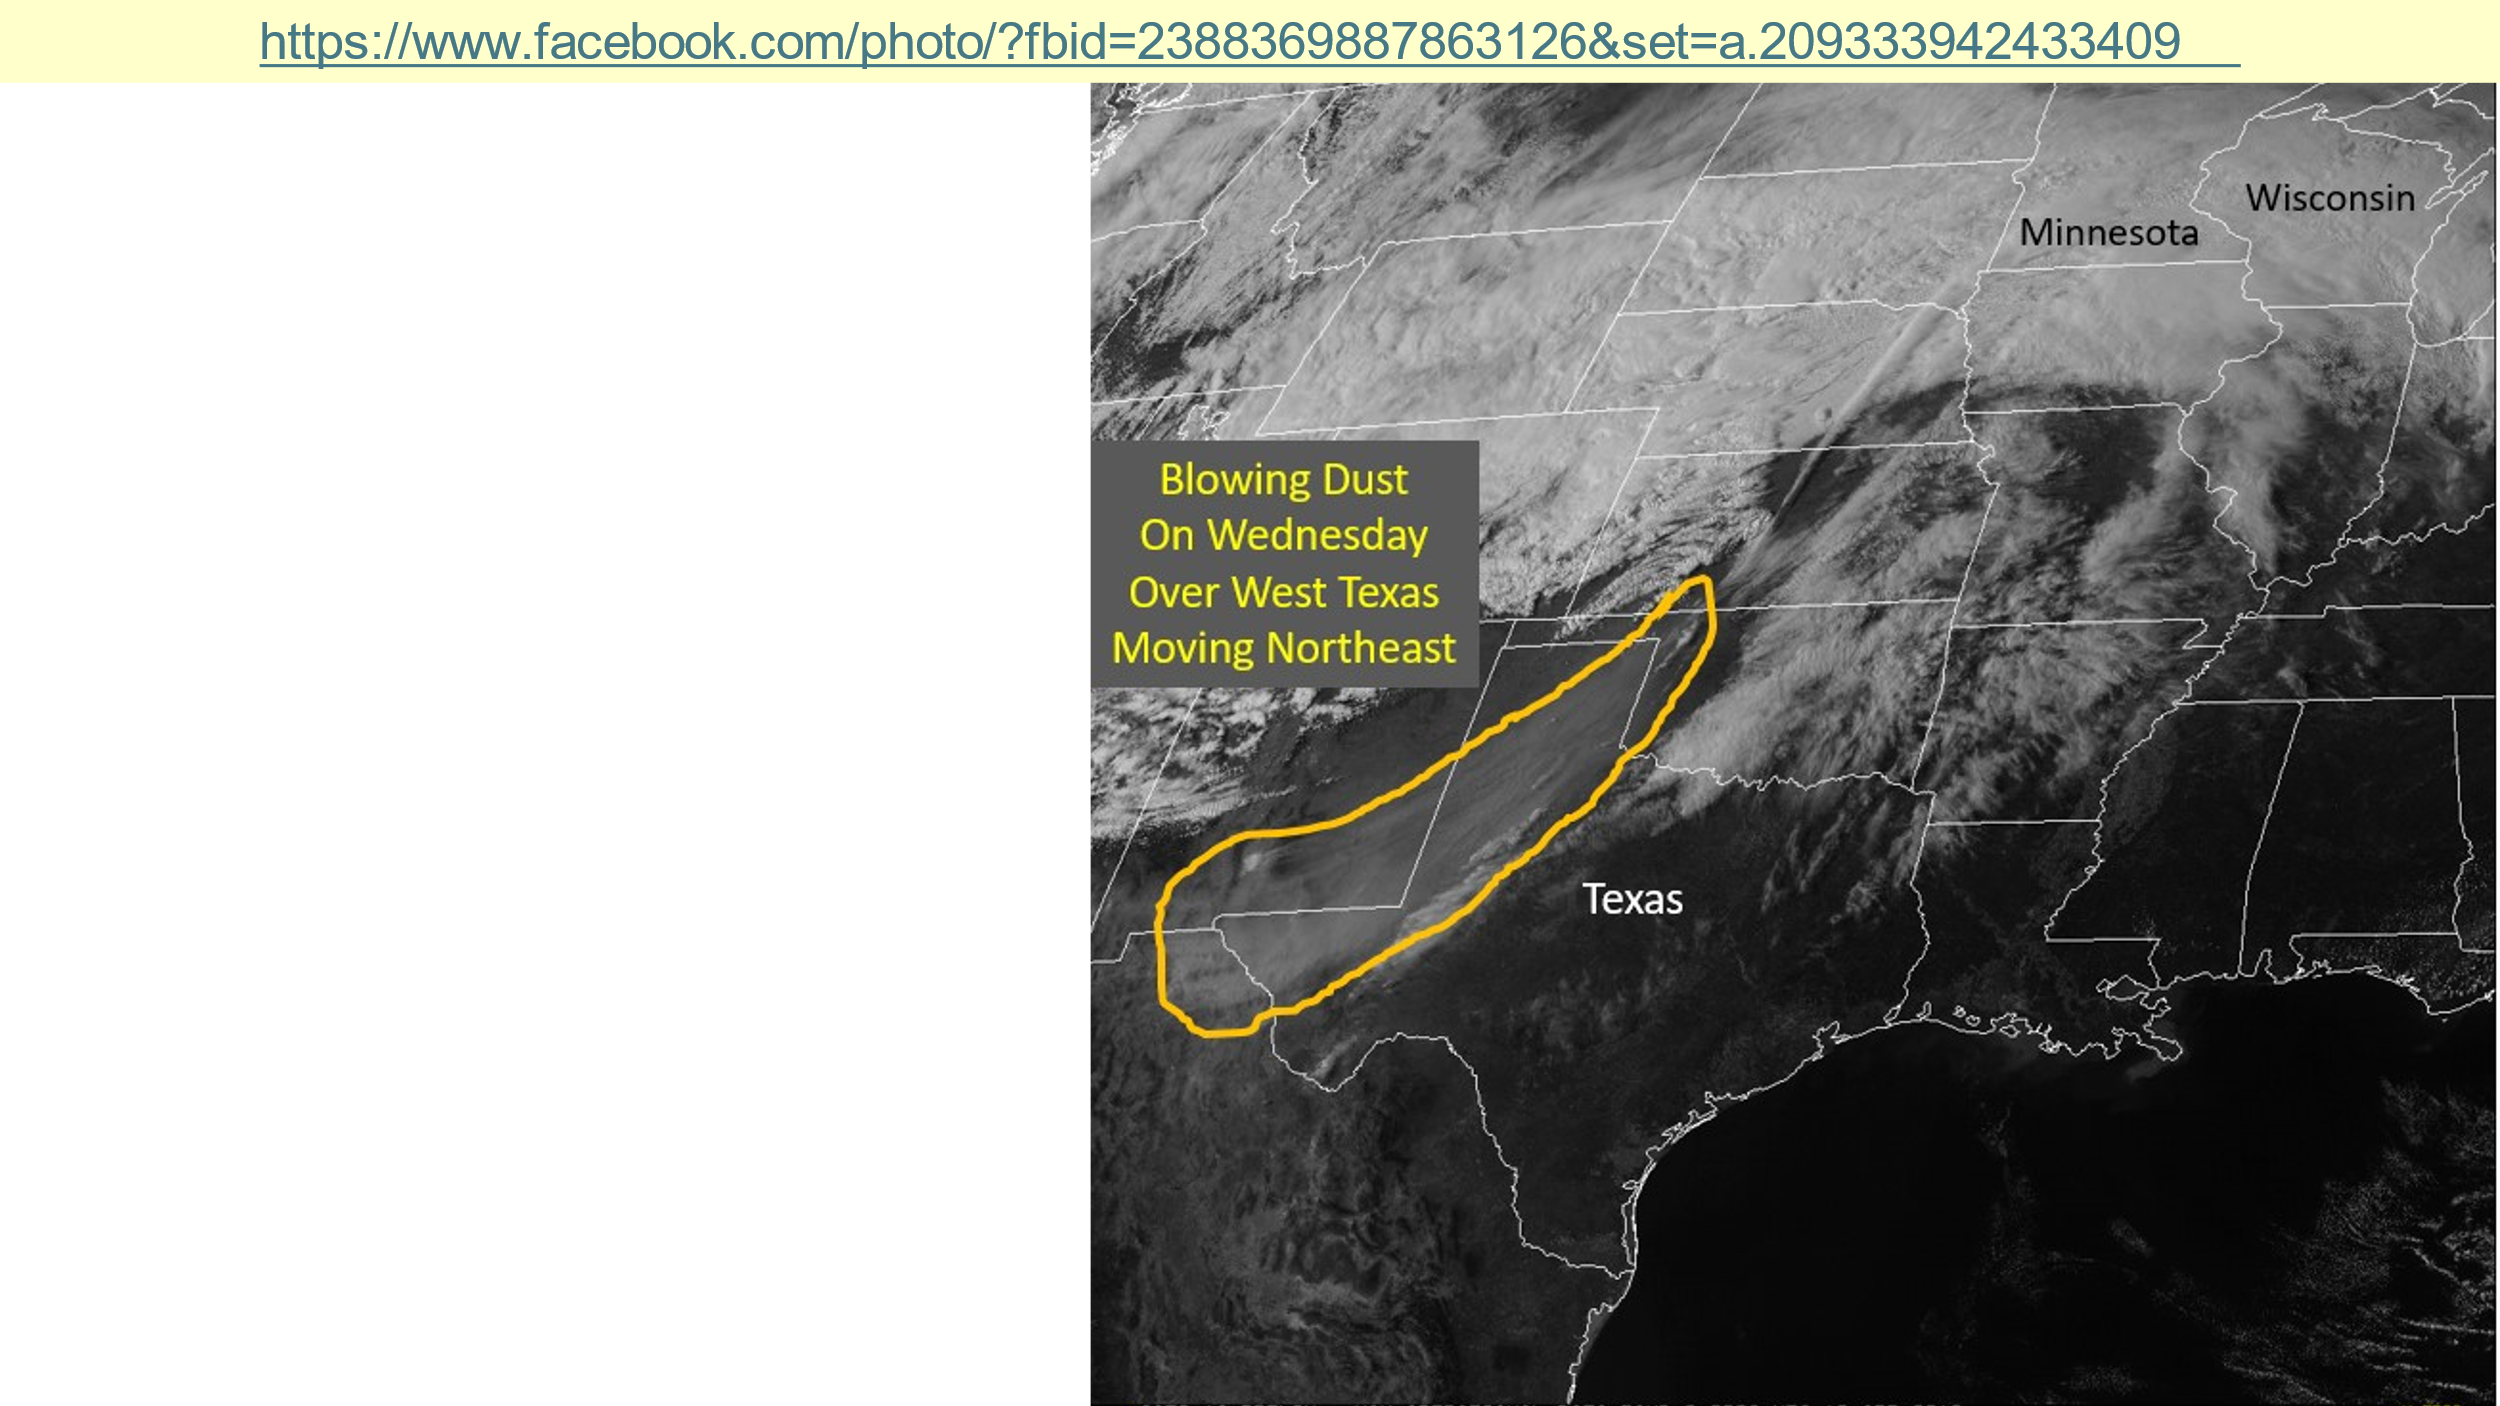
Dean Wiginton’s allegation that spraying from aircraft is responsible for observations of aluminum, barium and strontium aloft in the atmosphere can be explained simply. When granite, granite-gneiss and other common rocks weather, crumble, and decompose, they form Kaolinite, the common mineral in the clay which is a common weathering product of such rocks.
Especially in deserts and semi-arid areas, Kaolinite is common in clay and mud which forms when swift running stream water eventually spreads out on flat surfaces, such as bajadas and mud flats, and dries. Commonly clay-bearing dust forms. Wind-blown common dust from clay containing Kaolinite is lifted when dust devils form and when strong spring winds occur. I have flown sailplanes in thermals associated with dust devils to over 20,000 Ft MSL in New Mexico and Arizona. Aircraft allegedly emitting “Sprayed Particulate Dispersions” are not needed to explain Wiginton’s air sampling results.
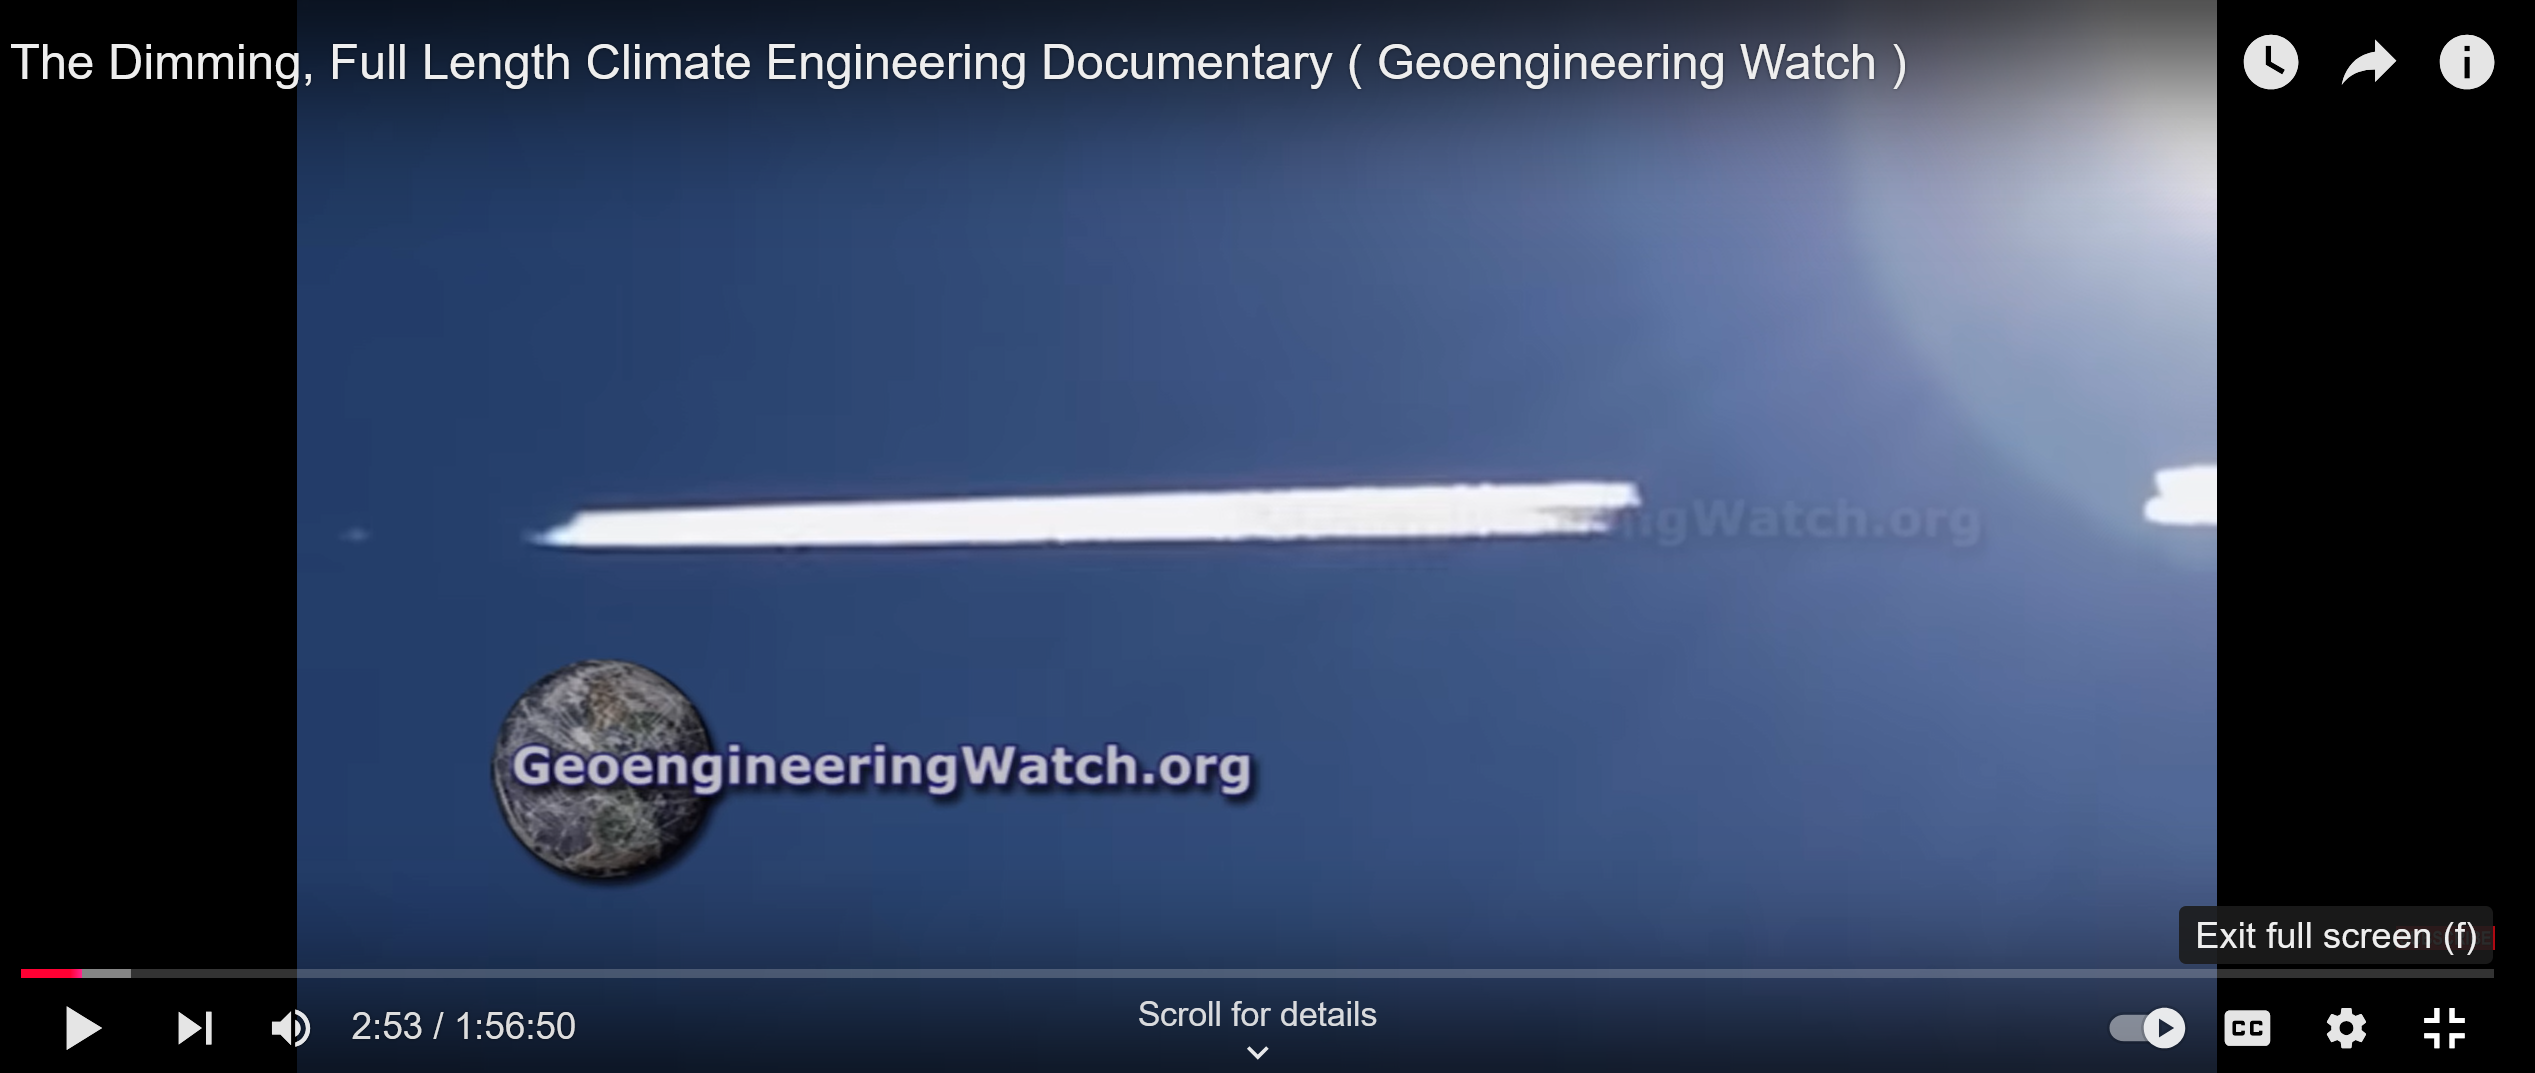
Wiginton shows a video of a contrail being emitted by a B-17 in formation, presumably over WW2 Germany. Suddenly the contrail stops. Wiginton shows this clip repeatedly in the first minutes of The Dimming, claiming that “Beta Testing” of the “Sprayed Particulate Dispersions” was underway.
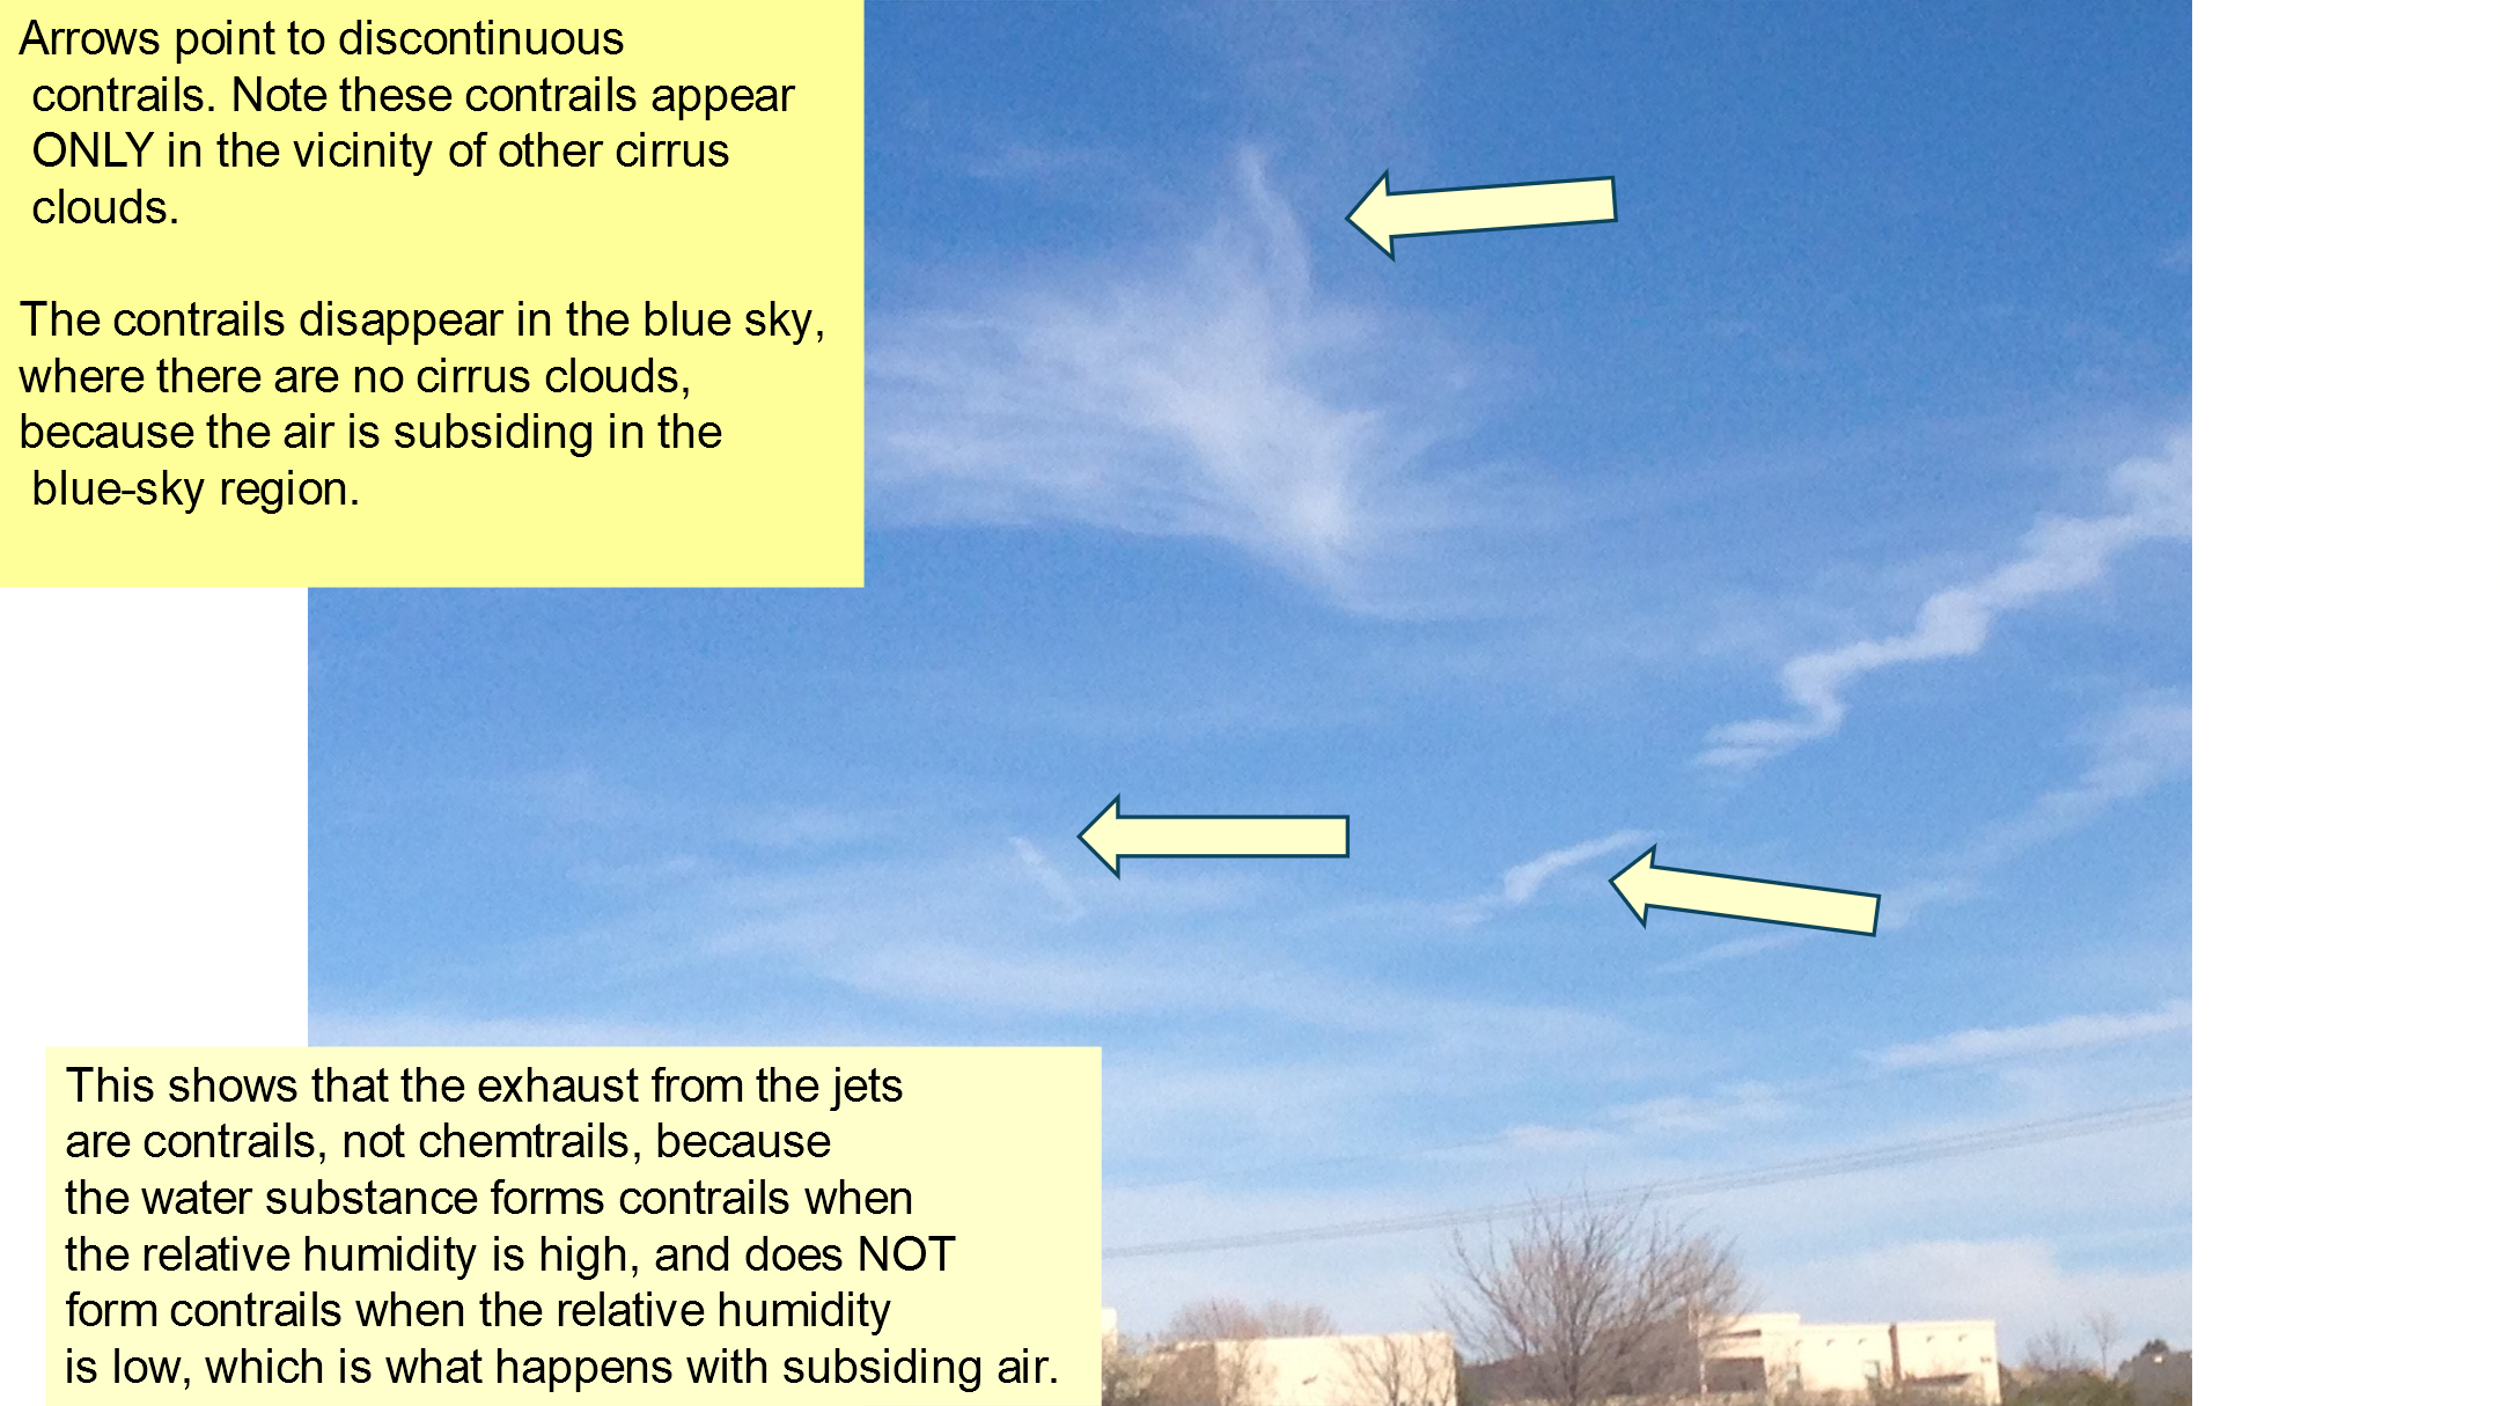
But the sudden starting and stopping of the appearance of contrails can be explained by vertical motions of the atmosphere through which the aircraft is flying. At the 2:53 mark there is one such example.
When “parcels” of air move vertically, the pressure, temperature, and humidity of that parcel change according to the Equation of State of the Atmosphere. When the air is not saturated, for example, dry air not in a cloud, and the parcel is lifted, it cools at the dry adiabatic lapse rate, 0.98 degrees C per 100 meters of lift. If it is pushed down, the dry parcel warms at the same rate.
As the air is lifted, it cools as described above, but in cooling, the relative humidity increases. If there is more lifting, the air’s ability to keep the water as vapor decreases, and eventually, liquid water cloud droplets form. If that air parcel is subsequently pushed down, the air will warm, first at the moist adiabatic lapse rate, until the cloud droplets evaporate, and then further descent will cause the parcel to warm again at the dry adiabatic lapse rate.
Sailplanes are equipped with a sensitive variometer, an instrument which tells whether the sailplane is descending (very noticeable in sinking air) or ascending, in lift, and the rate of climb or sink. Anyone who has flown in a sailplane is familiar with the fact that often the air aloft is rising or sinking, because the rates of sink or rise are visible on the instrument panel, and often indicated with a tone. This video shows the variometer in the upper right, and the tone from the variometer on a flight out of Moriarty, NM, where I flew in the early 1970s.
Especially in winter (with stronger winds aloft) over mountainous terrain, the winds aloft are forced up and down according to the slope and shape of the mountains. Frequently the vertical motions of the air form mountain waves, and when conditions are right, the mountain waves become visible.
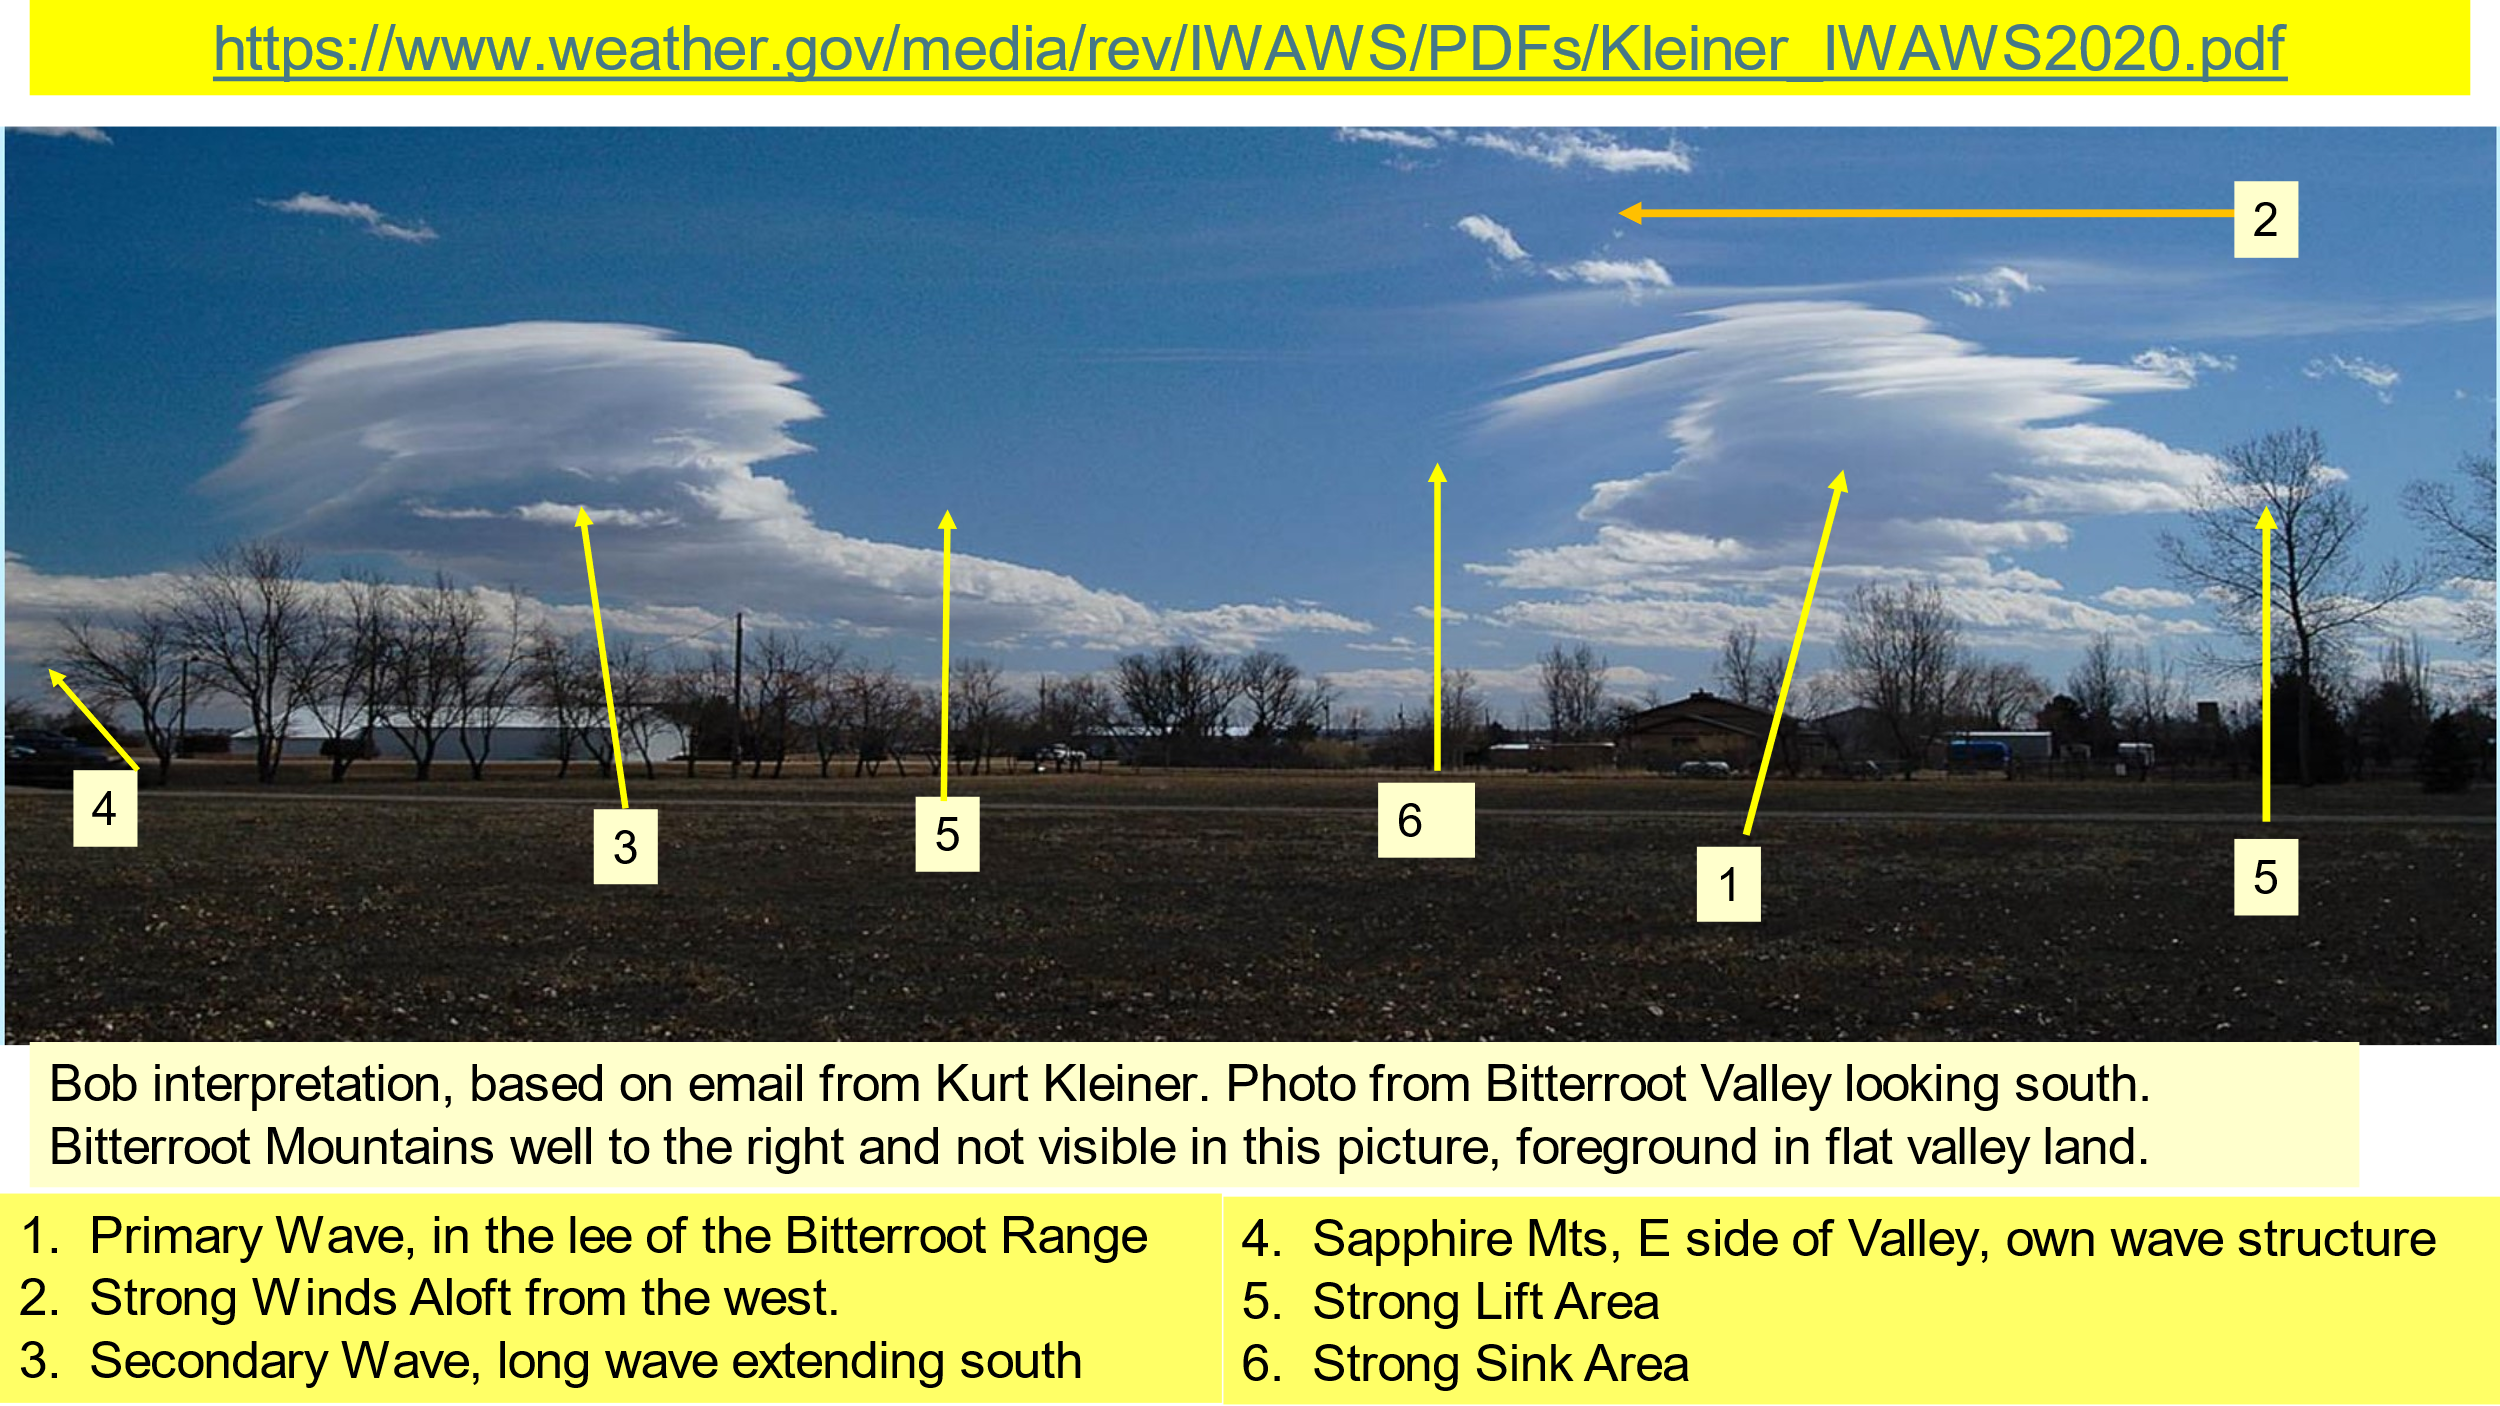
So especially in wintertime, sailplane pilots can see and use mountain waves as sources of lift to stay aloft for long periods of time and to achieve considerable altitudes and fly great distances under these conditions. Areas 5 in Figure 3 above show such areas of good wave lift. I have been fortunate as a sailplane pilot to achieve 23,000 ft MSL altitude in the Sandia Mountain Wave flying out of Moriarty, NM.
At times, mountain wave clouds and contrails co-exist. This becomes the dead give-away that Contrail appearance and disappearances are linked to vertical motions in the atmosphere. These observations show Geoengineering Watch is producing the Wrong Answers.
My sense is that James Delingpole does not have a strong background in Chemistry or the Earth Sciences including Geology and Meteorology. This is one facet in his flawed conversion from skeptic to Alarmist.
In Part TWO of this post, I will establish that Delingpole’s comments regarding directed energy weapons, Hurricanes Helene and Milton, and Valencia, Spain, are out to lunch.
