Going out on a Limb? My September 2026 Forecast: El Nino’s Return, beginning with the upcoming 2026-2027 Winter, Ending the Persistent Drought in the West.
Robert W. Endlich
MY FIRST CLIMATE FORECAST WAS FOR REFORGER 1980 IN COLD WAR GERMANY
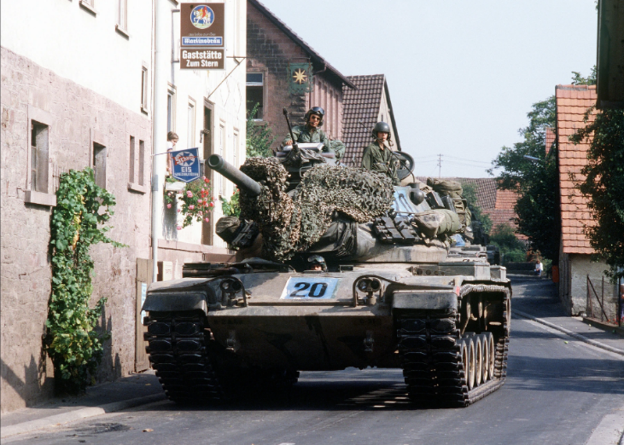
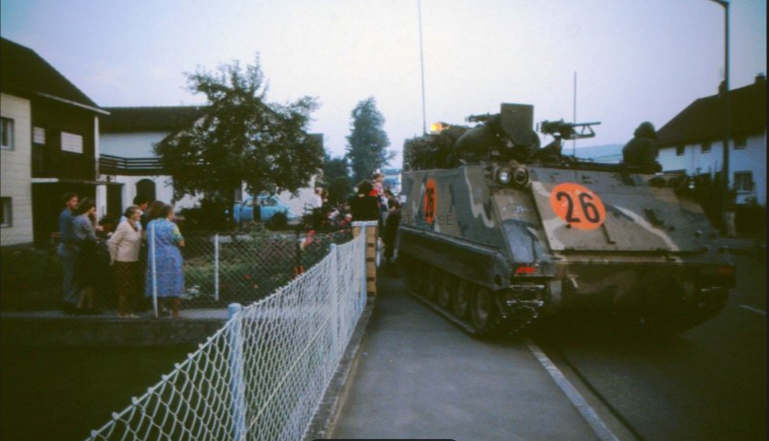
My forecasting career as a Weather Officer in the Air Force and as a civilian Meteorologist for the Army mostly consisted of operational forecasts, usually up to 24-hour forecasts. However, once before, in the months, and later the weeks, prior to the 1980 NATO REFORGER Field Training Exercise, CERTAIN RAMPART, I ventured into forecasting a season ahead. As that exercise was in the planning stages, in Cold War Germany, we in the US VII
Corps were to conduct a field maneuver with troops in the field, putting into practice REFORGER’s name, “REturn of FORces to GERmany,” the promise the US had made to Germany and NATO in the 1970s.
My duty station was in the southern suburbs of Stuttgart, Germany, and my assignment was Staff Weather Officer to VII (US) Corps, at the time, the largest corps in the US Army. In southern Germany, in the winter and spring of 1980, we had experienced the coldest and wettest cold season in the previous 100 years. The ground for our REFORGER 1980 maneuver area was in Bavaria, some 75 miles east of Stuttgart, on both sides of the Danube River. At that point the soil was wet and impossible to use for ground maneuver of the heavy vehicles used by the Army, mostly M-60 tanks and M-113 armored personnel carriers. Spring planting was delayed. As VII Corps began active planning in June, 1980’s harvest at that time was 15 days behind schedule. Those 15 days were the number of days I had calculated, based on the number of “growing degree-days” needed to bring to harvest the hops and corn crops of that part of Bavaria.
I was able to use many of the technical skills and local data arranged by our Partner Corps to the east, II German Korps, in Ulm, and some useful agricultural information I had learned from my undergraduate years at Rutgers. Beginning late June, I prepared weekly briefings and updates on the outlook for the September REFORGER to our Corps Commander, Lt Gen Julius Becton, and the VII Corps Staff.
The atmospheric feature that had caused the cold and wet winter and spring was a stubbornly persistent atmospheric jet stream trough over Central Europe. But by mid-June, that pattern shifted dramatically; sunny, warm and dry conditions prevailed for the next couple of months. Nonetheless, we could gain back only a single growing day in a warm week, so the corn and hops were well behind harvest schedule and in early September remained still growing in the fields, yet to be harvested. The wheat crop, having a shorter growing season, was completely harvested by September.
The reason autumn REFORGER FTXs were scheduled in September was so the tanks, armored personnel carriers and other mechanized vehicles could use dry terrain and terrain masking in active ground maneuver right there in Germany, after the crops were harvested, but before winter’s persistent rain, drizzle, and fog had the chance to turn dry ground into mud. Maneuvering tracked (vs wheeled) armored vehicles in wet ground would have caused extensive maneuver damage, something we tried mightily to avoid. All REFORGER 1980 participants were thoroughly briefed on the importance of minimizing maneuver damage in Germany, our host country.
Well into the exercise, there was a pitched tank battle between the “Orange” Forces (playing Warsaw Pact troops) and the “Blue” Forces, (“our side,” in NATO), conducted in the Bavarian cornfields. The local press took photos with a near ground-level camera’s perspective, making it look as if a single tank path through the still-standing corn was the width of an 8-lane Autobahn. The German press was up in arms, political leaders were upset, and our G5 Civil-Military Affairs Section brought this bad publicity to General Becton, who promptly called a temporary halt to the maneuver and demanded that all maneuver unit commanders attend a special meeting in front of him. He gave them a chewing out, and an in-person demand, “No more maneuver damage!”
Message received. Contents understood.
There was no recurrence.
Fast-forward 45 years:
I retired from the Air Force in 1984, the Berlin Wall fell in 1989, and the Warsaw Pact dissolved in 1991.
A NEW TIME AND MY NEW CLIMATE OUTLOOK:EL NINO WILL SOON RETURN TO THE USA
Today, in September 2026, many in the USA and especially in Germany worry more about “human-caused, CO2-fueled global warming” than threats from a still nuclear-armed but no-longer-Soviet Russia, nuclear-armed China and North Korea, and the distinct possibility that Shia Iran could become a nuclear-weapons-armed Islamic threat to Europe and the United States.
Today, many parallels with those Cold-War challenges exist. I see the need to again make a climate forecast, this time of coming events for the season and seasons to come, to help quell the cries of an ever-deepening and worsening drought, especially in the Mountain West of the USA.
In today’s effort, I can find much technical support available to me, not from an in-person visit to II (GE ) Korps in Ulm, Germany, but by using research results, published by professional colleagues in NOAA, from the Earth Systems Research Center and the Climate Prediction Center. These research results are readily available on the Internet.
While in Cold War Germany, I had direct experience with an at times adversarial and, it seemed to many of us in the military at the time, a deliberately misleading press. Following the links here we can see three specific examples today, from the Los Angeles Times, The Guardian, and msn.com.
Today we have what I consider new adversarial organizations, such as those in Figure 2 below. They are frequently aided by climate activists, in the misguided, and an ignorant but impassioned press, who publish their climate alarmist views.
EXAMPLES OF CONTRASTING CLIMATE STORIES, STARTING WITH MSN.COM ON 21 JULY 2026: HOT TEMPERATURES, DROUGHT, AND LOW WATER.
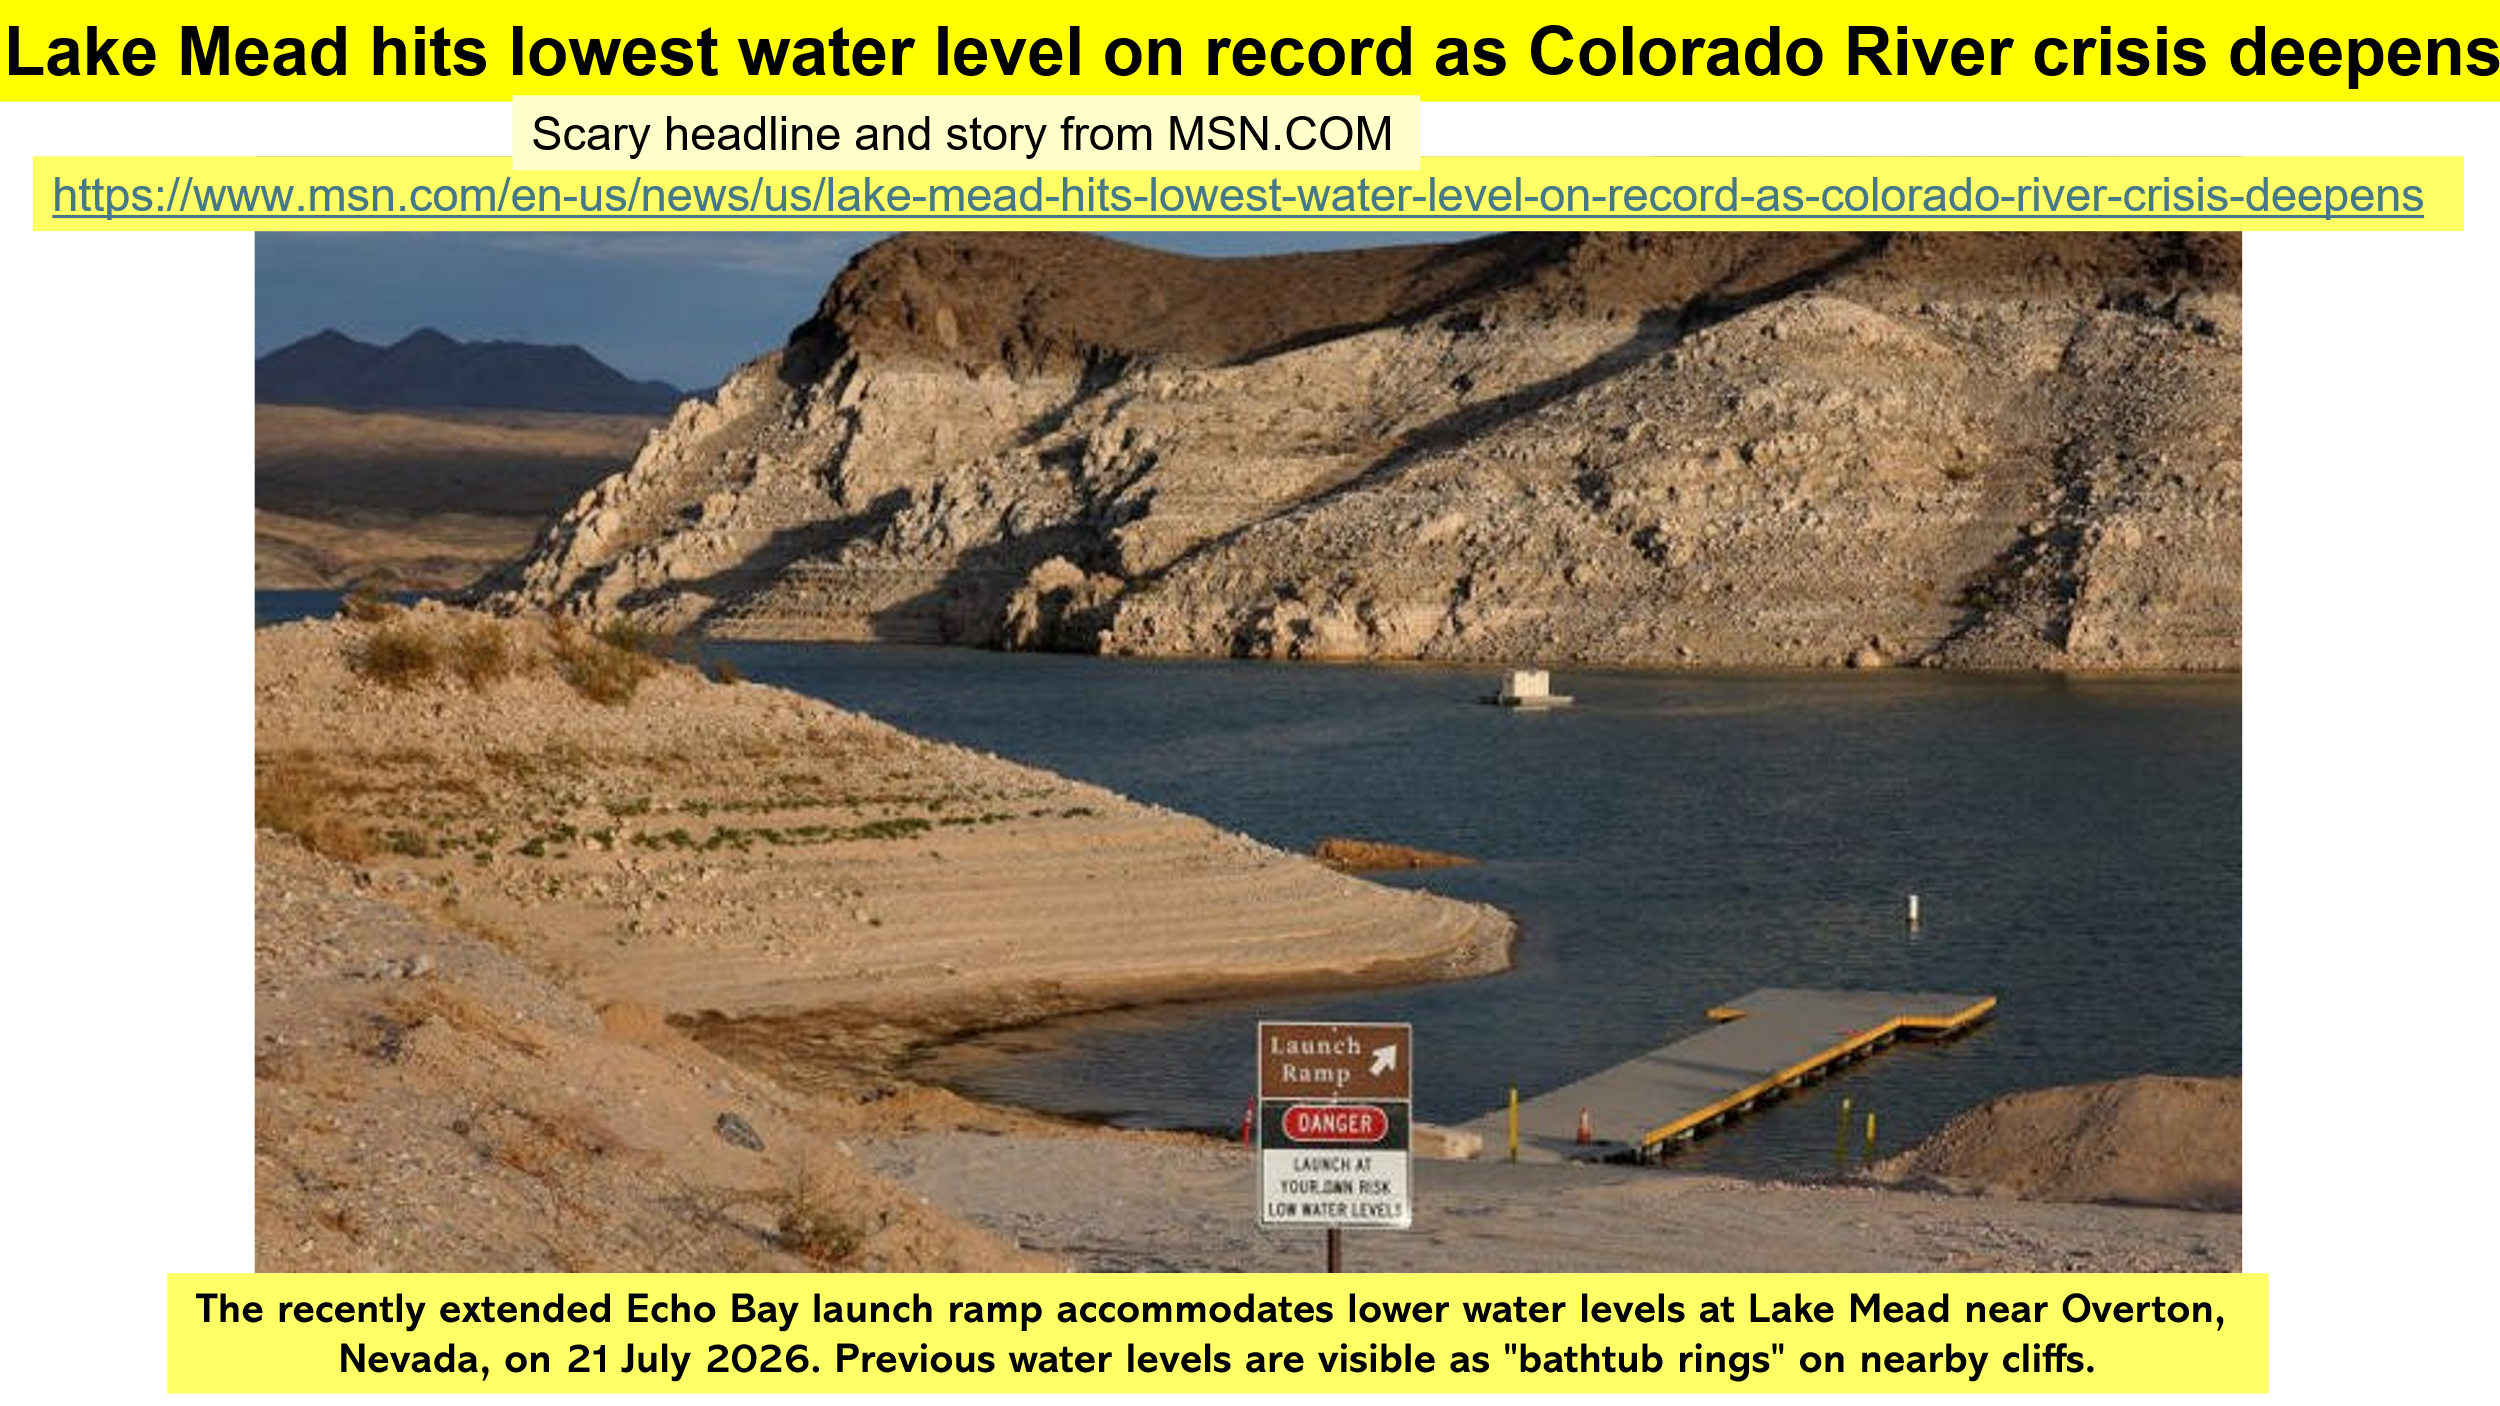
The above link, headline, and story form an example of the climate alarmism the Mainstream Media peddles today, to an audience apparently unable to engage in critical thought. Both the writers for MSN.COM and their readers appear to ignore the very real evidence of climate cycles of rainfall and drought in historical data. They are not alone.
At New Mexico State University a series on “Climate Education” peddled the Pablum of “CO2-Fueled Global Warming,” plainly ignoring the lessons of history and data. It borders on academic malpractice: so-called educators peddling “Global Warming” from the 1950s to 2012 and seemingly deliberately ignoring the very real hot record-setting temperatures of the dust bowl years of the 1930s set in states from Idaho to Texas and Montana to West Virginia, Pennsylvania, New Jersey, Delaware and Maryland.
SO MUCH FOR HOT TEMPERATURES, NOW RAINFALL
If the alarmists had examined stories and headlines from the recent past, they might have remembered that in 1983 there was a very wet period in the Mountain West. It was so wet in the Colorado River drainage basin that plywood flashboard had to be installed on top of the spillway at Arizona’s Glen Canyon Dam to avoid overtopping the spillway from the high water in Lake Powell. It was so wet in the Mountain West that Space Shuttle Columbia had to land at White Sands Space Harbor New Mexico. This historic landing happened because the planned shuttle landing runway at Edwards AFB was under water from the flooding rains of 1983’s El Nino, rains which had occurred on top of a 60-year period of the “Pacific Decadal Oscillation-Warm” cycle of wet weather.

In that same post, there were other stories of heavy precipitation in 2019 that the alarmists forgot to look up. Below are a couple of graphics from that same post, this first one from a story in the Las Cruces Sun News on 11 May 2019.
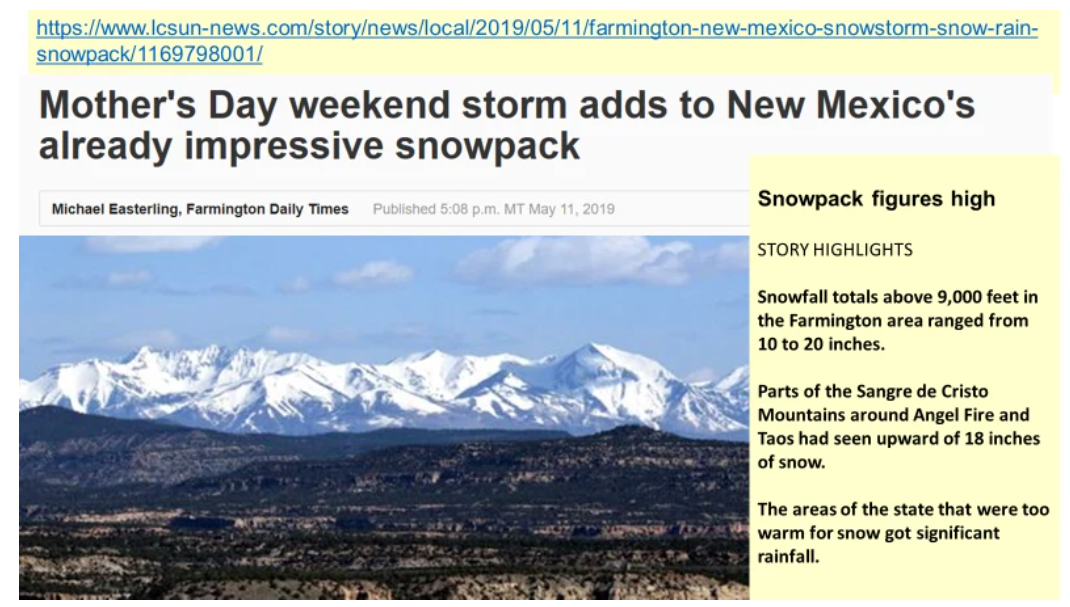
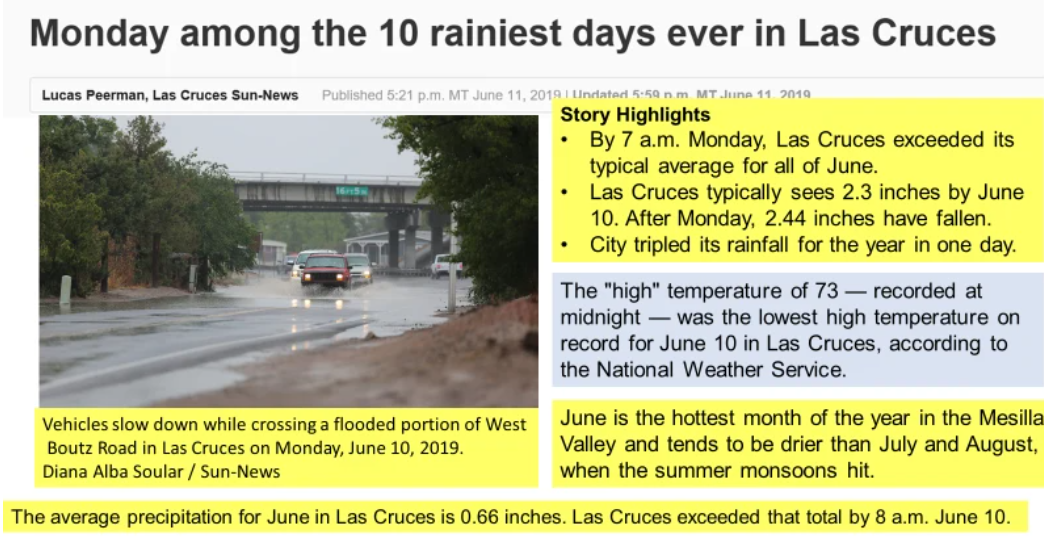
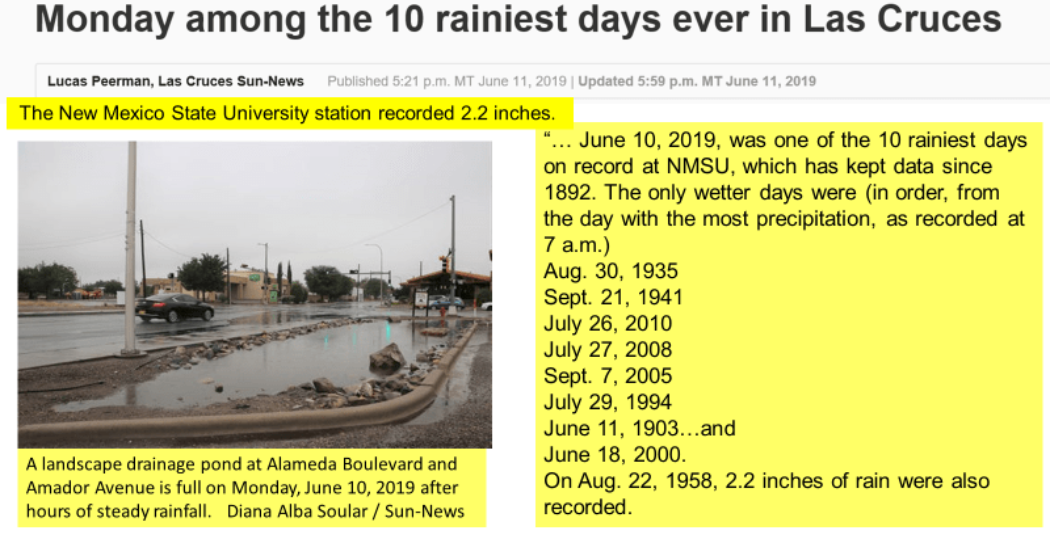
This 11 May 2019 snow and rain story was not published in isolation. Below is another story on the 10 Rainiest Days in Las Cruces, from only a month later, 11 June 2029.
El NINO AND THE 2026 CLIMATE OUTLOOK AND EL NINO’S RETURN TO THE USA
Today’s parallels to 1980 in Europe directly extend to weather (and climate) patterns seen on the map. In 1980, we had a persistent jet stream trough over central Europe, which led to the cold and wet winter and spring.
Nowadays, we know a lot more about El Nino-Southern Oscillation, often called ENSO, an earth system dynamic which controls much of the surface water temperatures of the Pacific, largest of the world’s oceans.
We now know that temperatures of the waters off the Pacific coasts of North and South America directly impact weather patterns of North and South America and even impact Atlantic and Gulf Hurricane seasons.
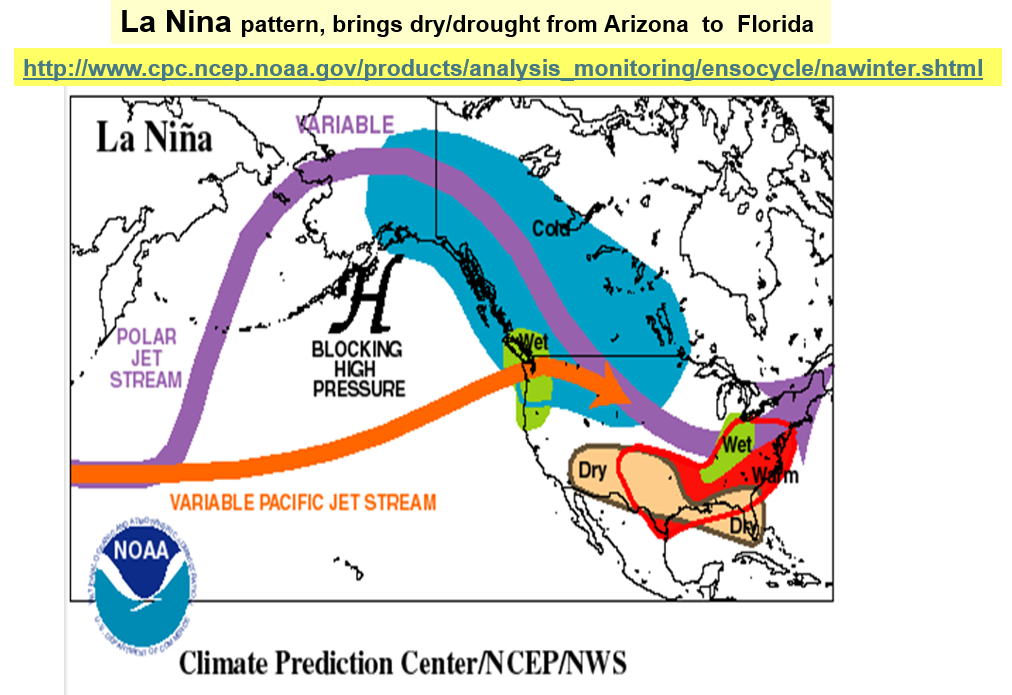
For a good number of years, and including earlier in 2026, we had experienced persistent ENSO-neutral and even a La Nina pattern, the pattern which brings drought to the US Pacific and Mountain West.
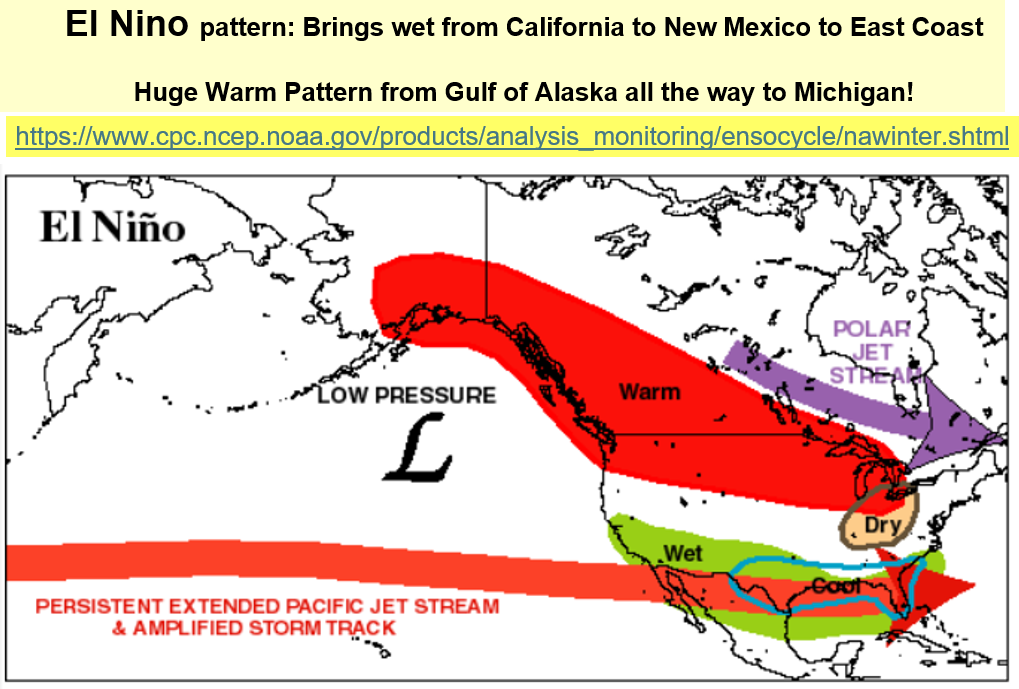
NOAA’s La Nina and El Nino patterns are shown below:
In 1980 I was concerned with the coming summer and fall conditions for the September REFORGER exercise in Germany, one season away. Today’s forecast is for a different situation, because the ENSO patterns last for 3-7 years, a different animal so to speak.
To begin, we’ll need to describe the ENSO-defining regions:
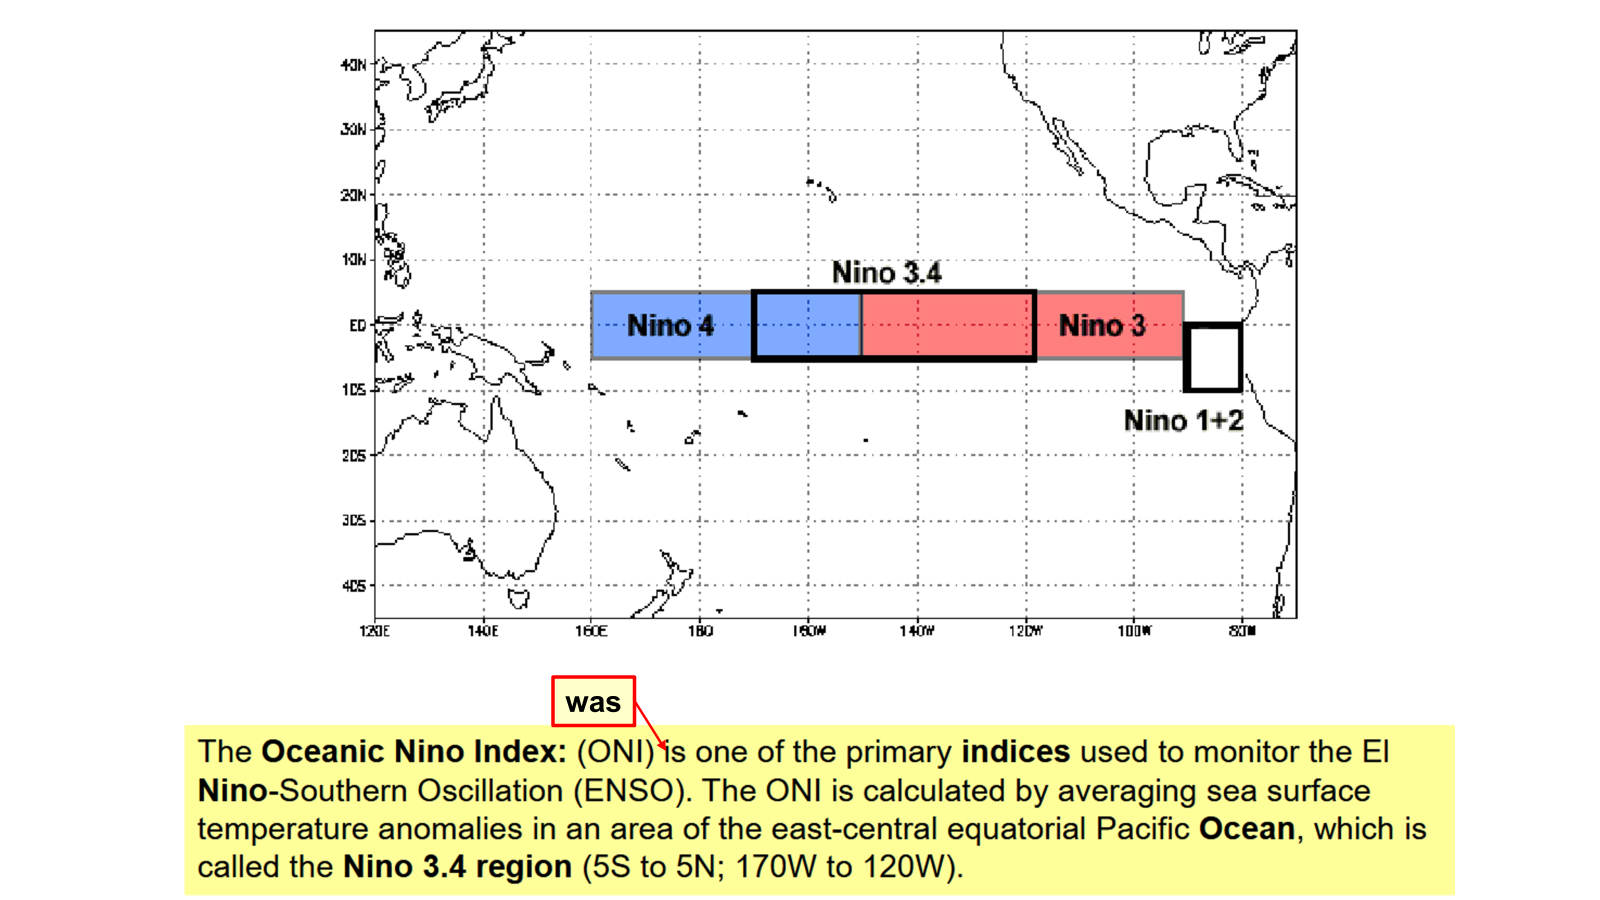
Up until 2025, researchers used the Oceanic Nino Index, the ONI, which was defined as the mean temperature of the Nino 3.4 region, above or below the average ocean temperature of that area. Because of long-term warming of the ocean, since 2025, a better fit has been achieved using a slightly modified index, one which accounts for the long-term warming; it is the Relative Oceanic Nino Index, or the RONI.
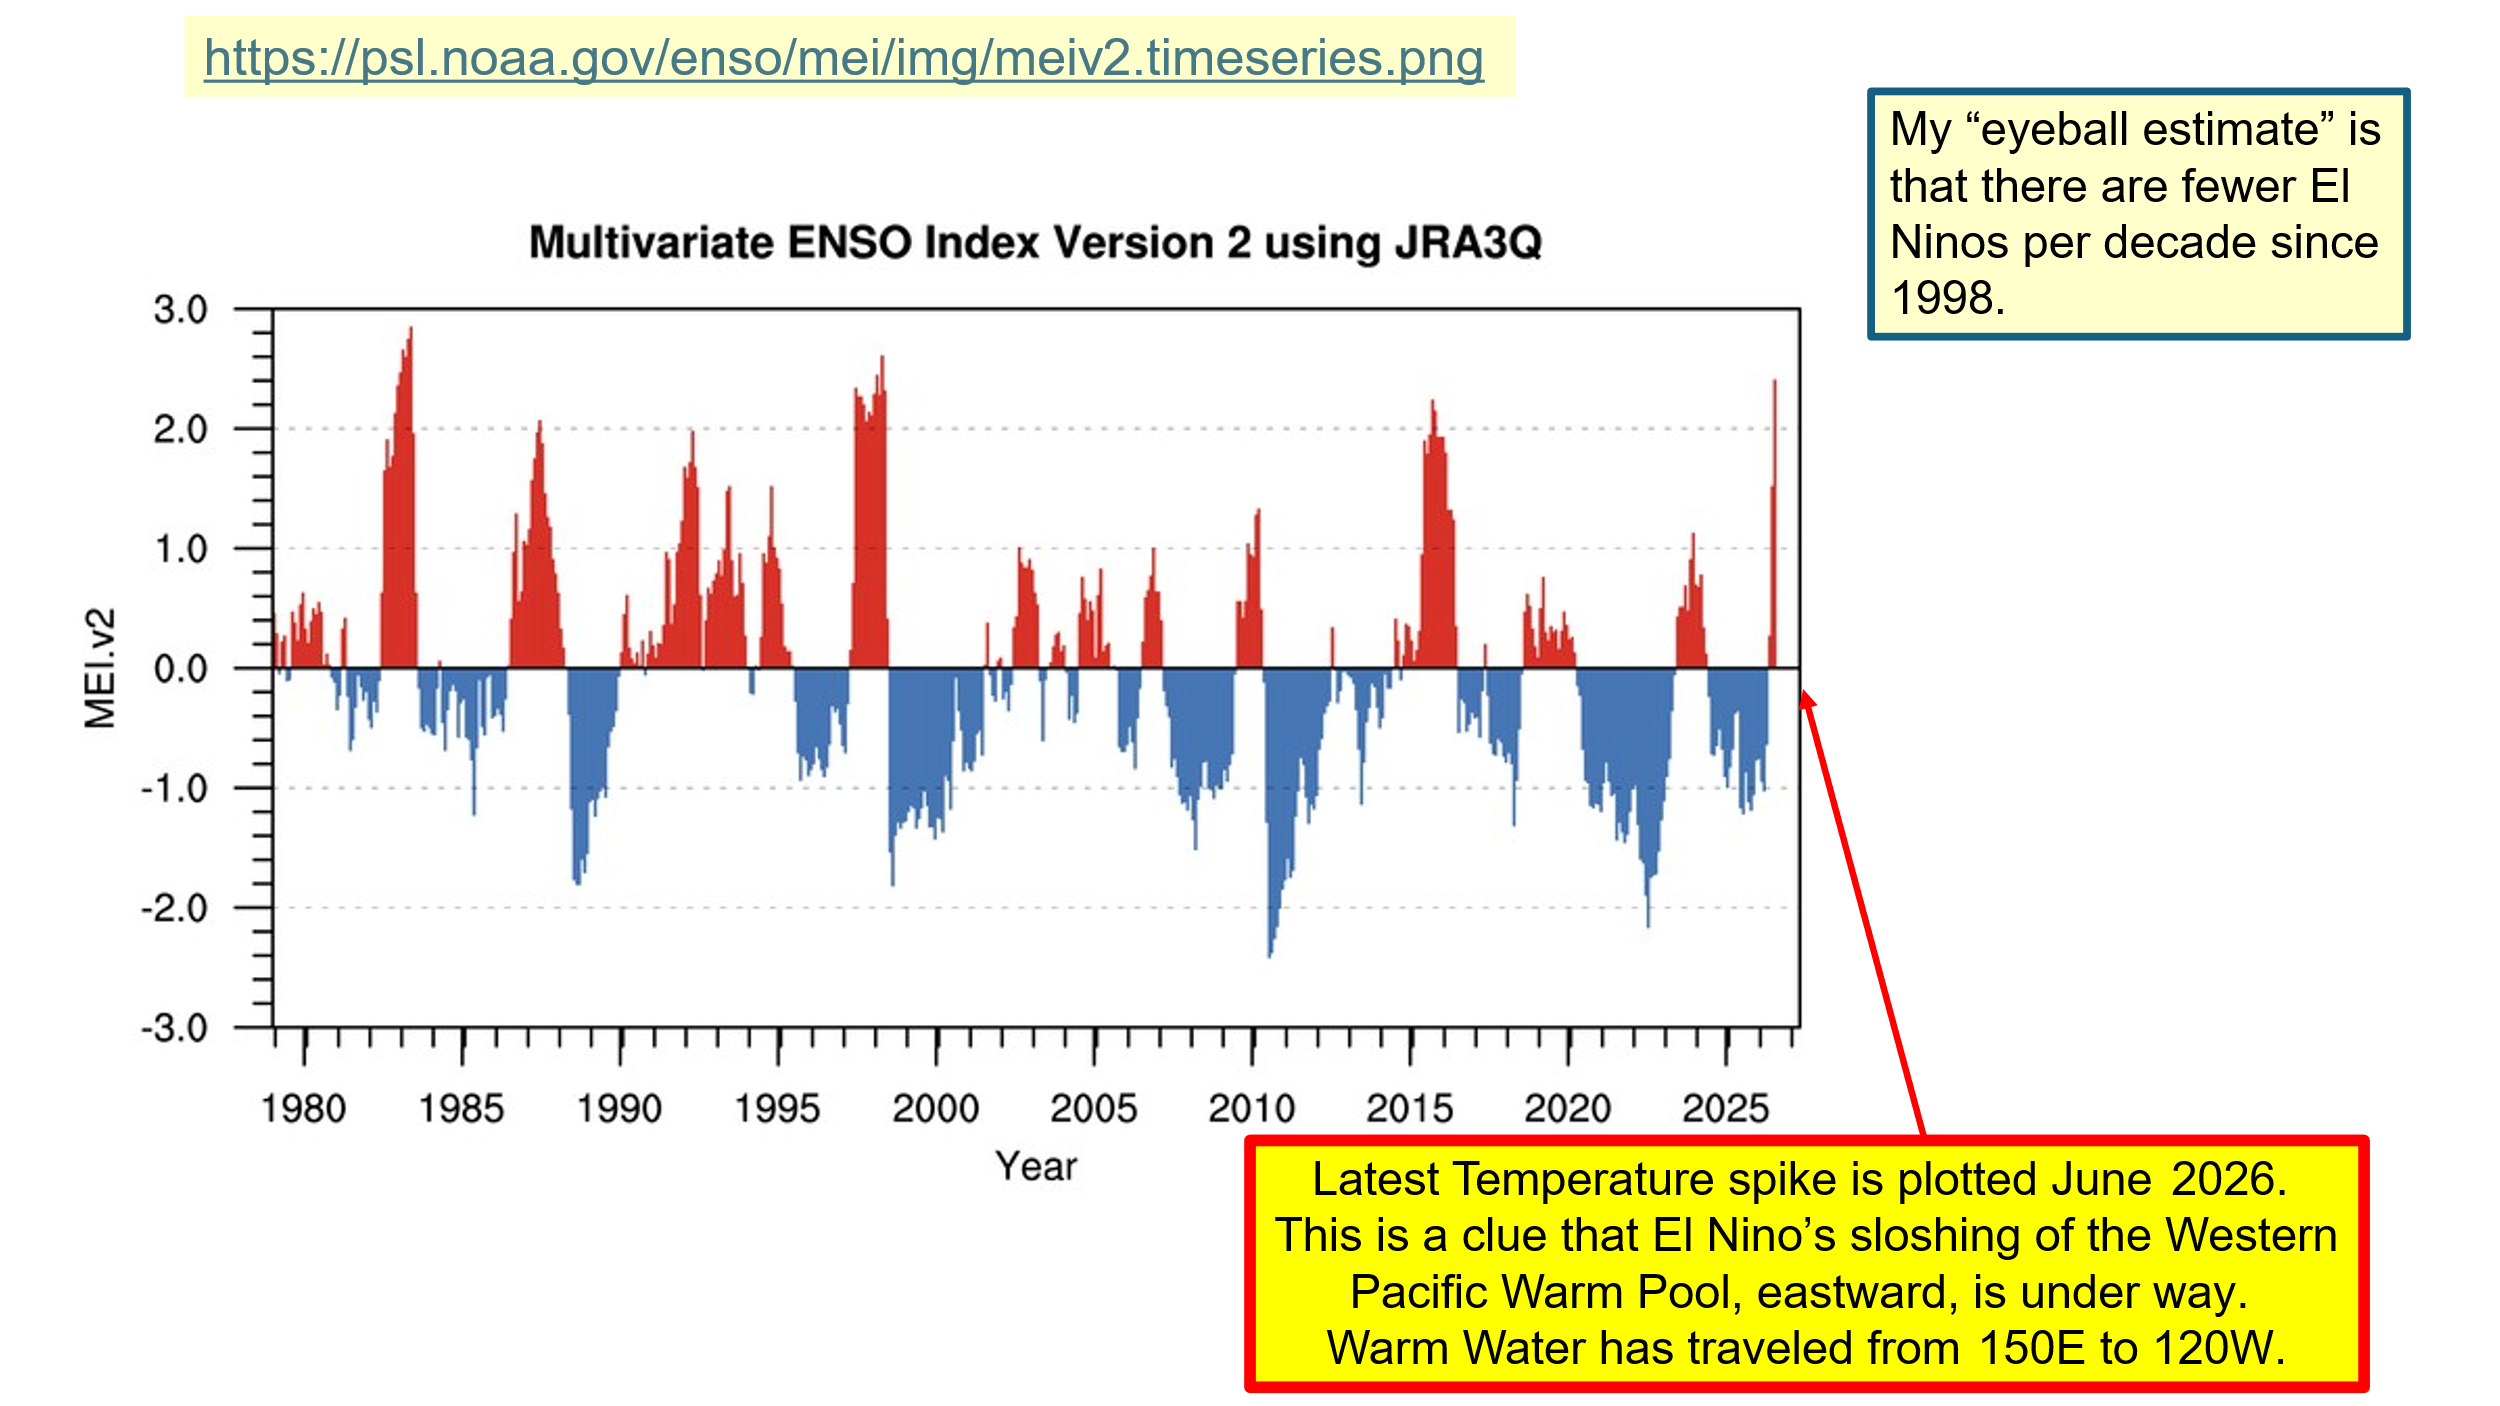
Let’s examine the RONI time series plot since 1980, in Figure 8, showing the red and blue areas in the time series above. El Nino periods are plotted in red, the times when the mean temperature of the Nino 3.4 region was warmer than that long term average ocean temperature in that region. The areas in Blue represent the times when the average temperature of the Nino 3.4 region was cooler than the region’s adjusted long-term average. These latter blue areas are La Nina years.
This plot helps us understand that there are times when El Nino can be short, maybe 3 years long, and times when El Nino can last 7 years. Notably, it seems as if the El Nino episodes were longer and stronger in the period 1980-1998, while post-1998 El Ninos are weaker and La Ninas now appear to be stronger and longer lasting.
I interpret the very last line in the temperature time series, the temperature spike of June 2026, as the leading edge of the warm water as it is currently (September 2026) sloshing from the Western Pacific Warm Pool, out by Indonesia, across the Pacific and, as we observe, now moving into the Nino 3.4 region. This leading-edge spike of temperature is the signal that the changeover from La Nina to El Nino was well underway in June 2026.
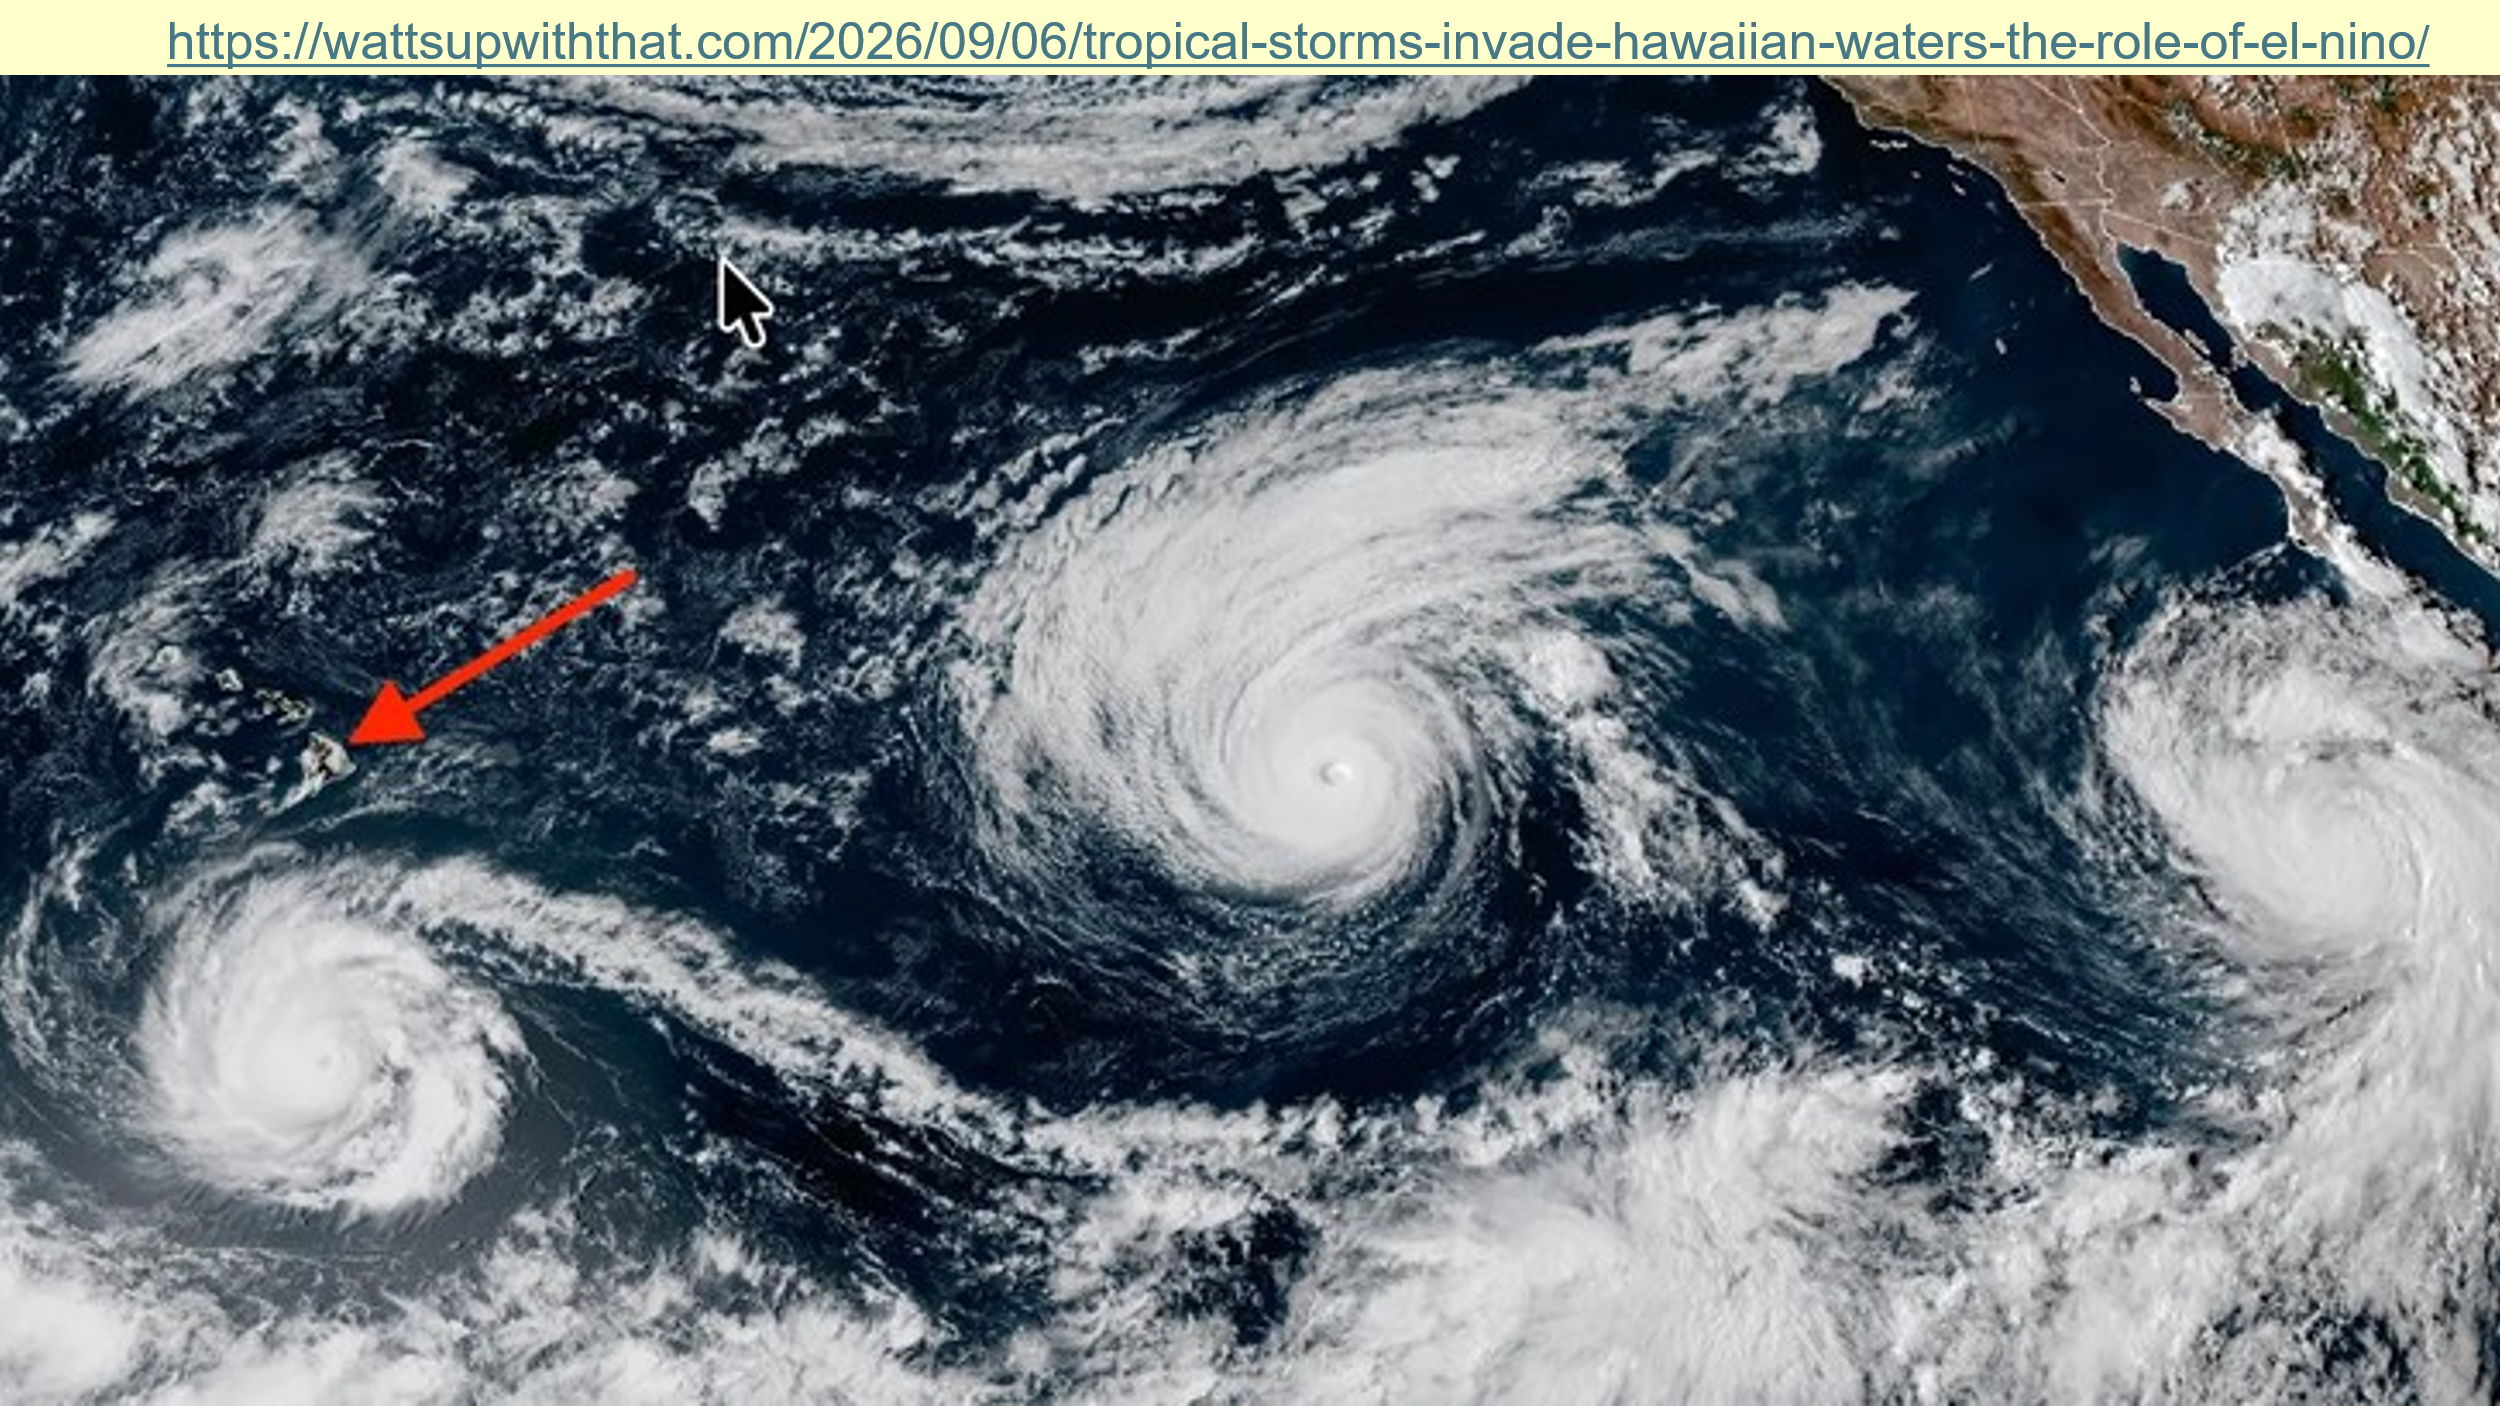
As of 6 Sep 2026, the 2026 hurricane season showed little activity in the Atlantic, but significant hurricane activity was present in the eastern Pacific. This situation graphically presented itself with three hurricanes between Baja California and Hawaii on 6 Sep 2026 as posted in Watts Up With That here. This post originally came from the Cliff Mass Weather Blog.
A harbinger for the now-in-progress development of El Nino-enhanced rainfall and snowfall for the upcoming cold season is the 6 Sep 2026 presence of three hurricanes at the same time. The three hurricanes existed simultaneously because of the presence of the El Nino warm water in that area, a region normally dominated by the upwelling of deep cold water from along the west coast of North America. Hurricanes in the region between Baja California and Hawaii are typically rare.
A USEFUL WEB SITE: EL NINO LIVE
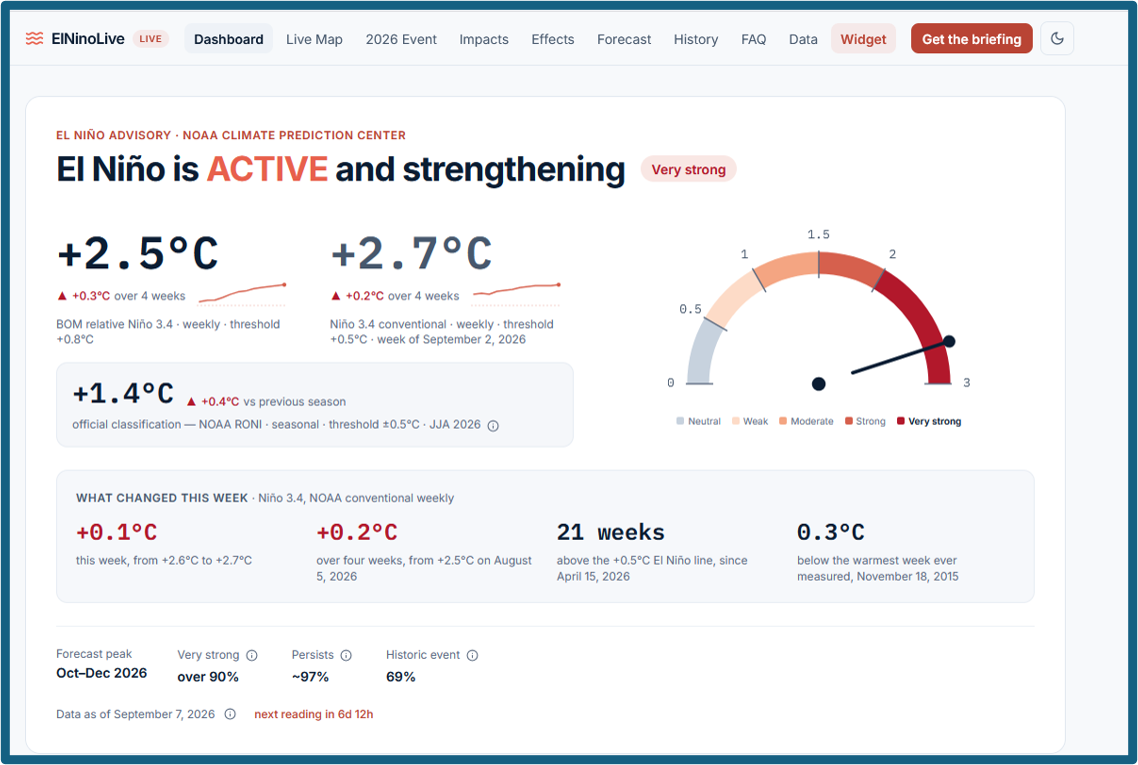
I found much useful information on this new to me web site, El Nino Live, starting in the Dashboard at https://www.elninolive.com/
A sample image of that dashboard, from 7 Sept 2026, is below.
However, the site is still very much under construction. The top section listings above the Dashboard can lead to ‘under construction’ error messages.
Clicking a page which does not yet exist yields the below error graphic:

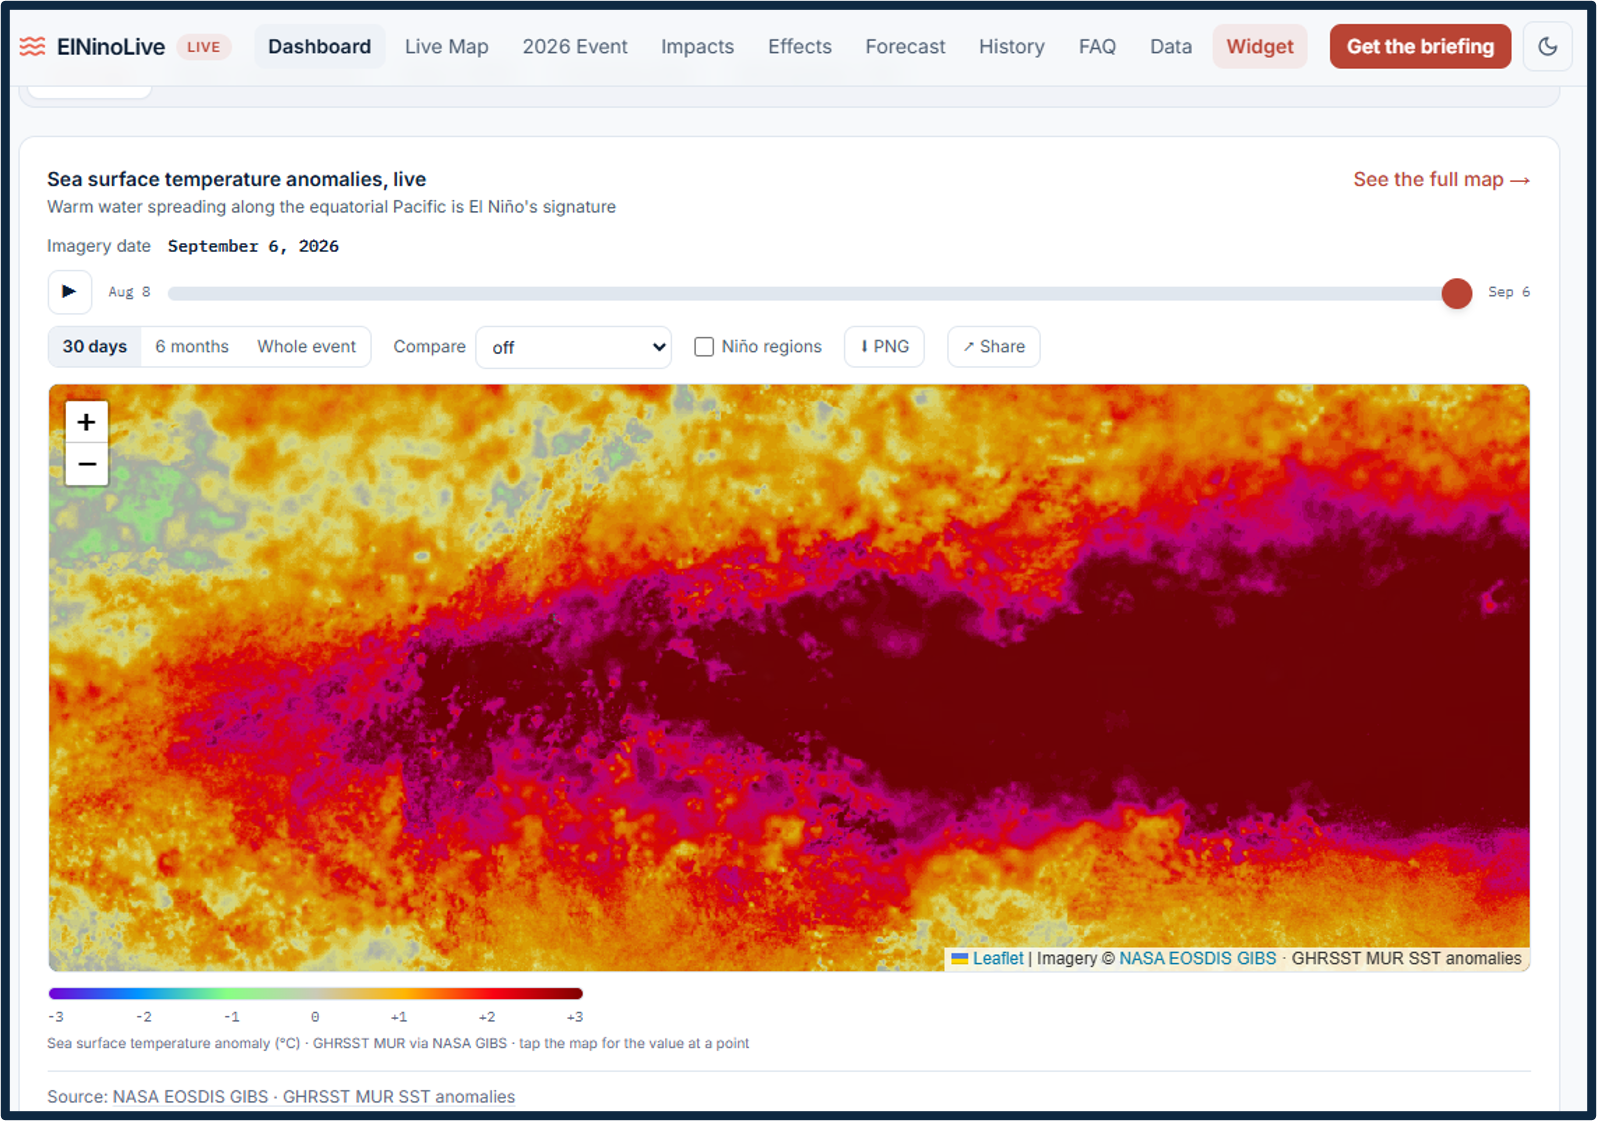
Scrolling down is El Nino Live’s second page:
SUMMARIZING WHERE WE ARE: IN SEPTEMBER 2026: EL NINO’S RETURN TO THE CONTINENTAL UNITED STATES IS HAPPENING NOWSUMMARY
In this post we see several indicators that El Nino is here.
On 6 Sept 2026 there were THREE hurricanes between Baja California and Hawaii. During La Nina and ENSO-neutral, hurricanes are rare in this part of the Pacific.
The replacement for the Ocean Nino Index, ONI, which is the Relative Ocean Nino Index, RONI, in its most useful form, is a time series of the temperature difference between the NINO 3.4 region and surrounding ocean areas. The June 2026 RONI showed a sharp spike of temperatures 2.4C above the mean, an indication that water from the Western Pacific Warm Pool of water over by Indonesia had sloshed across the Pacific to the Nino 3.4 region.
NOAA’s El Nino Live web site Sea Surface Temperature map, shows a large region of Pacific Ocean Sea Surface Temperatures along the Equator with +3C anomalies.
And the Dashboard at El Nino Live blurts it out loud: El Niño is active, very strong, and strengthening.
With clues such as these, it seems that those climate alarmists at the Los Angeles Times, The Guardian, and msn.com must have started typing at the keyboard without looking anything up.