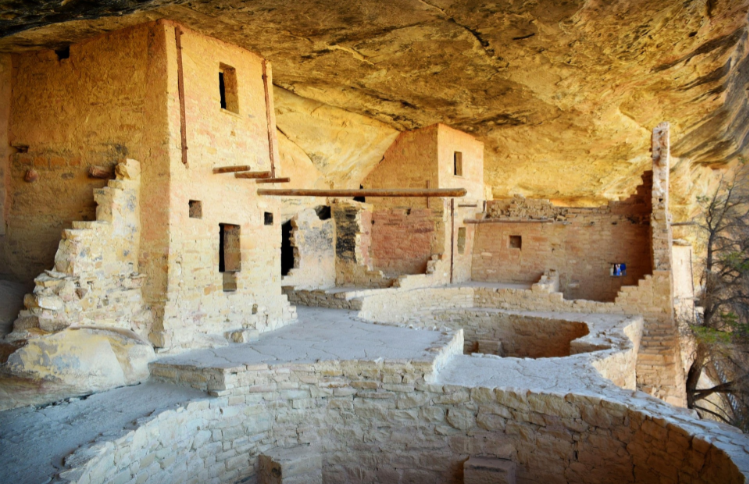
Proof that Carbon Dioxide Does Not Control Earth’s Temperature

nor do human emissions of CO2 from today’s burning of hydrocarbon fuels cause significant temperature increases. 

Robert W. Endlich

Notes:
1. When a chemical compound is in brackets, e.g., “<CO2> PPM,” understand this as “atmospheric concentration of CO2 in Parts per Million.”
2. 
Most Time Series are plotted with increasing time left to right, but sometimes they are plotted time increasing right to left.

INTRODUCTION

There are numerous claims by many Global Warming Adherents, Alarmists, and the UN’s Intergovernmental Panel on Climate Change that burning

Courtesy of Pixabay

fossil fuels and subsequent increases of <CO2> is driving warmer temperatures because of an alleged CO2 Radiative Forcing effect. However, when compared with past Earth Temperatures, the data graphics below show that present levels of CO2 are not influencing Earth temperatures to any measurable effect, nor are human emissions of CO2 causing any significant rise in temperatures.

Most of the data quoted by the IPCC is from the period of time subsequent to “The Great Climate Shift of 1976.” Continue reading “Proof that Carbon Dioxide Does Not Control Earth’s Temperature”

Comment on: “Critical Review of Impacts of Greenhouse Gas Emissions on the U.S. Climate”

Robert W. Endlich

[This is the author’s review of the Impacts of Greenhouse Gas Emissions on the US Climate, which he submitted to Regulations.gov in the necessary format.  Also, this is his post corresponding to his August 2025 Forum presentation.  Ed.]

INTRODUCTION

Carbon Dioxide molecule.  Image by Pixabay.

I received a Bachelor’s in Geology, Rutgers, 1962, Basic Meteorology certificate from Texas A&M, 1964, and an MS in Meteorology at The Pennsylvania State University, 1969. I served as a Weather Officer in the US Air Force for 21 years, 1963-1984, including overseas tours on Guam, in Thailand and Viet Nam, and in Germany, during the Cold War. In 1964, I was elected to Chi Epsilon Pi, the National Meteorology Honor Society, while an Air Force Basic Meteorology student at Texas A&M University. I worked as a Meteorologist for 49 years: 21 in the Air Force, 18 in the U.S. Army Atmospheric Sciences Laboratory, White Sands Missile Range, NM, and 10 in the Physical Science Laboratory Continue reading “Comment on: “Critical Review of Impacts of Greenhouse Gas Emissions on the U.S. Climate””

Death Valley World Record 134 deg. F is Biased ~10 deg. Too High

Roy W. Spencer, Ph. D.

[This blog by Dr. Roy W. Spencer was originally published on his blog site on 8 November 2024.  It is reproduced here under the fair use doctrine and with standing permission from the author. Ed]

Key Points:

      • Over the years, a few commentators have have argued that the world record highest temperature of 134 deg. F at Death Valley, CA recorded on July 10, 1913 is physically implausible.
      • Here I show quantitatively that the 134 deg F temperature is biased high, by about 10 deg. F.
      • Extensive historical research by William T . Reid has suggested the person making the temperature observations at Greenland Ranch likely replaced the official measurements from a thermometer in a Stevenson screen shelter with other measurements made next to the adobe living quarters.

Update #1 (11/8/2024): Fixed a few typos.

Update #2 (11/8/2024): For those messaging me about Furnace Creek temperatures reaching 130 deg. F in recent years, see Bill Reid’s summary of side-by-side measurements made there [and reported at an AMS meeting] showing the non-aspirated “official” equipment produces temperatures 2-3 deg. too high during light wind conditions.

Update #3 (11/9/2024): Bill Reid corrected my use of the term “mountain” stations to describe those not in Death Valley. Many of those stations are at desert plateau sites, so I have changed the term to “higher elevation” stations. I have also asked Bill to provide additional thoughts on this issue, which will be the next blog post here.

BACKGROUND

The “official” world record highest near-surface air temperature is 134 deg. F, recorded in Death Valley, California on July, 10, 1913 at Greenland Ranch, California an isolated location with no similarly sited stations with which to compare (say, within 10 miles and below sea level). Greenland Ranch was a man-made oasis created by the Borax people around the turn of the 20th Century, with water piped in from a nearby mountain. It has a rich history, but always against a backdrop of oppressive summer heat that few visitors (and even workers) could endure.

Continue reading “Death Valley World Record 134 deg. F is Biased ~10 deg. Too High”

2024’s Hurricanes Helene & Milton

 and claims their power was juiced by “Human-Caused Climate Change”  

Robert W. Endlich

Author’s note: This post is based upon the presentation graphics, on-line here, for the 19 October 2024 meeting.

PRELUDE: THE 2024 HURRICANE SEASON BEFORE HELENE

The 2024 Atlantic Hurricane season got off to a late start; Tropical Storm Alberto did not form until 19 June, the latest named storm since 2014. Then, Hurricane Beryl was a long-lasting (around 14 days) system; she began in the Cape Verde Islands region, tracked past Jamaica, crossed Yucatan, entered Texas near Matagorda and weakened, with her remnants getting to the eastern Great Lakes region, before dissipating, 11 Jul 2024.

From Wikipedia,

“Activity then quieted down across the basin for most of July after Beryl dissipated, with no new tropical cyclones forming due to the presence of the Saharan air layer (SAL) across much of the Atlantic.” Continue reading “2024’s Hurricanes Helene & Milton”

“Climate Change Making Days Longer,” studies say, Part TWO

By Robert W. Endlich
Author’s Note: This is Part TWO of a multiple post topicFigure numbers remain consecutive across the four parts of the post.

Part ONE is here.
Part THREEis here.
Part FOUR is here.
Presentation is here.

THE “SOLAR CONSTANT” IS NOW VARIABLE? YES, IT IS TRUE!
Image by Pixabay

When I was an Undergraduate in Basic Meteorology, 1963-64 at Texas A&M, and Graduate Student, 1967-69, Penn State, we learned that the “Solar Constant” was 2 calories/cm**2/sec.  But sometimes we used 1.94 cal/cm**2/sec ….in the CGS, the Centimeter-Gram-Second system of measurements.

Sometimes we used 2 Langleys per second…after this definition, in terms of Langleys, graphic below.

In 2024’s retrospect, the 1960s were seemingly in the Dark Ages of Continue reading ““Climate Change Making Days Longer,” studies say, Part TWO”